Agilent
General Packet Radio Service
(GPRS) Network Optimization
Measurement Challenges
Using Drive Testing
Application Note 1377-2
Increase your knowledge of GPRS.
Learn about GPRS:
• measurement model
• data performance measurements
• signal quality measurements
• RF performance measurements
and optimization
Table of Contents:
Page
Section 1: Introduction to GPRS . . . .3
Section 2: GPRS measurement model . . . .4
Section 3: Data performance measurements . . . .6
Section 4: Signal quality measurements . . . .25
Section 5: RF performance measurements . . . .26
and optimization
Section 6: GPRS measurement methodology . . . .30
In response to customer demand for wireless Internet access – and as a stepping-stone to 3G networks – many GSM operators are rolling out general packet radio service (GPRS). This technology increases the data rates of existing GSM networks, allowing transport of packet-based data. New GPRS handsets will be able to transfer data at rates much higher than the 9.6 or 14.4 kbps currently available to mobile-phone users. Under ideal circumstances, GPRS could support rates to 171.2 kbps, surpassing ISDN access rates. However, a more realistic data rate for early network deployments is probably around 40 kbps using one uplink and three downlink timeslots.
Unlike circuit-switched 2G technology, GPRS is an “always-on” service. It will allow GSM operators to provide high speed Internet access at a reasonable cost by billing mobile-phone users for the amount of data they transfer rather than for the length of time they are connected to the network.
This application note looks in detail at the challenges of measuring and optimizing GPRS networks. It builds directly on the first paper in this series, 'Understanding General Packet Radio Service (GPRS),’ AN-1377, which explains the new protocols, procedures, and other tech-nology changes that GPRS introduces to GSM networks.
Acronyms Used in This Paper
BSIC Base station identity code
BSS Base station subsystem
ETSI European Telecommunications Standards Institute
ftp File transfer protocol
GGSN Gateway GPRS support node
GPRS General packet radio service
GPS Global positioning system
IP Internet protocol
LLC Logical link control
MAC Medium access control
MS Mobile station, another term for mobile phone
MTU Maximum transmission unit
PDN Public data network
QoS Quality of service
RLC Radio link control
SDU Service data unit
SNDCP Sub network dependent convergence protocol
SGSN Serving GPRS support node
TBF Temporary block flow
TCP Transmission control protocol
UDP User data protocol
This paper discusses the measurements used to evaluate the performance of GPRS networks using drive test tools. GPRS measurements, which map into the model illustrated in Figure 1, are divided into three categories: data performance, signal quality, and RF performance.
Data Performance
This category emphasizes data-transfer-quality measure-ments (as perceived by customers) and GPRS layer-spe-cific measurements. Data performance measurements are used to establish quality benchmarks and to detail the performance of individual layers. We further divide the data performance into two sub-categories:
•IP/Application layer measurements, are made by simulating user application models and measuring the parameters directly perceived by the user (such as throughput and delay).
•GPRS layer measurements,are made at the layers below the application layer (for example, at the RLC/MAC/LLC layers) and are hidden to the user. These measurements offer insight about events on the GPRS layers that can impact the application layer performance.
In both cases, the measurements are made using a test mobile connected to a laptop PC with special data measurement software. We also need a server for end-to-end data measurements.
Signal Quality
This category consists of physical layer measurements and a subset of RLC and MAC layer measurements. The measurements are made using a test mobile phone.
RF Performance
This category consists of network-independent measure-ments such as interference, scanning, and spectrum analysis. The measurements require sophisticated RF test tools such as DSP-based RF measuring receivers.
Section 2:
GPRS measurement model
Measurement model
Data performance
Signal quality
RF performance
Application layer
GPRS layers
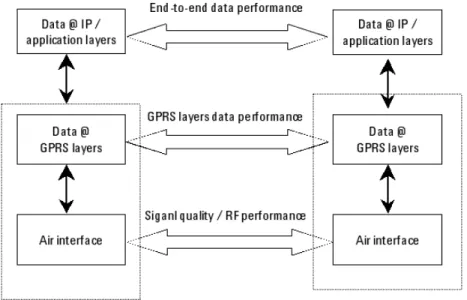
The relationship between the GPRS measurement model for data performance and the various protocol stacks is shown in Figure 2. Performance is measured at three layers: end-to-end data performance at the application layer, GPRS layer data performance at the GPRS layers, and RF quality performance at the air interface.
Figure 2. GPRS measurement model on the protocol stacks
End-to-end data performance
Data performance at the application layer is measured end-to-end; that is, we simulate a “real world” data pattern and send it to the other “end” – a test server, which performs the measurements and stores or sends the results back to the client, a mobile phone (MS). These measurements are made to quantify the user perception of data performance, and they are analogous to the voice quality measurements in GSM networks. We can also get information on the IP layer, depending on the type of server used and where it is placed in the network. This will be described later.
GPRS layer data performance
The data from the application layers is first processed by the GPRS layers and headers are added before it is sent onto the air interface. To a certain extent (depending on quality of service levels), the GPRS layers are capable of providing data performance information (such as LLC and RLC layer performance).
Signal quality and RF performance
These measurements are primarily physical layer measurements that provide signal level and quality information. The category may include optimization measurements such as interference monitoring and scanning.
Using drive test tools, we can make these measurements simultaneously. Consequently, when low application throughput is measured, the GPRS layers, signal quality, and RF performance measurements help to determine the cause of the problem.
Classes of service
Customers have different data usage requirements. Some need only low data rates for specific Web-based transactions; others need moderate data rates for applications such as e-mail; and still others need high data rates for tasks such as transferring or downloading large, Web-based files. Often customers have different requirements at different times.
GPRS has the flexibility to support dynamic management of network resources and therefore different service levels. Customers will have the option of deciding what quality of service they need and will know (at least in theory) what they are paying for. Service level choices will likely be divided into a hierarchy of quality bands or classes such as platinum, gold, silver, and bronze.
On the system side, ETSI has defined a set of quality of service (QoS) classes to support the implementation of tiered service levels:
• precedence class • reliability class • delay class
• peak throughput class • mean throughput class
These QoS parameters will play a key role in ensuring that customers get the data performance they expect.
Measurement objectives
Data performance is measured at the application and GPRS layers. Each set of measurements has its own objectives.
At the application layer
• A goal of performance measurements at this layer is to simulate the user model, first by simulating the data applications (such as Web browsing, e-mail, and file transfers), and then by modeling the data load. We need to simulate the asymmetrical data transfer pattern (more data in the downlink, less in the uplink) of real world applications.
• A second objective is to provide real time stamped measurements. This requires getting performance information in real time. In order to quantify and benchmark these measurements, we need to refer to standards such as ETSI's QoS parameters. At present these parameters are focused primarily on the application layer, and so benchmarking GPRS network performance against these standards will provide a good way to quantify user perception of data services.
At the GPRS layers
• Performance measurements at the GPRS layers are more complex, because many protocol layers are working simultaneously (for example, the RLC, MAC, and LLC). To identify a protocol layer of concern, we need to simulate the different QoS levels and carry out measurements at the different layers. Because data packets travel through different nodes in the GPRS network (BSS, SGSN, GGSN, PDN), we use GPRS layer measurements to identify the problem nodes. One additional objective of GPRS layer measurements is to provide control over the protocol layers.
Section 3: Data performance
measurements
Application layer measurements
We need to understand the data performance model at the application layer of testing before we delve into the bits and pieces of the performance parameters.
If we take a broad view of the GPRS data communication model, we see the application layer sitting on top. An application at one “end” (or node) of the network – the GGSN, for example – communicates with a similar application at the other end, perhaps using TCP or UDP protocols for acknowledged or unacknowledged modes of transfer, respectively. (TCP/UDP is discussed in more detail later.)
In this model, the application layer at the mobile station (MS) communicates with the IP layer of the MS and passes the application-layer datagram to the IP layer. This IP layer (which is standard TCP/IP) forwards the information to the GGSN by way of the different GPRS nodes and protocol layers. At the GGSN, the datagram information received from the MS is returned to the IP datagram level. Then the IP layer at the GGSN communicates with the IP layer at the other end of the call (at the PC) through the Public Data Network (PDN) IP interfaces.
Figure 3. Data transfer at the Application and IP layers.
When we measure data performance at the application layer, we want to send data from one end of our network and measure its performance at the other end, with the goal of understanding the end-to-end performance as experienced by the user. We also want to answer several questions that arise during our testing:
• What is the other end application and where does it reside?
• What part of our system is sending the data and what part is doing the measurement?
• What application layer measurements are needed and what are the end results?
Measurement configuration
at the application layer
There are two ways to carry out data performance measurements at the application layer: the loopback method and the end-to-end measurement method.
Loopback measurement
This approach requires a fixed unit at the network node, which collects the data coming in from the mobile and then sends the data back to the mobile (creating a loopback). The mobile compares the data sent with the data received. The process also can be reversed by simu-lating data traffic and sending it from the fixed unit at the network to the mobile and then back to the network. This approach raises several issues. For example, in drive testing the network, the objective is to make real time measurements, and we are interested in position-specific performance data. The loopback approach does not precisely support real world application models such as simultaneous, asymmetrical data transfer. Rather than measure uplink and downlink separately, it measures uplink and downlink as a total loop. Consequently, we do not know whether a problem exists on the uplink or the downlink. A better approach uses end-to-end measurements, as described in the following section.
End-to-end measurements
At the application layer, end-to-end measurements can be described as follows: One node transmits data and another node receives the data and measures its performance. For our test purposes, one end node is the mobile and the other is a measurement server. This server can be a located at the GGSN or somewhere in the PDN (Internet world).
Since the measurements are made end-to-end, in the uplink the server measures the data received from the mobile and sends back the results. In the downlink the measurements are made by the same software that generated the uplink data.
Quality of service (QoS) parameters
Whatever parameters we measure, the ultimate objective at the application layer is to get the user perspective. Thus it is essential to benchmark performance broadly against certain standards.
ETSI GPRS recommendations define quality of service for users according to specific parameters, including reliability, throughput, and delay. Our data performance measurements therefore focus on these parameters.
Reliability measurements
Reliability has been defined as the “probability of service data units (SDUs) getting corrupted, lost, duplicated, and received out-of-sequence.”
Service data units are IP datagrams at the application layer. ETSI has defined five classes of reliability at differ-ent interfaces. Since our application-layer measuremdiffer-ents are made from end-to-end, these reliability classes are significant.
If we know the negotiated reliability class of the phone, for example, we can make error performance measurements, correlate them with the assigned reliability class, and benchmark performance against the standard figures. Similarly, by performing absolute data-performance measurements, we can determine the highest achievable class of reliability in the network and based on the measurements assign reliability classes to customers.
Because SDU reliability is affected not just by errors but also by mis-sequence and loss of SDUs, reliability measurements also help us optimize routing paths, packet control parameters such as segmentation and compression, and system timers for controlling buffer overflow.
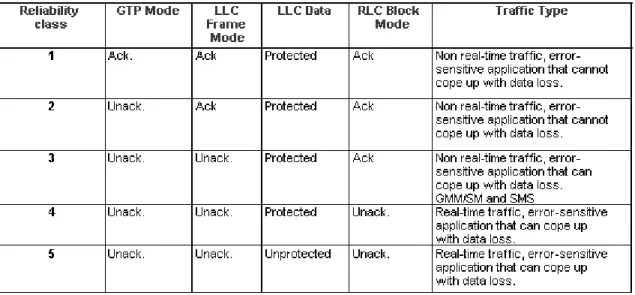
The table in Figure 4 shows the level of reliability desired for the five reliability classes defined by ETSI. Each class defines the interfaces on which protection and acknowledgments are mandatory.
Figure 4. ETSI reliability classes
For non-real time traffic, the highest reliability is required because the application layer cannot handle data corruption, loss, and other such problems. If traffic is real time, the application layer can manage retransmissions and thus the lower layers require less reliability.
Typically reliability classes 2 – 4 are preferred, with class 2 the ideal. The reason for this preference is that we can manage physical link reliability (quality) on the Gn interface and so ensure reliability on the GTP inter-face, which is generally in UDP mode. This helps ensure that retransmissions will not occur and thus provides a better throughput.
The LLC layer data transfer goes through the air inter-face as does the RLC. The probability of data corruption is low on the LLC layer if the RLC is reliable, but the probability of mis-sequencing is high as a high degree of segmentation takes place at the LLC and RLC layers. With different levels of reliability possible, the applica-tion layer must be able to detect errors when it operates at a higher reliability class. If errors are not corrected by the GPRS layers, then they should be by the application layer. For test purposes, we cannot provide protection at the application layer, so we cannot make the correspon-ding error performance measurements at this layer. Rather, errors must be measured using UDP on the IP layer at the data reception and generation ends.
Quantifying reliability
ETSI has attempted to quantify reliability based on the probability of SDUs being lost, duplicated, out of sequence, or corrupted. The SDUs that get corrupted by errors on the interfaces can be delivered to the end application and thus to users in that same corrupted form. Due to problems on the interfaces and in the retransmission process, SDUs also may be duplicated or arrive at the end node out of sequence.
GPRS is not a store-and-forward service. Customers are real time data users, so GPRS provides buffers to store information along the route to compensate for resource shortages. Delays in getting resources or transporting the information further depend on the protocols and equipment being used. The SDUs stored in the buffer may be discarded by a GPRS node if the holding timer expires; if this happens these SDUs will be lost. Thus, to meet a specified level of reliability, we must overcome a number of measurement challenges.
Reliability measurement challenge:
synchronization
One of the biggest challenges in measuring reliability is time synchronization. With an end-to-end measurement approach, we need to synchronize the time that the data is sent with the time it is received. In the downlink, syn-chronizing measurements is generally not a problem. But when the datagrams are sent in the uplink, they reach the measurement server only after some period of time has elapsed. The server then must send the results back to the MS, which adds more delay. As a result, the time at which the data was sent and the time at which the results are received can differ significantly. The position of the mobile may also have changed at this point, and thus the serving cell.
We can resolve this problem in a couple of ways: • We can synchronize the absolute timing at the MS and
the server (for example, using the Global Positioning System). The MS can then timestamp every datagram. The server then returns the datagram with the MS time-stamp and adds its own. The timetime-stamps can be corre-lated to the right position.
• The MS also can stamp every datagram sent in the uplink with the latitude and longitude. The same lati-tude and longilati-tude is returned by the server in the measurement results, providing the correct positions. If there is no synchronization, we can reduce the SDU size, which speeds the transmission of measurement results from the server back to the MS. We can also reduce the LLC block size. Both of these actions reduce the time it takes to transmit results back to the MS allowing results to be much faster.
Figure 5. Differences in the time data is sent and measurement results are received create a need for synchronization. Since GGSNs are located indoors, it is important to locate the GPS antenna outdoors in view of GPS satellites.
Reliability measurement challenge:
SDU size
When we make data performance measurements, another challenge is to decide the SDU size.
In practice, SDU size depends on the application in use. If we look at different layers in the protocol stack, we see the packet sizes that exist in GPRS. The size of an IP datagram can range from 1 octet to 65,535 octets. When a datagram arrives at the SNDCP/LLC layer at the SGSN, it is segmented into 1520 octets. There are other possibilities for controlling packet size in a general way. ETSI defines two SDU sizes for reliability measurements: 128 octets and 1024 octets. Whether we use the smaller or larger size will affect our measurements.
If SDUs are small in size, we have to send a larger num-ber of them. Even if a few of them get corrupted, we will still achieve good reliability percentages. On the other hand, if we use the larger size for our SDUs, we will send fewer of them. In this case, even if only a small number of SDUs get corrupted, the reliability percentage for our data transmission will drop. Further, retransmission of large SDUs adds delay and thus reduces throughput. On the other hand, the larger SDUs require less overhead and so help increase application layer throughput. An appropriate SDU reliability test involves two steps: •Simulate SDU performance– We can simulate IP
data-grams based on different possible applications, measure their reliability, and correlate the results with our throughput measurements.
•Measure raw bit errors– Measuring the raw bit errors gives us an indication of link (MS to GGSN) reliability. Then, correlating the raw bit error measurements with simulated SDUs of different size provides a good esti-mate of the reliability of the link for different applica-tions.
Agilent uses this two step process to measure IP layer BER performance.
Throughput factors
One major performance parameter that is evident to customers is throughput. Throughput is the rate at which data is expected or received over a period of time. Throughput is measured in bits/second. Simply stated, it is the data rate achieved against expectations.
A combination of several factors determines throughput: link reliability, compression, retransmission
mechanisms, and delay.
Link reliability
Errors in data transmission at the link can trigger retransmissions – that is, the same data being transmit-ted again. The result is a reduction in throughput. Throughput can be defined as either raw or effective. •Raw throughputindicates the rate at which data is
received. The data may contain errors and therefore would not be usable. The IP layer throughput is generally considered the raw throughput.
•Effective throughputis the rate of correctly received data. This is generally associated with the application layer.
Compression
This technique is deployed at the SNDCP layer at the SGSN to reduce the size of the data. Compression increases throughput on the air interface layer, which cannot offer high throughput due to physical layer limi-tations. Compression affects our measurements at the application layer. Although it increases throughput on the air interface, it may not do the same at the applica-tion layer, because the SNDCP has to decompress the data before passing it to the application layer, where lim-itations on the mobile phone's buffering capabilities may exist.
Retransmission mechanisms
These mechanisms are used to compensate for data impairments. But retransmissions are optional and depend on the negotiated QoS class. If retransmissions are on, then SDU size plays an important role in determining the throughput. (See our previous discus-sion of SDU size.) If retransmisdiscus-sions are not on, then GPRS layer throughput will be high, but if errors are present, the application layer throughput will suffer. In this case, since the lower layers are not compensating for errors, the application layer must.
Another important consideration is the air interface cell reselection done by the MS when it is in the packet transfer mode. Cell reselection results in a complete transfer of TBF (temporary block flow) rather than segmented LLC blocks. With many reselections there will be more TBF level retransmissions, which again impacts our throughput.
Delay
There are several causes of delay in packet transmission and reception. Delays can be caused by buffering. Because the interface types are different and each inter-face has a different maximum transmission unit (MTU) capacity, the data must be buffered. If buffering is exces-sive, however, buffers may overflow and SDUs will be lost. This triggers retransmission of the lost packets, which affects the throughput. Delay can also occur if acknowledgements are not received within a specified period (established by timers), again triggering retransmission.
Peak throughput
Defined by ETSI, peak throughput is measured at the Gi and R reference points in units of octets per second. It specifies the maximum rate at which we expect data to be transferred across the network for an individual PDP context. There is no guarantee that this peak rate can be achieved or sustained for any time period; sustaining peak throughput depends on the capability of the MS and the availability of radio resources. The network may limit customers to a negotiated peak data rate, even if additional transmission capacity is available. The peak throughput is independent of the delay class, which determines the per-packet GPRS network transit delay. The peak throughput classes are defined in Figure 6.
Measuring throughput
Throughput is measured at the application layer and at the GPRS layers. Throughput is affected by factors such as compression and reliability classes, which can create significant differences at the application layer and the GPRS layers.
Assigning a high reliability class to data will ensure that throughput at the GPRS layers is the same as throughput at the application layer, as error detection and retrans-mission will be enabled at all layers.
Lower reliability classes often result in higher through-out at the GPRS layers and lower throughput at the application layers, as errored SDUs can be passed to the application layer, which then must retransmit the data. Additionally, if the application layer is working in acknowledged mode, the estimated throughput rate will be accurate, but the actual throughput will be lower. This mode requires using TCP at the application layer. With TCP, the probability of detecting errors at the application layer goes down because only error-free data gets through. So, although we get a correct estimate of throughput, we compromise our reliability measurements.
A more suitable approach to achieving throughput is to keep the application layer in unacknowledged mode (thus using UDP). This scenario gives us high data rate and the ability to measure errors. By taking into account the number of errors versus the number of data packets received, we can calculate the application layer throughput.
This level of measurement flexibility is possible only by making end-to-end measurements.
End-to-end throughput measurements
End-to-end throughput measurements are made at the IP layer and the application layers.
• IP Layer Throughput
This measurement requires the use of UDP. Since UDP does not manage reliability, all the data coming in at the IP layer is transferred to the application layer. Recall that TCP and UDP are in the layer between the IP and application layers. The application layer is a test client, so we can measure the data coming in from the IP layer – that is, the IP throughput. At this stage we don't know how reliable the data coming in is, so the IP throughput measurement can include bad packets.
• Application layer throughput
This measurement can be done in both TCP and UDP modes. When TCP is used, reliability is included in the throughput measurement at the application layer. If UDP is used (which allows us to measure the IP layer performance, as discussed in the previous section), then the application layer throughput is calculated using the IP layer throughput and the bad or errored data at the application layer (that is, the measured IP BER).
In UDP mode, we therefore get both IP layer and application layer throughput information, as illustrated in Figure 7. In TCP mode, we measure only the application layer throughput.
Delay measurements
GPRS is not a store and forward service. It buffers data only temporarily during transmission resource assign-ment and handling of impairassign-ments. Data buffering can result in delay.
Delay can vary with time and load. Delay performance is based on the mean delay/second for data transfer through the GPRS network. High rates of delay can occur during momentary problems, such as a moment of peak traffic. To account for this, ETSI defines a 95-percentile delay, which is the maximum allowable delay for 95 percent of the SDUs that are delivered over the GPRS network.
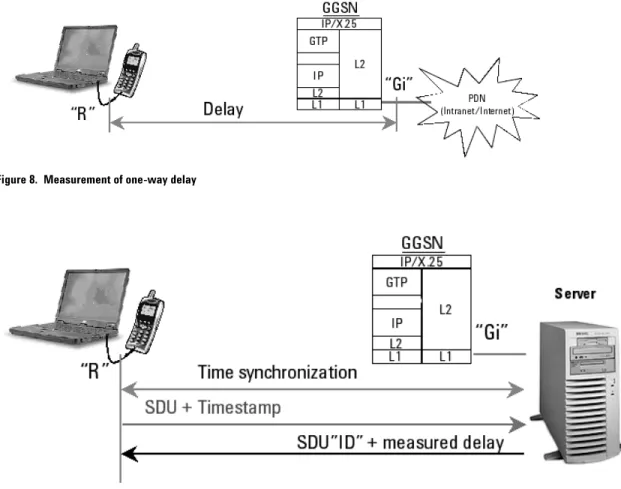
The delay parameter defines the end-to-end transfer delay incurred in the transmission of SDUs through the GPRS network. It is measured from mobile data terminal interface (“R”) to the Gi interface at the SGSN, as shown in Figure 8.
Figure 8. Measurement of one-way delay
To make absolute delay measurements (particularly one-way delay), we need to synchronize the absolute timing at the transmit and receive ends. This can be achieved by using GPS receivers at both ends or by using some other proprietary time synchronization technique. Once the clocks synchronize, the transmit end will timestamp the SDU and send it to the receive end. The receive end captures the SDU, adds its timestamp, reads the attached transmit end timestamp, and measures the delay (which is the time that has elapsed between the transmit and the receive timestamps).
ETSI defines delay measurements from R at the mobile to the Gi interface. If we want to benchmark against ETSI standards, the measurement server needs to be at the GGSN, within the firewall of the GPRS network (Figure 9). We can also locate the server in the PDN to identify PDN nodes that may be causing excessive delay.
Round trip time (RTT)
Since end-to-end delay requires time synchronization, which becomes difficult in certain implementations, RTT is another method of getting some information about the delay. The RTT is the amount of time measured from the point in time at which the last bit of the data packet leaves the application to the point in time at which the last bit of the acknowledgement is received. Thus RTT includes the time in both directions. Measurements of RTT are useful in understanding the impact on data per-formance of packet fragmentation and buffer size. A combined analysis on both RTT and one way delay allows us to troubleshoot problems of latency in the network.
QoS simulation
Simulation capability is another critical element of data performance measurements.
Customers are assigned QoS levels for different classes of service when they subscribe to a GPRS service. These parameters are also negotiated during PDP context activation. Data performance among QoS levels will vary significantly. If the GPRS network can achieve high QoS levels, those levels can be assigned to customers for a higher price.
To verify the data performance, we need the ability to simulate multiple data transactions at the different QoS levels. Because QoS levels are associated with measure-ment parameters at the GPRS layers, we cannot simulate data transfer patterns at the application layer.
Therefore, we require multiple handsets (or different SIM cards) to make data calls at the different QoS levels simultaneously.
Our multi-handset test model for measuring QoS levels should include a data performance test suite that can control the multiple phones and generate similar data-transfer patterns on each phone. With each phone assigned a different QoS level, the performance can be verified at each level and appropriate steps taken to correct any problems.
Data application simulation
To ensure quality based on the customer's perception of data services, we need to do end-to-end testing that involves simulation of data applications. There are two ways of doing this:
• Using a public internet server with commercial applications such as Web browsers, e-mail, or ftp
Because this approach tests over a wide area, it has sev-eral limitations, including the difficulty of maintaining constant data transfer and the lack of information about uplink quality. Additionally, performance data will include the Internet or backbone network after the GGSN, which prevents us from measuring only the GPRS network performance.
Figure 10. Client-server architecture. Two choices for servers: 1) Dedicated server running Agilent server software providing uplink
and downlink measurements and normally located at GGSN 2) Public internet server for downloading commercial web pages
(downlink measurements only)
• Using a dedicated test server
A test server can be used to simulate different types of data and different applications
Figure 10 shows two types of servers; dedicated test server at GGSN and public internet server in the Internet. Figure 11 shows four common types of applica-tions that we need to simulate in order to measure GPRS network data performance: e-mail, http, ftp, and RT.
This common data application at any given instant is asymmetrical – that is, the data transfer is in one direction, as the customer either reads or sends a message. The volume of data on average has not been high because most messages are textual, but e-mail service increasingly can involve downloads and uploads of large attachment files. Our simulation model for e-mail, therefore, should have the ability to generate variable size data and also provide the option of sequencing the sending and receiving of messages.
http
Web browsing is another common data application. Simulating a Web page presents some unique challenges. First is deciding an optimum size for the data. A Web page consists of several items, so even if two Web pages are same in size, the time required to download them under identical network performance conditions will vary. That is the way TCP works. To simulate an actual Web page, therefore, we need to simulate multiple, variable-size data sequences.
ftp
This older application for downloading and uploading files is still in use, although infrequently by commercial enterprises. Simulation of ftp requires unidirectional, bulky data.
RT
RT stands for real time services such as radio, live music, entertainment, and news channels. These data applications typically use UDP. They are becoming more popular, so our simulation model requires an option to receive bulky data with UDP to test these services.
End-to-end data test system
To carry out quality assurance of a GPRS network in terms of data performance, we need to be able to generate traffic that simulates real-world applications. As we can see, our test system requires some specific capabilities to carry out simulation and end-to-end data testing. First, it must be able to control the uplink and downlink transfer of data independently. To simulate a complete user experience of data services, the system needs to sequence applications; for example, Web browsing followed by sending and receiving of multiple e-mail messages.
The application sequencer should be able to introduce delays after each data application transaction, and delay should be user-settable. Simulation software must sup-port both TCP and UDP, as UDP is used to test real time services and to keep traffic live after a signal loss. Sometimes we need to run utility applications such as Ping and TraceRoute as a part of the data sequence. For engineering applications, it is useful to have this option as part of the data simulation sequencer.
Generally, end-to-end data performance testing is done between a client (a GPRS mobile) and a test server locat-ed on the Gi interface at the GGSN. But occasionally to verify the quality of our GPRS network we need to test data performance with external Public Internet servers; perhaps to determine whether a problem is occurring on the GPRS or IP core network. This kind of testing will become more prevalent as GPRS networks go online and customers begin to report delay and connectivity problems.
TCP versus UDP
In addition to knowing the types of applications and the basic requirements of data simulation, we need to understand the reasons for and issues related to the use of UDP and TCP protocols. Although many data applications today use TCP, we have seen that UDP occasionally is required to measure IP layer perform-ance. If GPRS layers are reliable, however, there is little chance of getting poor reliability on the IP layer and so UDP would not be necessary. To sort through any possible confusion, here are some of the reasons for choosing one protocol or the other.
TCP is a reliable protocol, since it uses acknowledge-ment and retransmission, and thus ensures successful packet delivery. A majority of commonly used data applications such as e-mail, http, and ftp use the TCP protocol. We will need to optimize the TCP parameters, so use of TCP for testing is valid. For quality assurance and to benchmark applications, we are well-justified in using TCP for end-to-end data performance testing.
UDPis found today in fewer applications, although it is used in some fast-growing real time services, including radio, entertainment, and news broadcasting. Therefore UDP is required to test the performance of these services on the GPRS network. Additionally, UDP is used for troubleshooting. For example, the throughput performance of GPRS networks can be improved by a tradeoff with reliability. If we start operating the GPRS layers (LLC and RLC, for example) under unacknowl-edged mode, we introduce the possibility of errored data entering the IP layer. The TCP protocol can manage the retransmissions, but as a result, the application layer throughput performance will differ significantly from that of the GPRS layers.
Because we cannot measure TCP layer performance, we can use UDP and allow corrupted data to pass to the test application layer. This test layer will display the reliability figures, which enable us to determine the rea-son for the throughput differences and, as a result, take action to improve reliability on the relevant GPRS layers. It is common knowledge that the weakest link in the GPRS network is the air interface. The air interface often will have several coverage holes and areas of poor quality where the data transfer deteriorates and the TCP connection breaks. When this happens, TCP enters the slow-start operation mode, sending a single datagram and waiting for an acknowledgment. When it receives the acknowledgment, it increases the sending window by one, and so forth. As a result, the data transfer rate slows, although the RF signal is recovered.
The RF engineers who carry out field tests will focus primarily on the GPRS layer (RLC, MAC, and LLC) performance. In order to optimize the RF interface, they need a continuous flow of traffic, which disappears when TCP enters the slow-start mode of operation. Under these circumstances, UDP may be a better option for testing.
Network utility measurements
Along with the need for QoS measurement at the application layer, there is a need for some network utility testing. The following network utility measure-ments are helpful for troubleshooting network problems:
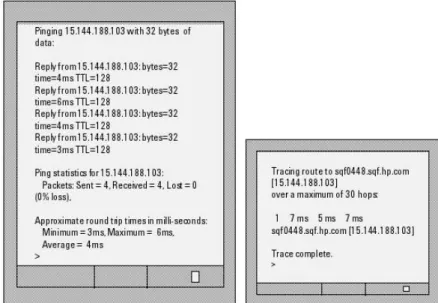
PING
This standard IP utility checks the availability of a desired connected server. It can be used to verify a PDP context activation initiated by the MS with the GGSN and associated Intranet or Internet server. Within in the PDN, we might be connected to a particular server that is transparent to the GGSN, since the GGSN derives the IP address from the domain server. To verify our server connection, we can use the PING utility.
TRACEROUTE
Also a standard IP utility, TRACEROUTE is used to trace and verify the different routers in a connection path. It can be used to verify routing tables and also to optimize them. This measurement is especially helpful at the MS end when a complex routing architecture exists between multiple SGSNs, GGSNs, and domain name servers.
Figure 13. Network utility measurements at the application layer. PING allows you to test connectivity with the server and to troubleshoot PDP context activation. TRACEROUTE lets you verify network routing and optimize routing tables and paths.
GPRS layer performance
Data performance at the GPRS layers is measured at the LLC and the RLC layers. The LLC layer is transparent to the BSS, so it is essential to measure performance at this layer. Whether a difference exists between the perform-ance of the LLC layer and that of the RLC layer is decided primarily by the reliability class used.
Figure 14. GPRS layers of the protocol stack. Measurements are made at the LLC and RLC layers.
GPRS layer measurements
Before we define the measurement parameters for GPRS layer performance, we will review the measurement model.
Performance at the GPRS layers can be measured only if a PDP session is on. This requires setting up a GPRS connection and establishing packet transfer; then we can measure the GPRS layer performance. To establish a packet data transfer, the PC controlling the drive test mobile needs to send and receive packets, and the phone control software needs to capture data about the per-formance of the GPRS layers from the mobile. In this case, a conventional test mobile phone will not work because it has only one serial port. For GPRS test-ing, we need a test mobile with two ports:
• Data port
This port will be controlled by the data performance software on the PC and will use AT commands to establish a packet data transfer session from the phone to the network. The PC on this port will send and receive application layer data packets. Data transfer (for applications such as Web browsing and file transfer) can be achieved manually.
• Trace Port
This port is similar to the port on a GSM test mobile. It can trace the network performance of the mobile and send all the available RF parameters and GPRS layer performance parameters.
Figure 15. Configuration for GPRS data measurements. The test mobile must have two ports: one for data transmission and reception (data
The following parameters are used to measure data performance at the GPRS layers:
At the LLC layer
• Reliability
Downlink (DL) – LLC retransmitted frame rate,
which is the number of frames retransmitted in the downlink
Uplink (UL) – LLC retransmitted frame rate,which is the number of frames retransmitted in the uplink
• Throughput
DL – LLC throughput,which is the data rate of LLC data frames in the downlink
UL – LLC throughput,which is the data rate of LLC data frames in the uplink
Client
Server
GGSN
At the RLC layer
• Reliability
DL – BLER (block error rate), which is the percentage of RLC data blocks with errors over the total RLC data blocks received
DL retransmitted rate, which is the number of RLC data blocks retransmitted in the downlink
UL retransmitted rate, which is the number of RLC data blocks retransmitted in the uplink
• Throughput
DL – RLC throughput, which is the data rate of RLC data blocks in the downlink
UL – RLC throughput, which is the data rate of RLC data blocks in the uplink
Figure 16. Agilent data performance measurement system with screen capture of GPRS layers (RLC/MAC/LLC) performance
measurements
C Value
BLER
The following information can be obtained from
measurements at the GPRS layers using the trace port of the test mobile:
• RLC information
DL and UL coding schemes (CS1, CS2, CS3, CS4) DL and UL TBF status (temporary block flow) DL and UL TFI (temporary flow identifier)
• MAC information
C value and signal variance
MS class (for example, 4 (3+1) and MS output power) Uplink and downlink timeslots allocated (for example, UL: TS1, DL: TS5, 6, 7)
Uplink allocation type (single, fixed, dynamic) Packet TCH
Packet timing advance
• GMM service state (GSM mobility management)
Idle, ready, standby
• GMM information
PTMSI, TLL, MCC, MNC, LAC, RAC
• SNDCP information
Data compression and header compression status
• SM state (session management)
PDP active, PDP active pending, PDP inactive, and PDP inactive pending
This section of the drive test measurement model includes signal quality measurements made by the GPRS/GSM mobile phone.
GSM measurements
The same types of trace measurements that were used for optimizing GSM networks are also used for GPRS networks. Some of the phone-based drive tests include: • serving cell information (BCH, Cellid, Rxlev, BSIC, etc.) • neighbor cell information (BCH, Cellid, Rxlev, BSIC, etc.) • path loss criterion (C1, C2)
Figure 17. Agilent measurement system with screen capture showing Layer 1 signal quality information
GPRS/GSM messaging
Messages in GSM are grouped in Layer 3 and Layer 2. The Layer 2 messages for GSM are LAPDm frames. The Layer 3 messages contain radio resource (RR), mobility management (MM), and call control (CC) messages. The GPRS Layer 2 messages are RLC/MAC messages, where-as the Layer 3 messages are GPRS mobility management (GMM) and session management (SM) messages.
Section 4:
Because the air interface is considered the weak link in GPRS, the air-interface quality plays a critical role in GPRS performance.
Data packets are sent in RLC blocks on the air interface. The data rate that can be achieved is decided primarily by the coding scheme. There are four coding schemes which provide data rates (per timeslot) of
• 9.05 kbps • 13.4 kbps • 15.6 kbps • 21.4 kbps
The main difference between these coding schemes is the level of protection that each is given.
As we reduce the level of protection we increase the data rate. However, if the air interface quality itself is poor, RLC blocks will be lost and retransmissions will occur. These retransmissions of course reduce the data rate and thus the throughput performance. Therefore, the most important factor in determining throughput on the air interface is RF quality, not the coding schemes. Coding schemes cannot be implemented successfully without taking into consideration the RF environment. It is difficult to maintain a high quality RF link over all the network. But if certain cells are designated carriers of high priority GPRS traffic, these cells can be opti-mized to achieve the best possible RF quality.
Signal quality and RF performance
Three important concepts govern RF quality and per-formance in a cellular network: coverage, interference, and handovers.
Coverage
RF coverage is essential to network performance. However, it is not a major concern for GPRS at this time, since most GPRS networks will be deployed over mature, optimized GSM networks.
Interference
A problem in existing GSM networks, interference also goes hand-in-hand with limited spectrum availability. There are several questions relating to GPRS system performance in an environment of heavy interference: • Is the existing 9 dB threshold for C/I sufficient to
maintain good data performance?
• Can we afford to leave a certain (small) percentage of the service area at or below the interference threshold? In GSM, even with patches of strong interference, it is possible to maintain an acceptable voice quality by frequent handovers. By enabling power budget han-dovers, we force the MS to switch to the best serving cell and thus prevent the MS from entering a zone of poor quality and attempting a quality-based handover, which would probably fail. Will this technique for avoiding interference patches work with GPRS?
Handovers
In GPRS a handover is called a cell reselection, and it can be controlled by the mobile or by the network. The decision to initiate a handover is based on receive-level and interference measurements made by the MS in the downlink.
Section 5: RF performance
Cell reselection in GPRS
A cell reselection (handover) controlled by the mobile is made based on signal level. The mobile decides on the target cell, starts the reselection process, and requests resources from the network. Potential problems for mobile-controlled reselections are the following:
• No quality control
In network-controlled mode “0”, which enables MS-con-trolled reselection, the cell reselection is conMS-con-trolled mainly by signal level. If there is no strong neighbor base station level (with the use of C1, C2, C31, C32 parameters), the mobile does not initiate reselection. As a result, if quality is bad, retransmissions will occur, affecting throughput.
• Frequent reselections
Except in the case of resource congestion, this phenomenon does not significantly affect voice quality in GSM networks. With GPRS, however, the mobile sends and receives data in RLC blocks that are a part of a TBF. When reselection occurs, the entire TBF needs to be retransmitted. A TBF could be much larg-er than an RLC block. Even if we assume one TBF to be one LLC frame of 1520 octets, at coding scheme 1 it would take 1.35 seconds to transmit. This calculation assumes that throughput is managed at 9 kbps, which is the coding scheme maximum, although maintaining this rate might not always be possible. The “ping-pong” effect of frequent reselections will continue to reduce the throughput.
It’s important to note that we cannot avoid a certain number of reselections, since the cells in a GPRS network are small to cater to capacity needs. What we want to avoid are the ping-pong reselections caused by poor quality patches in the network and footprint optimization. Reselections based on power budget can be optimized for GPRS customers by implementing a hierarchical cell structure.
As we can see, interference and cell reselection have significant impact on the quality of GPRS data calls. Thus, optimization of the RF environment for quality is an important step in achieving high data performance for GPRS networks. Today's GSM networks are optimized for voice traffic. Data traffic, however, is less forgiving of errors and requires better error performance than voice. There are additional ways of compensating for RF problems by manipulating the data transfer structure (packet size, segmentation, and coding schemes, for example). These techniques can be used when we reach the limits of optimization.
RF performance measurements
To optimize RF quality and performance, we use the fol-lowing types of receiver-based drive test measurements:
RF coverage measurement
What appears to be a simple RF coverage measurement is not as simple as it looks from the viewpoint of the mobile phone. The phone's receiver level average (RLA) measurement is a running average with accuracy somewhere in the range of +/-3 to 4 dB. A mobile phone in the idle mode will default to DRX mode slowing the update rate. To do proper coverage measurements, we need to use an independent measurement receiver that provides the necessary measurement accuracy and speed.
Figure 19. Agilent's receiver-based measurement system performs real time co-channel and adjacent-channel interference measurements, and its measurement software maps the results for easy visual inspection.
Interference measurements
Interference is a critical factor that affects performance. It may be co-channel interference from reused cells or adjacent ARFCNs, or it may be multipath interference from within the same cell. Once again we need accurate measurement tools. Co-channel measurements in particular need to be done without disturbing traffic. Refer to Figure 19.
RF scanning measurement
This measurement is critical for optimizing neighbor lists and the reselection parameters used to calculate C1, C31, and C32. Tools for RF scanning must be fast and accurate and should have the ability to measure channel power and identify each channel by decoding the base station identity code (BSIC). Refer to Application Note 1344 for more information.
Coding scheme optimization
Coding schemes govern the RLC and MAC throughput. The higher the coding scheme number (2, 3, 4), the lower the amount of protection (and hence coding) on the data. As a result, more data can be carried in the same size RLC blocks and throughput is increased. The downside of using less coding is evident during poor air interface conditions. Since protection is reduced, deteriorating air interface quality allows the blocks to be corrupted, which in turn starts the data retransmissions that eventually brings down the throughput rate.
Sometimes the effective throughput achieved by reducing the coding scheme turns out to be less than what we could have achieved by using more coding.
Air interface quality is the result mainly of poor RF coverage and interference. Since these quality parame-ters vary by location, and since interference varies also with time and traffic, it is difficult to predict accurately the quality of a geography. Effective optimization of coding schemes becomes a major challenge.
Generally, coding schemes are allocated to achieve good data transfer quality. For example, CS1 can cope with 9 to 10 dB of C/I, but CS4 would need a C/I ratio of 15 dB or more. Since C/I varies with time and geography, it is difficult to fix the coding scheme on the higher side (2, 3) on per-cell basis to achieve higher throughput. To cope with these challenges, GPRS has two types of coding scheme (CS) assignments:
• Fixed
This scheme assigns a fixed code to a cell. (There may be variations on the lower side of the channel
assignment to manage service classes.) To decide what coding scheme to use, we require a good measure of the cell's RF quality, which is determined primarily by the coverage and interference. With the RF quality
information, we then can fix a probability factor and set the coding scheme. For example, if 95% of the cell area has a C/I measurement of >12 dB and 100% of the cell area (outdoors) has coverage of better than -95 dBm, we assign CS2 to this cell.
This scheme successfully manages a constant throughput performance, but under heavy traffic conditions the throughput of customer traffic may suffer. Some customers may be in locations where the RF quality is more suitable for CS3 or CS4.
• Dynamic
With this scheme we change the coding scheme continuously during the data transfer. Ideally we should measure the coverage and interference and then decide the CS value. But GPRS phones currently do not report information about downlink quality to the network, and it is difficult to estimate downlink interference based on information about the uplink quality. Since the uplink and downlink are typically balanced for losses, the practical way today to achieve dynamic coding is to use the C-level (coverage indicator: received power aver-aged over the number of timeslots used) to determine the coding scheme. The C-level thresholds are set to switch between coding schemes. For example, if the C-level is less than -90 dBm, we use CS1, but if the C-C-level is between -89 to -70 dBm we will change the coding scheme to CS2.
It is important to note that we are assuming that if the signal level is better than a certain value, the C/I should also be within the desired range. However, a good signal level does not always guarantee a good C/I ratio. Thus the first step in optimizing a dynamic coding scheme is to do a power versus C/I measurement to establish the thresholds. The next step is to consider some QoS parameters separate from just the C-level. An interesting parameter might be RLC retries. As the phone sends an acknowledge message and reports the bad blocks, a network based on this measurement can alter the coding scheme.
There are different ways to perform GPRS measure-ments and to optimize GPRS networks. We will consider three methods here.
GPRS layer performance and signal
quality measurements
This approach gives us an idea of the data performance at the RLC and LLC layers only. But we must also focus on throughput measurement, which is linked to parameters such as reliability and delay. If we perform a simple trace measurement, using a test mobile and making a data call as shown in Figure 20, we will get a measure of the throughput at the RLC and LLC but we will not get absolute reliability figures. Errors in the data received at the application layer require visual inspection. Throughput might be poor at one instant due to heavy traffic and assigned QoS, but the situation could improve at another time.
Figure 20. Setup for testing GPRS layer performance and signal quality only
Section 6: GPRS
measurement methodology
GGSN
Complete data performance
and signal quality measurements
This method involves making a complete set of data performance measurements at the application layer and at the GPRS layers. At the IP layer where data is transferred, we can measure BER and SDU reliability. As Figure 21 indicates, downlink data and uplink measurement results received from a test are analyzed at the data port node by a data measurement suite running on a computer. GPRS layer measurements are initiated at the trace port by the test mobile phone.
An end-to-end approach of setting up a data call using a dedicated test server also gives us the flexibility to simulate different user data models such as Web browsing with higher downlink and lesser uplink loads; e-mail with frequent short and long transactions; and file transfers. We can also benchmark the usability of the network from a customer application perspective. For example, our tests might show that the network is very good for short data transactions, good for Web browsing, and poor for large file transfers.
Figure 21. Setup for making complete data performance measurements and signal quality measurements only
Dedicated
Test Server
Methods 1 and 2 with an integrated
digital receiver
Integrating a digital receiver with the data performance measurement system (Figure 22) gives us the ability to measure, study, and optimize the RF environment and then to select the data control parameters (coding scheme, segmentation, LLC parameters, best offered QoS, or tariffing plan, for example) based on our study.
Figure 22. Setup for combing all test methods and integrating a digital receiver into the test process
Because there are fewer customers in the early days of network deployment, loading is not generally an issue. Data performance measurements under load and no load conditions will vary considerably.
When the network is in full service, an integrated test approach can be used to verify data performance. Likewise, the receiver can be linked to the mobile phone to measure RF quality parameters (such as co-channel and adjacent-channel interference, fading, and missing neighbors). Finally we can merge the data performance measurements with the RF measurements and process the information to more completely optimize the GPRS network.
Dedicated
Test Server
Figure 23. Agilent OPAS32 post-processing software displays RLC retransmission, co-channel interference, and cell reselection
In the figure above, a graph generated by the Agilent OPAS32 post-processing software displays the RLC retransmissions in red, co-channel interference (C/I) in blue, and cell reselections (change in ARFCNs_) in green. As shown, when C/I is good (above the 10 dB marker on the Y-axis), the RLC retries are given as “0%.” As the mobile does a reselection to Channel 122, the retry values go up . This indicates that the quality is bad in the cell with ARFCN 122. We can also see that C/I values have dropped below 10 dB, which indicates that the quality is bad because of an RF problem – co-channel interference in this cell.
Without a receiver, the plot would have been able to display only the retries and reselections, and so we would be able to identify the bad cell, but not the cause behind the problem, which the receiver's measurement capability identifies as co-channel interference.
This illustrates Agilent's total GPRS test solution, which measures data performance, gets signal information, and troubleshoots the problem using the OPAS32 analysis capabilities.
Agilent solutions for
GPRS measurements
For more than 60 years, Agilent has been helping communications companies meet their technology and business goals. Our comprehensive portfolio of test and monitoring solutions cover all generations of wireless communications, from first generation to 3G, and they span the network life cycle from network planning and design through optimization, maintenance, and competi-tive benchmarking. Agilent also offers OSS solutions for managing integrated mobile voice and data networks and for service assurance.
Our phone-and-receiver based drive test system for optimizing GPRS networks is a complete solution that combines end-to-end data testing with air interface measurements. The same system can be used in an ergonomic backpack for pedestrian and indoor testing. For more information about all of Agilent's wireless voice and data test solutions, visit us on the Web at http://www.agilent.com/find/wireless
Additional Agilent literature
Understanding General Packet Radio Service (GPRS)
Application Note 1377 ...5988-2598EN
Optimizing Your GSM Network Today and Tomorrow -- Using Drive Testing to Troubleshoot Coverage, Interference, Handover Margin and Neighbor Lists
Application Note 1344 ...5980-0218E
Optimizing Your GSM Network Today and Tomorrow -- Using Drive Testing to Estimate Downlink Speech Quality
Agilent Technologies’ Test and Measurement Support, Services, and Assistance
Agilent Technologies aims to maximize the value you receive, while minimizing your risk and prob-lems. We strive to ensure that you get the test and measurement capabilities you paid for and obtain the support you need. Our extensive sup-port resources and services can help you choose the right Agilent products for your applications and apply them successfully. Every instrument and system we sell has a global warranty. Support is available for at least five years beyond the production life of the product. Two concepts underlie Agilent's overall support policy: "Our Promise" and "Your Advantage."
Our Promise
Our Promise means your Agilent test and measurement equipment will meet its advertised performance and functionality. When you are choosing new equipment, we will help you with product information, including realistic perform-ance specifications and practical recommenda-tions from experienced test engineers. When you use Agilent equipment, we can verify that it works properly, help with product operation, and provide basic measurement assistance for the use of specified capabilities, at no extra cost upon request. Many self-help tools are available.
Your Advantage
Your Advantage means that Agilent offers a wide range of additional expert test and measurement services, which you can purchase according to your unique technical and business needs. Solve problems efficiently and gain a competitive edge by contracting with us for calibration, extra-cost upgrades, out-of-warranty repairs, and on-site education and training, as well as design, system integration, project management, and other pro-fessional engineering services. Experienced Agilent engineers and technicians worldwide can help you maximize your productivity, optimize the return on investment of your Agilent instruments and systems, and obtain dependable measure-ment accuracy for the life of those products.
By internet, phone, or fax, get assistance with all your test & measurement needs
Online assistance: www.agilent.com/find/assist Phone or Fax United States: (tel) 1 800 452 4844 Canada: (tel) 1 877 894 4414 (fax) (905) 282-6495 China: (tel) 800-810-0189 (fax) 1-0800-650-0121 Europe: (tel) (31 20) 547 2323 (fax) (31 20) 547 2390 Japan: (tel) (81) 426 56 7832 (fax) (81) 426 56 7840
Product specifications and descriptions in this document subject to change without notice. Copyright © 2001 Agilent Technologies Printed in U.S.A. September 30, 2001 5988-3605EN Korea: (tel) (82-2) 2004-5004 (fax) (82-2) 2004-5115 Latin America: (tel) (305) 269 7500 (fax) (305) 269 7599 Taiwan: (tel) 080-004-7866 (fax) (886-2) 2545-6723 Other Asia Pacific Countries: (tel) (65) 375-8100 (fax) (65) 836-0252 Email: tm_asia@agilent.com