CHARACTERISATION OF VISCOELASTIC RESPONSE OF SWOLLEN ELASTOMERS
MAHAK FAZAL
FACULTY OF ENGINEERING
UNIVERSITY OF MALAYA
KUALA LUMPUR
2013
CHARACTERISATION OF VISCOELASTIC RESPONSE OF SWOLLEN ELASTOMERS
MAHAK FAZAL
RESEARCH REPORT SUBMITTED IN PARTIAL FULFILLEMENT OF THE
REQUIREMENTS FOR THE DEGREE IN MASTER OF ENGINEERING
FACULTY OF ENGINEERING
UNIVERSITY OF MALAYA
KUALA LUMPUR
University of Malaya
ORIGINAL LITERARY WORK DECLARATION Name of the candidate: MahakFazal
Registration/Matric No: KGG110012
Name of the Degree: Master of Engineering (M.Eng.)
Title of Project Paper/Research Report/Dissertation/Thesis (This Work):
CHARACTERISATION OF VISCOELASTIC RESPONSE OF SWOLLEN ELASTOMERS
Field of Study: Mechanics of Elastomers
I do solemnly and sincerely declare that: (1) I am the sole author/writer of this work; (2) This work is original;
(3) Any use of my work in which copyright exists was done by way of fair dealing and for permitted purposes and any excerpt or extract from, or reference to or reproduction of any copyright work has been disclosed expressly and sufficiently and the title of the work and its authorship have been acknowledged in this work;
(4) I do not have any actual knowledge nor do I ought reasonably to know that the making of this work constitutes an infringement of any copyright work;
(5) I hereby assign all and every rights in the copyright to this work to the University of Malaya (―UM‖), who henceforth shall be owner of the copyright in this work and that any reproduction or use in any form or by any means whatsoever is prohibited without the written consent of UM having been first had and obtained;
(6) I am fully aware that if in the course of making these works I have infringe any copyright whether intentionally or otherwise, I may be subject to legal action or any other action as may be determined by UM.
Candidate’s Signature Date
Subscribe and solemnly declare before,
Witness Signature Date
Name :
i
ABSTRACT
Given the wide energy insecurity crisis in the world, alternative fuels are fast becoming the most sought after means of providing energy. This is relevant to the fast growing population and fast depletion of conventional energy resources. However the practical application of these alternative fuels can only be possible if they are compatible with the materials, in particular elastomers, used in service conditions.
Keeping this in view, the present study focuses on the compatibility of elastomers and palm biodiesel. More precisely, the swelling characteristics of elastomers in palm biodiesel in the absence and in the presence of static mechanical loading are investigated. For this purpose, Nitrile Butadiene Rubber (NBR) with three different carbon black contents is considered: 0, 25 and 40 wt%. Moreover, the resulting mechanical responses of swollen NBR are probed through a set of mechanical testing. The emphasis is laid on the effect of swelling on the viscoelastic response of elastomers.
Results show that the swelling of NBR is reduced by the introduction of carbon black filler, i.e. carbon black provides resistance to deterioration due to exposure to aggressive liquid. Furthermore, independently of the carbon content, the presence of static tensile strain appears to increase the swelling for shorter durations of immersion. For longer immersion durations, the degree of swelling remains generally unaffected by the presence of uniaxial strain. Finally, mechanical testing results show that the viscoelastic response of elastomers unaffected by the swelling degree. However, by comparing the hysteresis curves for elastomers under different swelling levels, viscoelasticity appears to decrease with increase in swelling level.
ii
ABSTRAC
Memandangkan tenaga luas krisis tidak selamat dalam dunia ini, bahanapi alternatif yang Pantas menjadi yang paling dicari cara untuk menyediakan tenaga. Ini adalah berkaitan dengan penduduk berkembang pesat dan pengurangan cepat sumber tenaga konvensional. Walau bagaimanapun permohonan praktikal bahan api alternatif hanya boleh dilakukan jika mereka yang serasi dengan bahan-bahan, khususnya elastomer, yang digunakan dalam syarat-syarat perkhidmatan. Menjaga pandangan ini, kajian ini memberi tumpuan kepada keserasian elastomer dan biodiesel sawit. Lebih tepat lagi, ciri-ciri bengkak elastomer dalam biodiesel sawit dalam ketiadaan dan kehadiran loading mekanikal static disiasat. Bagi tujuan ini, nitril Butadiena getah (NBR) dengan tiga kandungan karbon hitam yang berbeza dianggap: 0, 25 dan 40% berat. Selainitu, yang mengakibatkan tindak balas mekanikal NBR bengkak akan menyiasat melalui satu set ujian mekanikal. Penekanan diletakkan pada kesan bengkak kepada sambutan viscoelastic yang elastomer. Keputusan menunjukkan bahawa bengkak NBR dikurangkan dengan pengenalan karbon pengisi hitam, iaitu karbon hitam memberikan tentangan kepada kemerosotan disebabkan oleh pendedahan kepada cecair yang agresif. Akhirnya, keputusan ujian mekanikal menunjukkan bahawa tindak balas viskoelastik daripada elastomer tidak terjejas oleh tahap bengkak. Walau bagaimanapun, dengan membandingkan keluk histerisis untuk elastomer bawah tahap bengkak yang berlainan, kelikatkenyalan muncul untuk mengurangkan dengan peningkatan dalam tahap bengkak.ketara ke atas sifat-sifat viscoelastic daripada elastomer. Beberapa cadangan untuk kerja-kerja masa depan dalam bidang ini telah dicadangkan pada akhirnya -sifat viscoelastic daripada elastomer. Beberapa cadangan untuk kerja-kerja masa depan dalam bidang ini telah dicadangkan pada akhirnya.
iii
ACKNOWLEDGEMENT
First and foremost I would like to be thankful to Allah, the Almighty for His mercy and kindness during this project and my life in general. Next I want to thank my supportive supervisor Dr. Andri Andriana for his guidance and encouragement, Shiau Ying for her invaluable help, and all the members of the laboratory who made this work easier. I would also like to extend my gratitude to my friends and family, particularly my sister who has been a spiritual support throughout all my endeavors.
iv
Table of Contents
ABSTRACT ... i
ABSTRAC ... ii
ACKNOWLEDGEMENT ... ii
LIST OF FIGURES………...vii
LIST OF TABLES……… xiii
NOMENCLATURE……….. xiv
CHAPTER1:INTRODUCTION ... 1
1.1. Research background: ... 1
1.2. Objectives of the study: ... 3
1.3. Scope of the study ... 3
1.4. Organization of thesis: ... 4
CHAPTER 2: LITERATURE REVIEW...5
2.1. Nitrile Rubber (NR):... 5
v
2.2. Biodiesel: An overview... 9
2.2.1. Biodiesel in Malaysia: ... 13
2.2.2. Interaction of bio-diesel with different materials: ... 14
2.2.3. Interaction of bio-diesel with elastomers... 15
CHAPTER 3: METHODOLOGY ... 20
3.1. Materials used ... 20
3.2. Specimen geometry... 21
3.3. Devices ... 21
3.4. Swelling measurement: ... 22
3.4.1. Free immersion: ... 22
3.4.2. Immersion of uniaxially strained samples: ... 22
3.5. Mechanical testing: ... 25
3.5.1. Different test profiles... 25
CHAPTER 4: RESULTS AND DISCUSSION... 28
vi
4.2. Immersion test of uniaxially strained sample... 30
4.3. Mechanical testing: ... 31
CHAPTER 5: CONCLUSIONS AND RECOMMENDATIONS
...58
5.1. Conclusions………...58
5.2. Recommendations... 59
REFERENCES...60
INTERNET REFERNCES...63
APPENDIX A………..64
vii
List of Figures
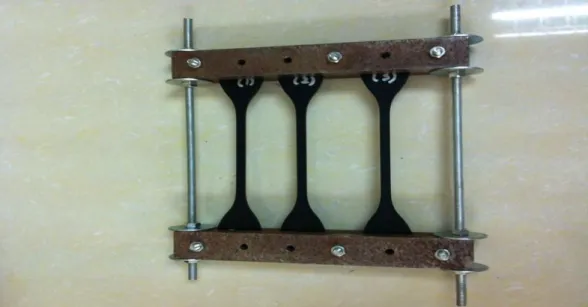
Figure 3.1 (a) Figure 3.1 Device used to induce strain in elastomers
prior to immersion ………. 21
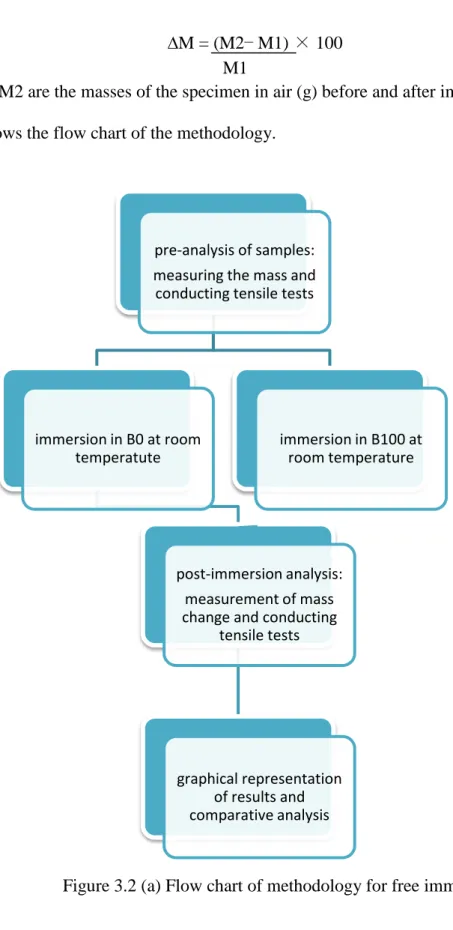
Figure 3.2 (a) Flow chart of methodology for free
immersion... .... 23
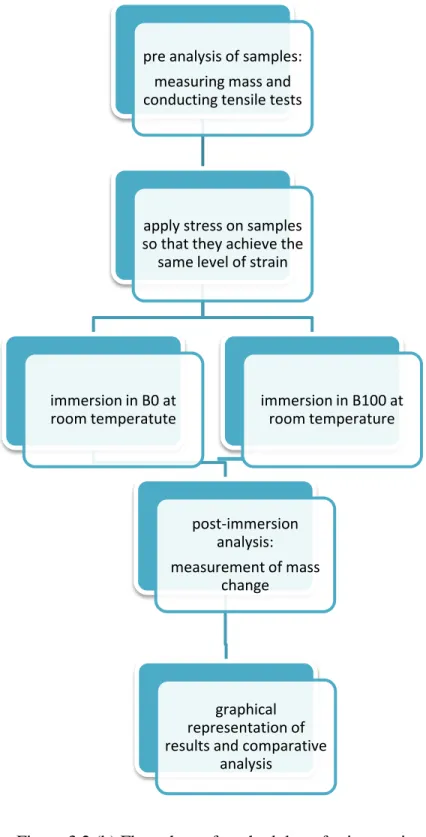
Figure 3.2 (b) Flow chart of methodology for immersion of
uniaxially strained samples... 24
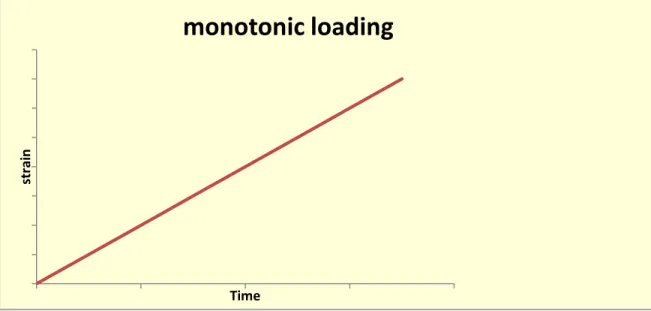
Figure 3.3 Loading sequence 1 ... 26
Figure 3.4 Loading sequence 2 ... 26
Figure 3.5 Loading sequence 3 ... 27
Figure 3.6 Loading sequence 4 ... 27
Figure 4. 1 Swelling rates of elastomers in B0 ... 28
Figure 4. 2 Swelling rates of elastomers in B100………29
Figure 4. 3 Swelling rates of elastomers under uniaxial static stress
in B100 ... ……….31
Figure 4.4 Mechanical response of NBR under loading sequence 1
……….32
Figure 4.5 Mechanical response of NBR under loading sequence 1
……….33
viii
Figure 4.6 Mechanical response of NBR under loading sequence 1
... 33
Figure 4.7 Mechanical response of NBR under loading sequence 1
……….34
Figure 4.8 Mechanical response of NBR under loading sequence 2
………...………..35
Figure 4.9 Mechanical response of NBR under loading sequence 2
... ………..35
Figure 4.10 Mechanical response of NBR under loading sequence 2
... ………..36
Figure 4.11 Mechanical response of NBR under loading sequence 2
... ………36
Figure 4.12 Mechanical response of NBR under loading sequence 2
... 37
Figure 4.13 Mechanical response of NBR under loading sequence 2
...37
Figure 4.14 Mechanical response of NBR under loading sequence 2
... 38
ix
Figure 4.15 Mechanical response of NBR under loading sequence 2
... 38
Figure 4.16 Mechanical response of NBR under loading sequence 2
... 39
Figure 4.17 Mechanical response of NBR under loading sequence 2
... 39
Figure 4.18 Mechanical response of NBR under loading sequence 2
... 40
Figure 4.19 Mechanical response of NBR under loading sequence 2
... 40
Figure 4.20. Viscoelastic response of NBR for different swelling
levels ... 43
Figure 4.21 Viscoelastic response of NBR for different swelling
levels ... 43
Figure 4.22 Viscoelastic response of NBR for different swelling
levels ... 44
Figure 4.23 Mechanical response of NBR under loading sequence 3
... 45
x
Figure 4.24 Mechanical response of NBR under loading sequence 3
... 45
Figure 4.25 Mechanical response of NBR under loading sequence 3
... 46
Figure 4.26 Mechanical response of NBR under loading sequence 3
... 46
Figure 4.27 Mechanical response of NBR under loading sequence 3
... 47
Figure 4.28 Mechanical response of NBR under loading sequence 3
... 47
Figure 4.29 Mechanical response of NBR under loading sequence 3
... 48
Figure 4.30 Mechanical response of NBR under loading sequence 3
... 48
Figure 4.31 Mechanical response of NBR under loading sequence 3
... 49
Figure 4.32 Mechanical response of NBR under loading sequence 3
... 49
xi
Figure 4.33 Mechanical response of NBR under loading sequence 3
... 50
Figure 4.34 Mechanical response of NBR under loading sequence 3
... 50
Figure 4.35 Mechanical response of NBR under loading sequence 4
... 52
Figure 4.36 Mechanical response of NBR under loading sequence 4
... 52
Figure 4.37 Mechanical response of NBR under loading sequence 4
... 53
Figure 4.38 Mechanical response of NBR under loading sequence 4
... 53
Figure 4.39 Mechanical response of NBR under loading sequence 4
... 54
Figure 4.40 Mechanical response of NBR under loading sequence 4
... 54
Figure 4.41 Mechanical response of NBR under loading sequence 4
... 55
xii
Figure 4.42 Mechanical response of NBR under loading sequence 4
... 55
Figure 4.43 Mechanical response of NBR under loading sequence 4
... 56
Figure 4.44 Mechanical response of NBR under loading sequence 4
... 56
Figure 4.45 Mechanical response of NBR under loading sequence 4
... 57
Figure 4.46 Mechanical response of NBR under loading sequence 4
... 57
xiii
List of Tables
xiv
NOMENCLATURES
ACN Acrylonitrile
B0 Designation for diesel
B100 Designation for biodiesel
CO Carbon monoxide
CO2 Carbon dioxide
CB Carbon Black
COF Coefficient of Friction
CR Chloroprene rubber
EG Expanded graphite
FAME Fatty acidmethyl esters
∆M Mass change (gms)
Mtoe Million tonnes of oil equivalent
NBR Nitrile butadiene rubber
NOx Nitrous oxide
phr Parts per hundred of rubber
PG Propyl gallate
PM Particulate matter
ppm Parts per million
PY Pyrogallol
SBR Styrene butadiene rubber
xv
Wt% weight percent
0CB NBR samples without any carbon black content
25 CB NBR samples with 25 wt% carbon black content
1
CHAPTER1:INTRODUCTION
1.1.Research background:
Fossil fuels such as oil and petroleum products form the major supplier of world’s total energy demand and there is a general consensus that the reserves on these fossil fuels are finite and depleting fast (Silitonga et al., 2011).
On the other hand the global energy consumption is only rising.The final energy consumption in Malaysia increased at an annual growth rate of 7.2% from 1990 to2008 and reached 44.9 million tonnes of oil equivalent (Mtoe) in 2008. One of the most vital challenges faced by power sector in Malaysia at present is the issue of sustainability(Ong 2011).
Also, the world total population growth is still increasing at an enormous rate of 1.1% per year giving rise to the energy crisis of present times and making it imperative to consider different sources of energy other than the conventional sources like petroleum, coal and their derivatives. Consequently these alternate fuels are being investigated with much fervour. Among these biodiesel is becoming popular as an alternative fuel in preference to other conventional fuels and consequently its effects as it comes in contact with materials used in industries are being investigated. Although on environmental safety front this fuel earns clear points over diesel being renewable and having less sulphur and nitrogen but a proper understanding of the compatibility of materials with this alternative means of energy is important to determine the technical feasibility of its use commercially (Tashtoush 2004).
2
Since the elastomers form one of the largest used material in fuel transport and other fuel system, this work will concentrate on that particular field of study. There have been some studies relevant to this work and include the ones conducted by Haseeb et al (2011), Chai et al (2013), Ch’ng et al (2013)and the references mentioned therein.
It is well known that elastomers do not possess adequate mechanical properties to be used in unfilled state as structural materials (Mostafa 2009). Also the wear resistance of pure rubber is poor and limits its use in industrial applications, making it prudent and necessary to incorporate the necessary reinforcements to improve these qualities(Wang 2012).
The majority of studies that have been conducted in this field have been focused on the swelling behaviour of elastomers in solvent (or biodiesel in this particular case). There have been many investigations of the swelling behaviour of these elastomers in the presence of mechanical loading. An attempt has been made in this study to achieve this objective. The comparative study of swelling characteristics of unfilled and reinforced elastomers (with varying amount of reinforcement) has been carried out in static uniaxial loading.
Although a variety of fillers are used to strengthen elastomers and impart other desirable properties, carbon black has been found to be the most commonly used filler. (Kraus 1978). Nevertheless, the addition of any filler material affects the properties of the elastomer to which it is added and this factor is taken into account in all practical applications of the material.
3
Therefore, the study has been carried out on carbon black-reinforced elastomers. The mechanical response of elastomers swollen to varying levels in both pure and reinforced states has been investigated. This effectively quantifies the change in mechanical characteristics of swollen elastomers by reinforcement and vice versa.
1.2.Objectives of the study:
The objectives of this study can be outlined as follows:
i. To investigate the effect of carbon black (CB) on swelling of elastomers (NBR) in solvent (palm biodiesel).
ii. To investigate the effect of static mechanical loading on swelling of CB filled elastomers in solvent
iii. To characterize the mechanical response of swollen elastomers (NBR) in particular viscoelastic response.
1.3.Scope of the study
NBR is the most extensively used material in the fabrication of hoses and gaskets in fuel transportation system (Linhares 2013). Therefore, this study has been concentrated on this particular material. The swelling characteristics of this elastomer with varying amounts of CB in stressed conditions have also been investigated. The specimens with three different amounts of carbon black were studied i.e.,0 wt %, 25 wt % and 40 wt%. Bio-diesel was used as the solvent since the compatibility study between biodiesel and elastomers is a relevant and active subject of research currently.
4
1.4.Organization of thesis:
The dissertation has been organized in 5 chapters. Chapter 1 starts with the introduction on the importance of developing an alternate fuel in view of the fast depleting conventional sources of fuel and the significance of investigating the compatibility of this fuel with the materials that it can come in contact with during practical use and service life. The scope and the objectives of the study are also listed in this chapter.
Chapter 2 includes the detailed literature review including the research that has been done previously related to this area of study. The main topics include the overview of NBR i.e. the material that we have used in the experiment, the biodiesel and its significance in Malaysia, the effect of biodiesel on different materials particularly elastomers as well as the effects of CB on the swelling characteristics as well as mechanical characteristics of elastomers.
Chapter 3 lists the methodology used for this study including the devices and the materials that were used. Chapter 4 includes the findings of the study. The results are interpreted with the help of graphs.
5
CHAPTER 2:LITERATURE REVIEW
2.1. Nitrile Rubber (NR):
Nitrile rubber (NR) is a highly elastic, random copolymer composed of acrylonitrile and butadiene which is produced with different ratios of either polymer. However, in commercially used products the Acrylonitrile (ACN) content varies from 18% to 50%. The ACN component is responsible for imparting the required hardness, tensile strength, and abrasion resistance, as well as fuel and oil resistance, increasing the ACN content also improves heat resistance and gas impermeability. A standard, general-purpose nitrile compound usually contains 34% ACN with a useful temperature range of - 40 to 225 degrees Fahrenheit (Internet reference [1], Internet reference [2]).
NBR is well-known for its exceptional resistance to mineral oils and solvents due to its resistance to swelling when immersed in these oils. However, its chemical resistance to oils is proportional to the ACN content making it necessary that the manufacturer’s designation should identify the percentage of ACN present. With higher ACN content, the solvent resistance of an NBR compound is increased but low-temperature flexibility is decreased (Internet reference [3]).
The use of NBR is limited to environs where resistance to mineral oils and aromatic hydrocarbons is paramount due to its poor resistance to strong oxidizing chemicals such as nitric acid. Nitrile compounds outperform most other elastomers due to superior mechanical properties as well as good aging properties under severe conditions.
6
The double bonds present in the polybutadiene parts of the chemical backbone, make the nitrile compounds susceptible to degradation by ozone, sunlight, and weathering.
The main commercial uses of NBR are as gasoline hoses, fuel pumps diaphragm, gaskets, seals and packing (e.g., o-rings) and finally as oil-resistant soles for safety work shoes(Callister 2001).
2.1.1. Effect of reinforcement by carbon black on rubber:
According to ASTM D3053-04 carbon-black can be defined as an engineered material, primarily composed of elemental carbon, obtained from the partial combustion or thermal decomposition of hydrocarbons. It is most widely used to alter the mechanical, electrical and optical properties of the medium in which it is dispersed (Roy 2012).
More than 90% of total carbon black consumption is accounted for by application as a reinforcing agent in the production of rubber goods. It has been reported that in 2010, use of CB as a filler in tires accounted for 73% of world consumption and 19% accounted for use as reinforcement in rubber goods while consumption for non-rubber goods accounted for only 8% of world consumption (Internet reference [4]).
Carbon black is used to improve the mechanical properties of NBR rubber compounds in contrast with the unfilled compounds. Reinforcement of rubber by rigid particulate materials such as carbon black has been found to substantially improve the mechanical properties of rubber. Thus, CB is added to rubber to impart characteristics that meet the parameters of the application or to enhance the properties to offer better performance. Rubber compounds used gasket, seal or cushioning pad are expected to perform over an extensive period of time as they present several phenomena like the ability
7
to retain elastic properties during prolonged action of compressive stresses. Any loss of resiliency effectively reduces the capability of the elastomer to be used in such service conditions and gives rise to a permanent set that may culminate in a leak or may compromise the ability to protect an accidentally dropped unit if the elastomer is being used as a shock isolation pad.
Thus, it is desirable from an application point of view that the material have a lower the percentage of compression set since it can resist permanent deformation under a given deflection and temperature to a better extent.
Since the uses of rubber in engineering industry mainly predominantly involve being used as materials for gasket, seal or lining of containers of oils and organic solvents, the main consideration is the corrosion characteristics of the elastomers. The corrosion of elastomers which is expressed as the swelling rate of rubber when exposed to a corrosive liquid keeping the conditions of temperature and time constant has been found to decrease with increasing CB loading for reinforced NBR compounds.
Furthermore, the compression set value increases with increasing CB loading for NBR filled compounds and as such NBR filled with 50 phr CB has been found to have the most optimum values of swelling percentage and compression set values for use as seal in motor oil medium (Mostafa 2009).
It is known that elastomers exhibit poor abrasion properties in unreinforced/ pure state and the abrasion properties can be improved by addition of suitable filler materials. The enhancement in abrasion resistance thus obtained varies directly with the type of addition of filler and is based on its adhesion characteristic with the rubber matrix. As
8
such, CB when used as filler in elastomers has been found to offer significant improvement in the abrasion resistance. Increase in CB loading increases the strength of the vulcanizates of NBR and decreases the elongation at break which can be attributed to the increase in cross-linking density thereby decreasing the mobility of the rubber. Also, the compression strength of CB filled NBR vulcanizates is higher than the unfilled vulcanizates and continues to increases with the increase in CB loading. This is also explained by the increase in cross-linking density which increases the rubber-filler interaction. Increase in CB content has a similar effect on hardness; the more the CB content, the higher is the hardness of the vulcanizate and this relationship follows a linear trend
As mentioned earlier the abrasion resistance of NBR tends to increase when CB content is increased upto 50 phr. However the rate of increase in abrasion resistance becomes very small thereafter. This may be ascribed to fact that the cross-linking density comes close to maximum limit at that filler content.
In comparison with SBR vulcanizates, the abrasion resistance of NBR vulcanizates has been found to be higher with the same CB loading. Also, NBR vulcanizates have relatively higher hardness values(Mostafa 2009)
It has been suggested that in NBR, the increase in the tensile strength of rubber by the CB reinforcement, subsequently also increase the wear resistance(Pal 2010).
However, it has been verified that when incorporated with graphite, the graphite lubricant film is more effective in reducing the COF and Ws than CB. Subsequently, it is acknowledged that the superior tribological properties in NBR/CB/EG composites can be
9
achieved only when the graphite nano-particles are well dispersed in the polymer matrix.(Wang 2012).
2.2. Biodiesel: An overview
Biodiesel is a clean burning mono-alkyl ester based oxygenated fuel made from processing oils derived from natural, renewable feedstock such as new/used vegetable oils, and animal fats through micro-emulsion, pyrolysis (thermal cracking) and transesterification. Among these steps, transesterification is the main and most important step for producing the cleaner and environmentally safe fuel from raw vegetable oil. The main characteristics of the resulting biodiesel are quite similar to conventional diesel and it can be blended with standard petroleum diesel in any proportion to create a stable biodiesel blend.
Due to the pressure of creating new alternate fuels, a lot of investigation has been carried out on biodiesel to verify its feasibility for practical use. The economic, environmental and practical issues have been considered. Although a lot of studies still need to be carried out, it can safely be said that the industry of creating biodiesel as an alternate fuel looks promising.
Although cost of biodiesel is still higher than petroleum-based diesel, there are a lot of ways in which this problem can be resolved. One of accepted ways is by minimizing the raw material cost. In this area the use of waste cooking oil instead of unused oil to produce biodiesel has been found to be an effective. This method has two-fold benefits of producing an environmentally benign fuel and solving the problem of waste oil disposal. The methods of production of biodiesel from used cooking oil do not differ much from the
10
conventional transesterification process. For a detailed description see the reference mentioned.
By collecting used frying oils and converting them to biodiesel fuel, the cost of biodiesel is significantly lowered and the negative impact of disposing used oil to environment reduced. It has been verified that the characteristic properties of biodiesel made from used cooking oil are same as that produced from unused oils and are in general similar to those of petroleum diesel fuel. Furthermore, the properties of biodiesel derived from used cooking oil, all met the various national biodiesel standards and hence, can be used in diesel engines without any engine modifications (Enweremadu and Mbarawa 2009).
Biodiesel is commonly blended with petroleum diesel, the concentration of the blend being indicated by the number following the letter B. therefore, B10 refers to a blend of 10% biodiesel and 90% petroleum diesel, B100 is pure biodiesel and B0 is pure petroleum diesel can also be described as D100(Linhares 2013).
As far as combustion characteristics are concerned, biodiesel and biodiesel blends have shorter ignition delay, higher ignition temperature and pressure as well as peak heat release as compared to diesel fuel. In addition, the engine power output and brake power efficiency is equivalent to diesel fuel. Biodiesel and diesel blends can also reduce smoke opacity, particulate matter (PM), unburnt hydrocarbons, carbon dioxide (CO2) and carbon monoxide (CO) emissions. Only nitrous monoxide emissions have slightly increased. However, the main drawback of biodiesel fuel remains its high viscosity and low volatility, which causes poor combustion in diesel engines including formation of deposits and injector cocking which can be attributed to relatively poorer atomization upon injection
11
into the combustion chamber. This may be reduced to a range of 4–5mm2/s closer to that of diesel by transesterification which can improve combustion.
Biodiesel has a flashpoint of 423K as compared to 337K for diesel. American standard ASTM D6751 identifies some parameters that should be met by the pure biodiesel (B100) before being used as a pure fuel or being blended with petroleum-based diesel fuel.
The quality of biodiesel fuel can be considerably influenced by numerous factors including the quality of feedstock, fatty acid composition of the vegetable oil, animal fats and waste oil, type of production and refining process employed and post-production factors(Ong 2011).
It has been found that the use of biodiesel will lead to the reduced engine power in practical use, the main reason for power loss being the reduced heating value of biodiesel as compared to conventional diesel fuel. Additive that are used to enhance ignition and combustion performances of biodiesel are also advantageous to power recovery of biodiesel engine.
Also, additives used to improve properties of biodiesel can improve combustion performance of biodiesel engine thereby improving engine power. Making use of a turbocharged engine or a low heat release engine may improve biodiesel engine economy. In case of no alterations of the engine the injection feature of biodiesel influences the engine power. However, the relationship between injection pressure and injection timing and engine power has not yet been comprehensively studied so as to obtain an optimal biodiesel blend for these practical purposes. Preliminary investigations suggest that due to its lower soot formation and inherent lubricity, use of biodiesel can improve the durability
12
of the engine as compared with diesel, though a more empirical relation needs to be developed for the wear and compatibility of the biodiesel with engines it needs to be used for.
It is widely accepted that the use of biodiesel ensures lower PM emissions. This is due presence of fewer aromatic and sulfur compounds and higher cetane number though the more important factor is the higher oxygen content which also account for lower hydrocarbon emissions and to some extent for the lower CO emissions although that can be attributed to the relatively lower carbon to hydrogen content in biodiesel.(Xue 2011).
The reduction in the concentration of emission of benzene of about 19.5% has been obtained on an average under the three conditions of engine torque used in the experiments. Being a carcinogen, this reduction is sufficiently significant. Biodiesel blends with small content of biodiesel by volume can replace diesel successfully as an environmental friendly fuel and simultaneously ease the pressure on already scarce resources without considerably sacrificing engine power(Ferreira 2008).
The biodiesel stability is influenced by large number of factors which can be categorized by oxidation, thermal and storage stability parameters. Oxidants are added to bio diesel to increase its stability. Natural antioxidants, being very sensitive to biodiesel production techniques and the distillation processes have varying impacts on the fuel stability. Among various synthetic antioxidants that have been studied so far, only three have been found to increase the fuel stability significantly, the most effective being Tert-Butyl Hydroquinone(TBHQ) followed by Pyrogallol (PY) and Propylgallate (PG). (Jain and Sharma 2010)
13
2.2.1. Biodiesel in Malaysia:
The Southeast Asian countries possess a vast prospect for biodiesel production because of a high yield factor of palm in its tropical climate, less requirement of fertile land, fertilizer and pesticides. Also as already has been mentioned, the engine emissions are considerably low in palm oil methyl ester (POME). Since keeping a steady supply of feedstock of biodiesel and edible oils to ensure food and energy security simultaneously is very challenging, non-edible oils have been considered for being used as the raw material for making biodiesel.
Among these, Jatropha curcas which are easily grown in non-cropped marginal lands and wastelands with tropical and sub-tropical climates, can be considered as a future second generation biodiesel of South East Asia. However, oxidation stability of palm is more than that of Jatropha and other biodiesel feedstock and this is the major reason of overwhelming demand of palm based biodiesel in international market. Malaysia is the largest producer of palm oil in the world followed by Indonesia and jointly they are responsible for85% of world’s palm oil production.
In Southeast Asia palm biodiesel production particularly is drastically rising due to its high potentiality and yield factor. Palm oil is derived from the flesh of the fruit of the oil palm tree Elais guineensis. Palm tree originated in West Africa and was initiated in Malaysia in 1870s as an ornamental plant. The first commercial plantation, however, did not start until 1960s. Because of the high production of palm oil, it is economically feasible to use palm oil as feedstock for biodiesel. However, its property of being edible puts a strain on the long term use of palm oil as an alternate fuel. To address this issue Malaysia’s
14
biodiesel production has taken some initiative to introduce Jatropha production in mass level (Jayed 2009).
Other feedstock like Callophyllum are also being considered but compared to Palm oil and Jatropha biodiesel industry, biodiesel from Calophyllum inophyllum is still at a very early stage in Malaysia (Ong 2011).
2.2.2. Interaction of bio-diesel with different materials:
As Biodiesel significantly differ from conventional diesel in its chemical composition, its interaction with material used in the automobile industry can be safely expected to be different from diesel. The importance of studying the properties of biodiesel and its compatibility with industrial materials cannot be over stressed(Linhares 2013).
Chemically, biodiesel is more hygroscopic as compared to diesel and has relatively higher electrical conductivity. It also shows increased polarity and solvency which can ruin the metal protecting paints/coatings causing the metal to come in contact with biodiesel for further reaction. This property can also cause degradation of elastomer materials. Also, presence of undesirable free water in biodiesel may promote microbial growth and corrode fuel system components.
Due to the presence of high levels of unsaturated fatty acid methyl esters (FAME), biodiesel is susceptible to oxidation as compared to petroleum diesel and auto-oxidation of biodiesel reconverts esters into different mono-carboxylic acids which can enhance corrosion and degradation of fuel properties. Another result of oxidation is the increase in acidity and peroxide value which causes the hardening of elastomeric components and corrosion of fuel system components.
15
A lot of studies have been carried out on the corrosive action of biodiesel on metals. It has been verified that the biodiesel from Jatropha curcas and Salvadora are comparatively more corrosive for both ferrous and non-ferrous metals. Also copper alloys have been found to be more susceptible to corrosion in biodiesel than ferrous alloys. To counter this, Kalam and Majsuki have verified that adding irganor NPA can reduce corrosion of metal in palm biodiesel. However studies on the inhibition of corrosion by biodiesel are few and less detailed (Fazal 2011).
2.2.3. Interaction of bio-diesel with elastomers
The interaction of biodiesel with elastomers is a complex one. The compatibility studies of several types of elastomers in diesel and palm biodiesel have also been conducted since the rubber components used in sealing application are exposed to organic solvent and oils which may lead to physical degradation of rubber. Elastomers are essentially complex mixture of polar and nonpolar substances including polymers, fillers, oil, plasticizer, stabilizers, curing agents, antioxidants, antizonants and processing aids. Swelling is the major form of degradation in rubber when exposed to liquid. It can be described in terms of mass or volume change undergone by the rubber compound when in contact with the particular solvent/oil for any specific duration of time.
During the swelling process, liquids infiltrate the polymer network and occupy positions among the polymer molecules. Gradually the macromolecules are forced apart and the swelling of materials occurs. This increases the chain separation decreasing the mechanical stiffness causing the reduction of secondary bonding. As the exposure time and temperature increase, the swelling percentage increases due to the ease of diffusion of oil into the rubber chains. It has been concluded that the presence of biodiesel and the increase
16
in its content appreciably reduce the mechanical strength of the rubber (Andriyana. A 2012).
Upon exposure of elastomers in biodiesel, the extent of fuel absorption as well as the extraction of soluble components such as plasticizers varies with the type of elastomer.
Ethylene propylene diene monomer (EPDM) and silicone rubber (SR) have been shown to be more resistant to swelling in biodiesel than in diesel. On the other hand, swelling rates for CR and NBR are higher in biodiesel as compared to that in diesel indicating a lower compatibility in biodiesel.
For NBR, the acrylonitrile content is inversely proportional to the amount of swelling as it is responsible for increased crosslinks in the polymer backbone. Understandably, elastomers degrade in biodiesel through reactions with the polymer backbone and crosslinking system or by reactions with the filler system. Different constituents of elastomers having different characteristics are affected by diesel and biodiesel differently based on their dissolution capabilities as well as their molecular polarities. Consequently, NBR being a highly polar elastomer material shows more swelling in biodiesel than in diesel fuel.
Practically, the exposure to different metals causes biodiesel to become oxidized thereby increasing its polarity which may cause further degradation of elastomers. Decrease of tensile strength and hardness for EPDM and CR are comparatively higher than that for SR, NBR higher degradation in CR and EPDM upon immersion in biodiesel (Haseeb 2011).
17
Trakarnpruk and Porntangjitlikit evaluated compatibility of several elastomers in B10 - a biodiesel blend containing 90% conventional diesel and found that the mechanical properties of NBR, NBR/PVC and acrylic rubber were affected more than those of co-polymer Fluorocarbon (FKM) and terco-polymer FKM.
In practical service conditions a large majority of rubber sealing components are subjected to fluctuating mechanical loading in addition to exposure to chemically hostile environments. To endure the conditions the rubber components need to be robust since the mechanical loading history, environment, rubber formulation and constitutive response are known to influence their durability.
In the particular case of NBR, significant inelastic responses have been recorded under cyclic loading conditions namely mechanical hysteresis and stress-softening. The hysteresis is related to the amount of energy loss during a cycle and in the case of dry rubber can be related to viscoelasticity, viscoplasticity or strain-induced crystallization. The stress softening is characterized by the decrease in stress in the uploading during the first cycles and is known as the Mullins effect for which there is no unanimous microscopic explanation.
When NBR is in a swollen state, a significant decrease in the above mentioned inelastic responses is observed. In other words, smaller hysteresis and stress-softening are observed. Moreover, the inelastic responses further decrease in the presence of biodiesel(Andriyana. A 2012; Chai. A.B 2013).
The swelling of elastomers increases with increase of exposure time to liquids/solvents in general. In particular case of NBR in biodiesel, the results agree with
18
the general idea. The penetration of palm biodiesel is relatively fast at the initial stage due to its great affinity for oil uptake. The rate of swelling appears to be high at short exposure time before decreasing at longer exposure time. Accelerated swelling is initiated with absorption of liquids when the liquids adsorb on the surface layer of the rubber until particular concentration. Subsequently, penetration of the liquid into the rubber becomes slow until the rubber specimen achieves an equilibrium swelling level. In general this level depends on the elastomer-solvent combination and on the presence of mechanical loading.
The rates of swelling for NBR and CR in biodiesel have been found to be relatively high at short immersion durations and lower at longer immersion duration. For given immersion duration, the swelling in CR is steadily higher than the one in NBR. Also the hysteresis ratio decreases with increase in swelling in both these elastomers. In the case of NBR, the hysteresis ratio decreases by 66%. The decrease of hysteresis can lead to decrease in fatigue life. This factor is important considering that during their service, the elastomeric components are often subjected to fluctuating mechanical loading which could lead to fatigue failure(Chai 2013).
In the case of uniaxially stressed rubber, it was found that the tensile stress increases the liquid uptake while the presence of compressive stress shows the opposite effect. According to Treloar this phenomenon is attributed to the hydrostatic part of the Cauchy stress in the materials. The swelling characteristics of elastomers can also be investigated for variable stress conditions like torsion or combination of tension and torsion. The levels of swelling experienced by both NBR and CR have been experimentally found by Ch’ng and co-workers to be significantly affected by the presence of mechanical loading i.e., the swelling level increases significantly when a tensile strain is
19
introduced Furthermore, the effect of tensile strain appears to be more significant than that of torsion. There is some contradiction in this effect as compared to the results found by Loke et al. and Treloar who experimentally verified that the torsion decreases swelling. This discrepancy has been attributed to different conditions under which the tests were conducted and the specimen geometry (Ch’ng 2013)
20
CHAPTER 3: METHODOLOGY
3.1. Materials used
Commercial grades of NBR with the amounts of CB as 0%, 25% and 40% were purchased from MAKA Engineering Sdn.Bhd., Malaysia. The hardness of these materials varies with the amount of CB present. The palm biodiesel used was provided by Am Biofuels Sdn. Bhd., Malaysia with diesel. The elastomers were immersed in two biodiesel blends: B0 (100% diesel) and B100 (100% palm biodiesel).
Table 1 shows the analysis report of the palm biodiesel investigated. Due to confidentiality issues the detailed composition of rubber was not given.
Table 3.1 Analysis of biodiesel
Testing Parameter Unit Analysis result
Specification EN 14214:2008
(E)
Water content ppm 275 max 500
Acid value mgKOH/g 0.27 max 0.50
Free Glycerol % 0.014 max 0.02
Total Glycerol % 0.23 max 0.25
Monoglyceride content % 0.75 max 0.80
Diglyceride content % 0.12 max 0.20
Triglyceride content % 0.05 max 0.20
Total contamination ppm 2.71 max 24
Color & appearance Light amber, clear,
21
3.2. Specimen geometry
To investigate the interaction between diffusion of biodiesel and CB reinforced elastomer specifically NBR under uniaxial cyclic loading conditions, dumbbell shaped rubber specimens (ASTM D412-C) with small thickness of 2mm were used to facilitate the diffusion of biodiesel so that the equilibrium swelling level could be achieved in a practical time limit in laboratory conditions. The length and width of the rubber specimen used in present study were 120 mm and 6 mm respectively.
3.3. Devices
The device used for obtaining the strain level of 2 % was developed in the laboratory itself. It consists of four metal plates, each set used to clamp an end of the specimen. The two clamped end are then stretched to attain a particular level of strain which is maintained by the metallic screwed cylinders inserted between the sets of metal plates as shown in figure 3.1.Needless to say no such device is used for the free immersion experiment.
22
3.4. Swelling measurement:
3.4.1. Free immersion:
Before the immersion, the weight of the rubber specimen is measured in air after which it is immersed in the container of particular biodiesel blend. After the specific time gap, the specimen is removed from the container and is cleaned with filter paper to remove the surface of oil film.
The weight of the specimen is measured again to check the swelling level by calculating the weight change. This process is repeated till the rate of swelling remains almost constant indicating the equilibrium swelling level.
3.4.2. Immersion of uniaxially strained samples:
After initial weight measurement, the rubber specimens with varying CB content are placed in sequence on the tensile stress device. Grease is applied on the surface of the specimens that are in contact with the metal plate to avoid bulging of the specimens. Bolts and nuts are used to tighten the tension device until the plates are uniformly in contact with the spacers thereby ensuring the specimens to be in a simple uniaxial tensile stress state. In the present study the specimen were stressed to 50% strain.
The same process of calculating the weight change after each immersion period as was carried out for free immersion tests is followed till equilibrium swelling level is reached.
23
The percentage of mass change for both immersions is calculated by the following formula
∆M = (M2− M1) × 100 M1
where M1andM2 are the masses of the specimen in air (g) before and after immersion. Figure 3.1 shows the flow chart of the methodology.
Figure 3.2 (a) Flow chart of methodology for free immersion
pre-analysis of samples: measuring the mass and conducting tensile tests
immersion in B0 at room temperatute
post-immersion analysis: measurement of mass change and conducting
tensile tests graphical representation of results and comparative analysis immersion in B100 at room temperature
24
Figure 3.2 (b) Flow chart of methodology for immersion of uniaxially strained samples
pre analysis of samples: measuring mass and conducting tensile tests
apply stress on samples so that they achieve the
same level of strain
immersion in B0 at room temperatute post-immersion analysis: measurement of mass change graphical representation of results and comparative
analysis
immersion in B100 at room temperature
25
3.5. Mechanical testing:
The mechanical response of the reinforced swollen elastomers was investigated under four different stress profiles as shown is figure 3.2 for the swelling rates of 2 % 5% and 9% and dry specimen for comparison purposes. The tests are carried out for specimen with 25% CB, 40% CB as well as pure NBR using Instron 5500 uniaxial test machine equipped with 10 kN load cell at room temperature. All the tests were done under the strain rate of 0.025 /s to avoid complications by any thermal effects.
3.5.1. Different test profiles
Loading sequence 1 (Monotonic): specimen undergoes tensile loading till fracture
Loading sequence 2 (Cyclic loading): cyclic loading with increase in strain at each cycle till fracture. The maximum number of cycles taken into account is ten.
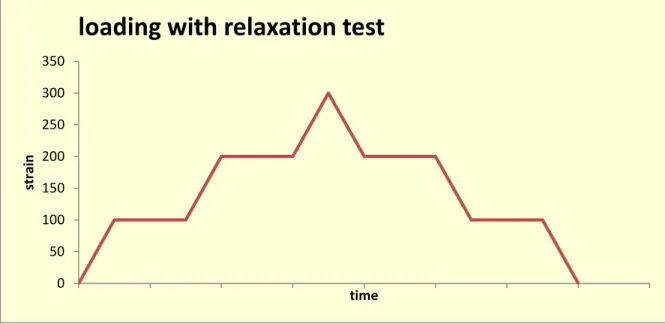
Loading sequence 3 (Relaxation test): applying load till a specific strain and then allowing the time for relaxation. This is held true for tensile as well as compressive loading. The specimen is treated to four cycles of tensile and compressive loading to remove Mullin’s effect prior to testing.
Loading sequence 4 (Different strain levels): subjecting the specimen to cyclic loading of the variable strain levels i.e. 100%, 200% and 300%. The specimen undergoes four cycles of each strain level
26
Figure 3.3Loading sequence 1
Figure 3.4 Loading sequence2
str ai n Time
monotonic loading
0 50 100 150 200 250 300 350 Str ess Time27
Figure 3.5 Loading sequence 3
Figure 3.6Loading sequence4 0 50 100 150 200 250 300 350 str ai n time
loading with relaxation test
0 200 400 600 800 1000 1200 str ai n Time
28
CHAPTER 4: RESULTS AND DISCUSSION
4.1. Free immersion tests:
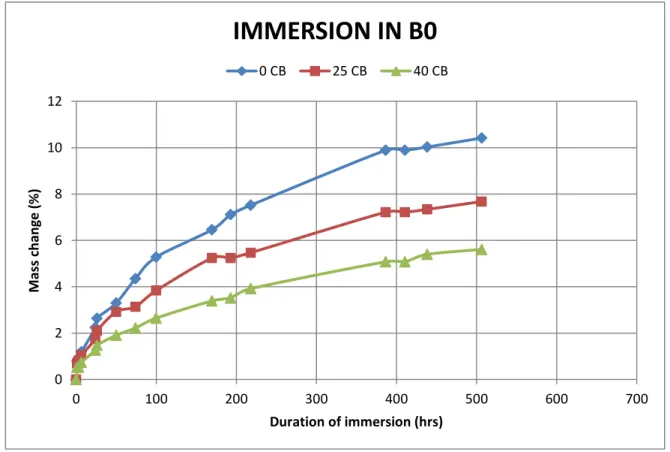
Comparative Swelling rates of the NBR samples with 0%, 25%and 40% CB show that the increased amount of filler corresponds to a lower swelling rate as shown in the graph (Figure 4.1). This can be attributed to the higher level of cross-linking in specimens with higher CB content which inhibits the absorption of solvent, CB being the cross-linking agent.
Figure 4.1 Swelling rates of elastomers in B0 0 2 4 6 8 10 12 0 100 200 300 400 500 600 700 M ass c h an ge ( % ) Duration of immersion (hrs)
IMMERSION IN B0
0 CB 25 CB 40 CB29
Figure 4.2 Swelling rates of elastomers in B100
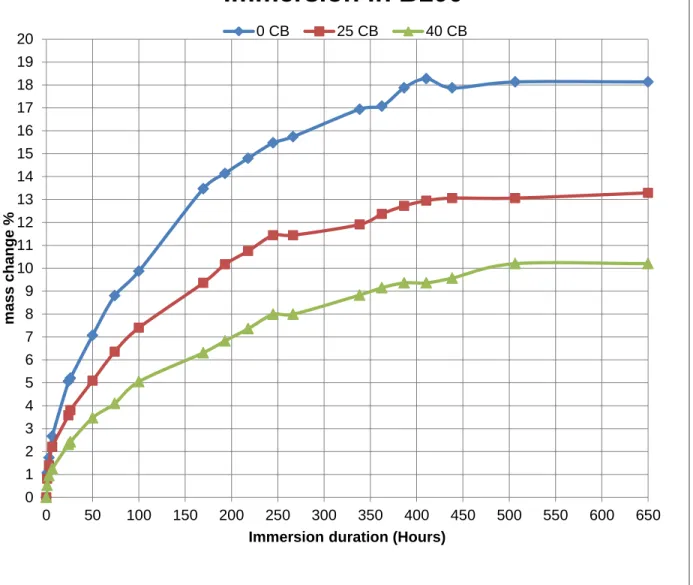
It can also be observed that the graphs follow same trend i.e. rapid increase at first which declines after some time and finally remaining almost static after reaching equilibrium level of swelling. This can be explained by the fact that initial rate of absorption is high due to the ease of penetration of the solvent. Another observation from the comparative analysis of the graphs for immersion of samples in B0 and B100 show that NBR samples have a better compatibility with conventional diesel as compared to
0 1 2 3 4 5 6 7 8 9 10 11 12 13 14 15 16 17 18 19 20 0 50 100 150 200 250 300 350 400 450 500 550 600 650 mas s c hange %
Immersion duration (Hours)
Immersion in B100
30
biodiesel as shown by the comparison of figures 4.1 and 4.2. This is evident by the fact that all samples show higher swelling levels in biodiesel as compared to conventional diesel. This is observed in 0 CB samples as well as samples with some amount of CB. Also the specimens attain equilibrium swelling level at lesser immersion duration. One more observation is that the specimens achieve equilibrium level of swelling in similar duration of time provided other physical factors remain constant.
4.2. Immersion test of uniaxially strained sample:
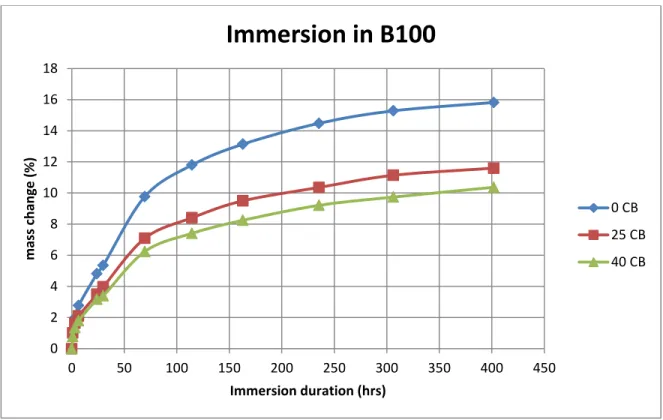
The NBR samples containing 0%, 25% and 40 % were uniaxially strained to 150% prior to immersion. The comparative swelling rates show that the swelling is maximum for unreinforced NBR. The swelling rate of samples with 25 % CB and with 40% CB were however comparable although that of 25 % is ultimately higher. Further the pre-strained samples show lower swelling rates than unstrained samples at a given duration. This change is relatively appreciable in samples containing 0 wt% CB as is evident by comparison of figures 4.1 and 4.3whereas there is no change in the value for 40 CB samples. The duration for attaining the equilibrium swelling level is comparatively less in case of specimens under static uniaxial stress.
31
Figure 4.3 Swelling rates of elastomers under uniaxial static stress in B100
4.3. Mechanical testing:
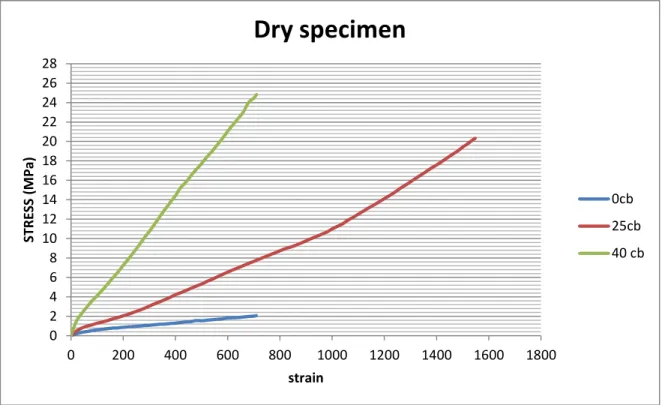
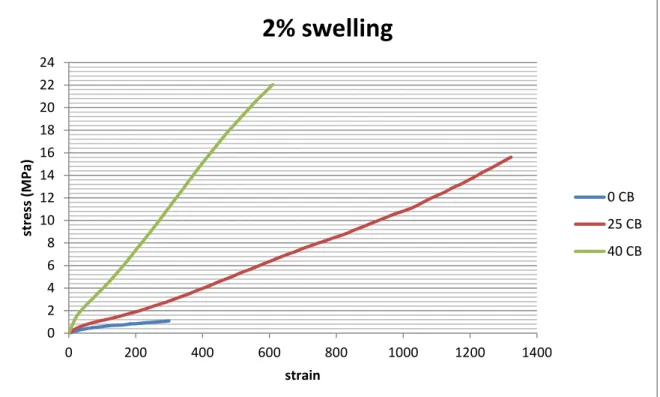
The response of the specimen under various stages of swelling under monotonic loading is shown in figures 4.4 to 4.7
As it is evident, the unreinforced NBR samples have poor mechanical response as compared to CB filled specimen in general. However, it can be noticed that even if the 40 CB specimen show more extension before fracture, the 25 CB specimens can withstand higher strain. This remains true for all swelling levels. It is also evident that higher swelling levels in specimen are responsible for deterioration of mechanical properties. The level of degradation is however lowest for 40 CB specimen. Clearly the more amount of CB preserves the mechanical properties of the elastomer in swollen state too to a large extent. 0 2 4 6 8 10 12 14 16 18 0 50 100 150 200 250 300 350 400 450 m ass c h an ge ( % ) Immersion duration (hrs)
Immersion in B100
0 CB 25 CB 40 CB32
It can be concluded that although the tensile strength increases with the increase in the amount of CB in the elastomer, the elongation at break decreases which is in agreement with the previous findings.
Figure 4.4 Mechanical response of NBR under loading sequence 1 0 2 4 6 8 10 12 14 16 18 20 22 24 26 28 0 200 400 600 800 1000 1200 1400 1600 1800 STRE SS (M Pa) strain
Dry specimen
0cb 25cb 40 cb33
Figure 4.5Mechanical response of NBR under loading sequence 1
Figure 4.6Mechanical response of NBR under loading sequence 1 0 2 4 6 8 10 12 14 16 18 20 22 24 0 200 400 600 800 1000 1200 1400 str e ss (M Pa) strain
2% swelling
0 CB 25 CB 40 CB 0 2 4 6 8 10 12 14 16 18 20 22 24 0 200 400 600 800 1000 1200 1400 str e ss (M Pa) strain5% Swelling
0 CB 25CB 40 CB34
Figure 4.7Mechanical response of NBR under loading sequence 1
As the specimen were subjected to Test profile 2, it was observed that the Mullins effect is more pronounced in 25 CB and 40 CB samples as compared to the 0 CB samples. The phenomenon referred to as the Mullins effect was first observed by Bouasse and Carrière and intensively studied by Mullins. It refers to the stress-softening corresponding to a significant decrease in stress between two successive cycles, particularly between the first and second loadings. As observed in the specimen, the difference in the stress softening for the CB filled specimen remains consistent with all swelling levels. The stress softening phenomenon is more enhanced as the amount of CB is increased. However, this property remains unchanged irrespective of the amount of deterioration for the swelling levels that have been considered in the experiment. There is almost no change in the loading and unloading paths of the specimen for different swelling levels. For the purpose of clarity,
0 2 4 6 8 10 12 14 16 18 20 0 200 400 600 800 1000 1200 str e ss (M Pa) strain
9% Swelling
0 CB 25 CB 40 CB35
the graphs 4.5 to 4.16 depicting show only the first two cycles of each strain level have been plotted. For the actual graph refer to the Appendix 1.
Figure 4.8Mechanical response of NBR under loading sequence 2 -0.2 0 0.2 0.4 0.6 0.8 1 1.2 -50 0 50 100 150 200 250 300 350 str e ss (M Pa) strain
Dry specimen (0 CB)
36
Figure 4.9Mechanical response of NBR under loading sequence 2
Figure 4.10Mechanical response of NBR under loading sequence 2 -0.5 0 0.5 1 1.5 2 2.5 3 3.5 -50 0 50 100 150 200 250 300 350 STRE SS (M Pa) strain
Dry specimen (25 CB)
-2 0 2 4 6 8 10 12 0 50 100 150 200 250 300 350 STRE SS (M Pa) strain37
Figure 4.11Mechanical response of NBR under loading sequence 2
Figure 4.12 Mechanical response of NBR under loading sequence 2 -0.2 0 0.2 0.4 0.6 0.8 1 1.2 -50 0 50 100 150 200 250 300 350 STRE SS (M Pa) strain
2% swelling (0 CB)
-0.5 0 0.5 1 1.5 2 2.5 3 3.5 0 50 100 150 200 250 300 350 STRE SS (M Pa) strain2% swelling (25 CB)
38
Figure 4.13 Mechanical response of NBR under loading sequence 2
Figure 4.14Mechanical response of NBR under loading sequence 2 -2 0 2 4 6 8 10 12 0 50 100 150 200 250 300 350 STRE SS (M Pa) strain
2% swelling (40 CB)
-0.2 0 0.2 0.4 0.6 0.8 1 1.2 0 50 100 150 200 250 300 350 STRE SS (M Pa) strain5% swelling (0 CB)
39
Figure 4.15Mechanical response of NBR under loading sequence 2
Figure 4.16Mechanical response of NBR under loading sequence 2 0 0.5 1 1.5 2 2.5 3 3.5 0 50 100 150 200 250 300 350 STRE SS (M Pa) strain
5% swelling (25 CB)
-1 0 1 2 3 4 5 6 7 8 9 0 50 100 150 200 250 300 350 STRE SS (M Pa) strain5% swelling (40 CB)
40
Figure 4.17Mechanical response of NBR under loading sequence 2 0 0.2 0.4 0.6 0.8 1 1.2 0 50 100 150 200 250 300 350 STRE SS (M Pa) strain
9% swelling (0 CB)
41
Figure 4.18Mechanical response of NBR under loading sequence 2
Figure 4.19Mechanical response of NBR under loading sequence 2 -0.5 0 0.5 1 1.5 2 2.5 3 3.5 -50 0 50 100 150 200 250 300 350 STRE SS (M Pa) strain
9% swelling (25 CB)
-2 0 2 4 6 8 10 0 50 100 150 200 250 300 350 STRE SS (M Pa) strain9% swelling (40 CB)
42
The specimen were subjected to cyclic loading under loading sequence 3 as explained in the previous chapter, to observe the viscoelastic response. The nature of the graphs was preserved under higher swelling rates although the curves became narrower as is evident in the graphs 4.23 to 4.34. It must be noted that the samples were subjected to cyclic loading to remove Mullins effect. Since the purpose was to study the viscoelastic response of the elastomers, the initial cyclic loading has been excluded from the graphs. By considering the constant strain of 100 for each stress-strain curve, it was observed from the data that the swollen elastomers show decreased viscoelastic response initially as shown in figures 4.20 to 4.23. Although a large amount of scatter is observed in the data collected for the experiments on 0 CB and 25 CB, it is observed that the viscoelastic response remains largely unaffected by the swelling level which is not observed in the 40 CB specimens. In this particular case, the viscoelastic response of the elastomer is decreased with the increase in swelling level. Since the viscoelastic properties of NBR are largely a property of the carbon black content present in them (as is evident in the graphs), this result is consistent. In the same line of observation, it may be noted that the effect on the 25 CB specimens with regards to the viscoelasticity is negligible in these experiments but may become significant in the larger swelling levels. In case of 40 CB specimens the effect on swelling on viscoelastic response is observable in the swelling levels achieved in the present experiments.
43
Figure 4.20. Viscoelastic response of NBR for different swelling levels
Figure 4.21 Viscoelastic response of NBR for different swelling levels 0.6 0.7 0.8 0.9 1 1.1 0 5 10 15 20 25 30 35 STRE SS time (minutes)
Comparison of viscolelasticity (0 CB)
dry 2% 5% 9% 0.6 0.7 0.8 0.9 1 1.1 0 5 10 15 20 25 30 35 STRE SS time (minutes)Comparison of viscolelasticity (25 CB)
DRY 2% 5% 9%44
Figure 4.22 Viscoelastic response of NBR for different swelling levels 0.6 0.7 0.8 0.9 1 1.1 0 5 10 15 20 25 30 35 STRE SS time (minutes)
Comparison of viscolelasticity (40 CB)
DRY 2% 5% 9%45
Figure 4.23Mechanical response of NBR under loading sequence 3
Figure 4.24 Mechanical response of NBR under loading sequence 3 0 0.2 0.4 0.6 0.8 1 1.2 0 50 100 150 200 250 300 350 STRE SS (M P a) STRAIN
Dry specimen (0 CB)
0 0.5 1 1.5 2 2.5 3 0 50 100 150 200 250 300 350 STRE SS (M Pa) strainDry specimen (25 CB)
46
Figure 4.25 Mechanical response of NBR under loading sequence 3
Figure 4.26 Mechanical response of NBR under loading sequence 3 -1 0 1 2 3 4 5 6 7 8 9 10 0 50 100 150 200 250 300 350 STRE SS (M Pa) strain
Dry specimen (40 CB)
0 0.2 0.4 0.6 0.8 1 1.2 0 50 100 150 200 250 300 350 STRE SS (M Pa) strain2% swelling (0 CB)
47
Figure 4.27Mechanical response of NBR under loading sequence 3
Figure 4.28 Mechanical response of NBR under loading sequence 3 0 0.5 1 1.5 2 2.5 3 0 50 100 150 200 250 300 350 STRE SS (M Pa) strain
2% swelling (25 CB)
0 1 2 3 4 5 6 7 8 9 10 0 50 100 150 200 250 300 350 STRE SS (M Pa) strain2% swelling (40 CB)
48
Figure 4.29Mechanical response of NBR under loading sequence 3
Figure 4.30 Mechanical response of NBR under loading sequence 3 0 0.2 0.4 0.6 0.8 1 1.2 0 50 100 150 200 250 300 350 STRE SS M Pa strain
5% swelling (0 CB)
0 0.5 1 1.5 2 2.5 3 0 50 100 150 200 250 300 350 STRE SS (M Pa) strain5% swelling (25 CB)
49
Figure 4.31 Mechanical response of NBR under loading sequence 3
Figure 4.32 Mechanical response of NBR under loading sequence 3 0 1 2 3 4 5 6 7 8 9 10 0 50 100 150 200 250 300 350 STRE SS (M Pa) strain
5% swelling (40 CB)
0 0.1 0.2 0.3 0.4 0.5 0.6 0.7 0.8 0.9 1 0 50 100 150 200 250 300 350 STRE SS (M Pa) strain9% swelling (0 CB)
50
Figure 4.33 Mechanical response of NBR under loading sequence 3
Figure 4.34 Mechanical response of NBR under loading sequence 3 0 0.5 1 1.5 2 2.5 3 0 50 100 150 200 250 300 350 STRE SS (M Pa) strain
9% swelling (25 CB)
0 1 2 3 4 5 6 7 8 9 10 0 50 100 150 200 250 300 350 STRE SS (M Pa) strain9% swelling (40 CB)
51
In case of mechanical response under cyclic loading, the 25 CB specimen show better mechanical characteristics than 0 CB or 40 CB specimens as shown in figures 4.29 to 4.40. The specimens were subjected to an increasing level of cyclic strain, the maximum strain being 1000. The 25 CB specimen showed better resistance to fracture under these loading conditions in all levels of swelling. The specimen remained unfractured for 2% and 5 % of swelling levels undergoing 10 cycles of increasing strain. The fracture for 9% swelling level occurred at the 10th cycle.
52
Figure 4.35 Mechanical response of NBR under loading sequence 4
Figure 4.36Mechanical response of NBR under loading sequence 4 -0.5 0 0.5 1 1.5 2 -100 0 100 200 300 400 500 600 700 STRE SS (M Pa) strain
Dry specimen (0 CB)
-2 0 2 4 6 8 10 12 -200 0 200 400 600 800 1000 1200 STRE SS (M Pa) strainDry specimen (25 CB)
53
Figure 4.37Mechanical response of NBR under loading sequence 4
Figure 4.38Mechanical response of NBR under loading sequence 4 0 5 10 15 20 25 -100 0 100 200 300 400 500 600 700 STRE SS (M Pa) strain
Dry specimen (40 CB)
-0.2 0 0.2 0.4 0.6 0.8 1 1.2 1.4 1.6 1.8 2 0 100 200 300 400 500 600 STRE SS (M P a) strain2% swelling (0 CB)
54
Figure 4.39 Mechanical response of NBR under loading sequence 4
Figure 4.40Mechanical response of NBR under loading sequence 4 0 2 4 6 8 10 12 0 200 400 600 800 1000 1200 STRE SS (M Pa) strain
2% swelling (25 CB)
-5 0 5 10 15 20 25 -100 0 100 200 300 400 500 600 700 STRE SS (M Pa) strain2% swelling (40 CB)
55
Figure 4.41Mechanical response of NBR under loading sequence 4
Figure 4.42 Mechanical response of NBR under loading sequence 4 -0.2 0 0.2 0.4 0.6 0.8 1 1.2 1.4 1.6 -100 0 100 200 300 400 500 600 STRE SS (M Pa) strain