University of South Florida University of South Florida
Scholar Commons
Scholar Commons
Graduate Theses and Dissertations Graduate School
June 2019
Morphology and Detection of Corrosion on Stainless Steel
Morphology and Detection of Corrosion on Stainless Steel
Reinforcement in Concrete
Reinforcement in Concrete
Julio J. Saire YanezUniversity of South Florida, jusaya.ic@gmail.com
Follow this and additional works at: https://scholarcommons.usf.edu/etd
Part of the Civil Engineering Commons
Scholar Commons Citation Scholar Commons Citation
Saire Yanez, Julio J., "Morphology and Detection of Corrosion on Stainless Steel Reinforcement in Concrete" (2019). Graduate Theses and Dissertations.
https://scholarcommons.usf.edu/etd/7922
This Thesis is brought to you for free and open access by the Graduate School at Scholar Commons. It has been accepted for inclusion in Graduate Theses and Dissertations by an authorized administrator of Scholar Commons. For more information, please contact scholarcommons@usf.edu.
Morphology and Detection of Corrosion on Stainless Steel Reinforcement in Concrete
by
Julio J Saire Yanez
A thesis submitted in partial fulfillment of the requirements for the degree of Master of Science in Civil Engineering
with a concentration in Structures
Department of Civil and Environmental Engineering College of Engineering
University of South Florida
Co-Major Professor: Alberto A. Sagüés, Ph.D. Co-Major Professor: Christopher L. Alexander, Ph.D.
Rajan Sen, Ph.D.
Date of Approval: June 21, 2019
Keywords: Corrosion Resistant Alloys, Reinforced Concrete, Electrochemistry, Propagation Stage, Durability
DEDICATION
Dedicated to my parents Aurora Yanez and Julian Saire, family, Peruvian nation, Quechua Culture, the Inca Empire legacy, and friends with gratitude for inspiring the idea of exploring the world, and breaking barriers.
ACKNOWLEDGEMENTS
The author is indebted to the co-major professors: distinguished professor Alberto Sagüés Ph.D. and Christopher Alexander Ph.D. for their continual guidance and encouragement. I would also like to express my gratitude to professor Rajan Sen, Ph.D. for his invaluable advice, and time.
In addition, I would like to thank my parents Aurora and Julian whom encouraged me to follow my dreams.
The author thanks the Peruvian Government for sponsoring students to study abroad and expand their knowledge.
The literature review as well its findings were a collaborative work Drs. Sagües and Alexander Ph.D. as a part of a research project supported by the Florida Department of Transportation.
The opinions, findings, and conclusions expressed in this document are those of the author and not necessarily those of any supporting organization.
TABLE OF CONTENTS
TABLE OF CONTENTS
List of Tables……. ... v
List of Figures…… ...vii
Abstract………….. ... x
Chapter 1: Introduction ...1
1.1. Overview ...1
1.2. Objective Statement ...4
1.3. Approach ...4
1.4. Corrosion Process in Reinforced Concrete Structures ...5
1.4.1. Electrochemical Reactions ...6
1.4.1.1. Anodic Reaction ...6
1.4.1.2. Cathodic Reaction ...7
1.4.2. Corrosion Morphology of Concrete Reinforcement ...7
1.4.2.1. Uniform Corrosion...7
1.4.2.2. Localized Corrosion ...7
1.4.3. Penetration Rate ...8
1.5. Steel Reinforcement in Concrete ...9
1.5.1. Stainless Steel ...9
1.5.1.1. Chemistry of the Corrosion Resistant Alloys ... 10
1.5.1.2. Estimation of the Corrosion Resistance of SS ... 10
1.5.1.3. Martensitic Stainless Steel ... 11
1.5.2. Carbon Steel ... 11
1.6. Service Life of a Concrete Structure ... 12
1.6.1. Corrosion Initiation Stage (CIS) ... 13
1.6.1.1. Concrete Cover Thickness (X) ... 13
1.6.1.2. Diffusion Coefficient (D) ... 13
1.6.1.3. Chloride Threshold (CT) ... 14
1.6.1.4. Surface Concentration Chloride (Cs) ... 14
1.6.2. Corrosion Propagation Stage (CPS) ... 14
1.6.2.1. Critical Concrete Cover (Xcrit) ... 14
1.6.2.2. Duration of Corrosion Propagation Stage (TP) ... 15
1.7. Electrochemical Corrosion Techniques ... 15
1.7.1. Half-cell Potential Method ... 16
1.7.1.1. Potential Maps... 16
1.7.2. Electrochemical Impedance Spectroscopy (EIS) ... 17
1.7.2.1. Equivalent Electric Circuit for Steel Reinforcements in Concrete... 18
1.7.3. Resistivity of Concrete ... 20
Chapter 2: Review of Propagation Stage Literature for SS ... 22
2.1. SS Reinforcement in Actual Structural Service ... 23
2.1.1. Progreso Pier, Mexico... 25
2.1.1.1. Background ... 25
2.1.1.2. Investigations of Corrosion Performance at the Progreso Pier ... 27
2.1.1.3. Summary ... 32
2.1.2. Bridge S03 of WB I-696 over Lenox Road, Michigan ... 35
2.1.2.1. Summary ... 35
2.1.3. I-295 over Arena Drive Bridge (Southbound), Trenton, New Jersey ... 36
2.1.3.1. Summary ... 36
2.1.4. Mullet Creek Bridge, Ontario Canada ... 36
2.1.4.1. Summary ... 37
2.1.5. Millennium Bridge, South Africa ... 37
2.1.5.1. Summary ... 38
2.1.6. Bridge A6059 in Grundy County, Missouri ... 38
2.1.6.1. Summary ... 39
2.1.7. Doniphan County and Mission Creek Bridge, Kansas ... 39
2.1.7.1. Summary ... 40
2.1.8. Ceiling and Air Channels Collapsed in Swimming Pool ... 40
2.1.8.1. Uster, Switzerland 1985 ... 40
2.1.8.2. Steenwijk, The Netherlands, 2001... 41
2.1.8.3. Tilburg, The Netherlands 2011... 41
2.1.8.4. Summary ... 41
2.2. Exposure of SS-Reinforced Concrete Samples to External/Service Environments ... 41
2.2.1. British Building Research Establishment (BBRE) Investigations ... 41
2.2.1.1. Langstone Harbour, England ... 42
2.2.1.2. Beckton, East London ... 43
2.2.1.3. Beckton, East London (Continued) and Hurst Castle ... 45
2.2.2. Treat Island, ME, USA ... 46
2.2.3. Durban Bluff Coastal Site, South Africa ... 48
2.2.4. Highway A13 Tunnel – Switzerland... 49
2.2.5. Florida Ponded SS-Reinforced Concrete Exposed Outdoors ... 50
2.3. SS in Concrete or Simulated Pore Solutions in Controlled Laboratory Conditions ... 50
2.3.1. Pit Growth on SS Rebar in Simulated Pore Water and Propagation Stage Modeling... 50
2.3.2. Initiation/Propagation Stages of SS-reinforced Concrete ... 53
2.3.3. Completion of Propagation Stage in Florida Ponded SS-Reinforced Concrete ... 55
2.3.3.3. The Third Exposure Class ... 57
2.3.4. Performance of Austenitic and Duplex SS in Cracked Concrete ... 59
Chapter 3: Experimental Methodology... 61
3.1. Overview ... 61 3.2. Materials... 62 3.2.1. Reinforcing Steel ... 62 3.2.2. Concrete ... 63 3.3. Specimen Preparation ... 64 3.4. Measurements ... 69 3.4.1. Potential Maps ... 69
3.4.2. Electrochemical Impedance Spectroscopy (EIS) ... 70
3.4.3. Resistivity of Concrete ... 71
Chapter 4: Results ... 73
4.1. Overview ... 73
4.2. Potential Maps ... 73
4.3. Electrochemical Impedance Spectroscopy ... 82
4.4. Resistivity of Concrete ... 96
Chapter 5: Discussion ... 98
5.1. Overview ... 98
5.2. Discussion Based on Literature Review ... 98
5.2.1. Observations on Duration of the Corrosion Propagation Stage ... 98
5.2.1.1. SS Rebar in Bridges in Service ... 98
5.2.1.2. Environmental Exposure ... 101
5.2.1.3. SS Laboratory Investigations ... 103
5.2.2. Observations on Methods of Detection and Measurement of Corrosion of SS Reinforcement ... 105
5.3. Discussion Based on Experimental Results... 107
5.3.1. Discussion on Potential Maps Results... 107
5.3.2. Discussion on Electrochemical Impedance Spectroscopy Results ... 108
5.3.3. Discussion on Resistivity of Concrete Results ... 110
5.3.4. Recommendations for Future Work ... 111
Chapter 6: Conclusions ... 113
References…….. ... 115
Appendix A: Selected Research Publications on SS Rebar in Concrete - .Chronological Order ... 123
Appendix C: American European Steel Grade Designations ... 129 About the Author………...End Page
LIST OF TABLES
Table 1.1 Criteria to Evaluate the Corrosion Potential Results... 16
Table 1.2 Criteria to Evaluate Concrete Resistivity Results ... 21
Table 2.1 Accelerated Chloride Ingress Tests ... 56
Table 3.1 Investigated Steels... 62
Table 3.2 Chemical Composition of Stainless Steel (Weight Percent). ... 62
Table 3.3 Chemical Composition of Carbon Steel (Weight Percent)... 62
Table 3.4 Concrete Class IV - FDOT Design Requirements ... 63
Table 3.5 Chloride Free Concrete - Mix Proportions ... 63
Table 3.6 Chloride Contaminated Concrete - Mix Proportions ... 64
Table 4.1 Impedance Parameters: AISI1018 CS in Concrete for CSA ... 92
Table 4.2 Impedance Parameters: AISI1018 CS in Concrete for CSB ... 92
Table 4.3 Impedance Parameters: AISI1018 CS in Concrete for CSC ... 92
Table 4.4 Impedance Parameters: UNSS41000 SS in Concrete for SS01... 93
Table 4.5 Impedance Parameters: UNSS41000 SS in Concrete for SS02... 93
Table 4.6 Impedance Parameters for UNSS41000 SS in Concrete for SS03... 93
Table 4.7 Nominal Duration of CPS for AISI1018 CS in Concrete for CSA ... 94
Table 4.8 Nominal Duration of CPS for AISI1018 CS in Concrete for CSB ... 94
Table 4.9 Nominal Duration of CPS for AISI1018 CS in Concrete for CSC ... 94
Table 4.10 Nominal Duration of CPS for UNSS41000 SS in Concrete for SS01 ... 95
Table 4.11 Nominal Duration of CPS for UNSS41000 SS in Concrete for SS02 ... 95
Table 4.13 Summary Nominal CR/CPS for AISI1018 CS in Concrete ... 96 Table 4.14 Summary Nominal CR/CPS for UNSS41000 SS in Concrete ... 96 Table A.1 Selected Research Publications on SS Rebar in Concrete -
Chronological Order………..….123 Table B.1 Bridges & Related Structures Reinforced with SS ..………...…. 126
LIST OF FIGURES
Figure 1.1 Evans Diagrams for Uniform & Localized Corrosion of Reinforced
Concrete. ...8
Figure 1.2 Service Life Span for Reinforced Concrete. ... 12
Figure 1.3 Diagram of Half-Cell Potential Measurements ... 16
Figure 1.4 Potential Map for a Given Steel Reinforcement in Concrete ... 17
Figure 1.5 Diagram of EIS Measurements ... 18
Figure 1.6 Proposed Equivalent Circuit for Corrosion of CS in Concrete ... 18
Figure 1.7 Proposed Equivalent Circuit for Corrosion of SS in Concrete ... 19
Figure 1.8 Concrete Resistance Measurement Using Four Probe Wenner Array. ... 21
Figure 2.1 Cumulative Worldwide Tally of Bridges with SS Rebar ... 24
Figure 2.2 SS in Bridges by Country ... 25
Figure 2.3 Plan Layout of Progreso Pier ... 26
Figure 2.4 Pier Elevation and Section... 27
Figure 2.5 Notional Damage Function Displaying Percentage of Progreso Pier Arches Showing Distress... 33
Figure 3.1 SS & CS Reinforced Concrete Cross Sections. ... 64
Figure 3.2 Wood Mold Coated with a Mold Release Agent... 65
Figure 3.3 Longitudinal Profile for UNSS41000SS/ AISI1018CS Specimens in Concrete. ... 66
Figure 3.4 Chloride Free Concrete Batch Covered with a Plastic Film... 66
Figure 3.5 First Concrete Batch – Left End of All Specimens... 67
Figure 3.6 Three Chloride-Free Concrete Samples for Resistivity Measurements. ... 67
Figure 3.8 Electrical Connections at the Right End of All Specimens. ... 69
Figure 3.9 Half-Cell Potential Measurement on Specimen SS01. ... 70
Figure 3.10 EIS Measurement on Specimen CS01... 71
Figure 3.11 Resistance Measurements on Concrete Specimens. ... 72
Figure 4.1 Potential Map: UNSS41000 SS/ AISI1018 CS in Concrete at 68 Hrs ... 74
Figure 4.2 Potential Map: UNSS41000 SS/ AISI1018 CS in Concrete at 94 Hrs ... 75
Figure 4.3 Potential Map: UNSS41000 SS/ AISI1018 CS in Concrete at 119 Hrs ... 75
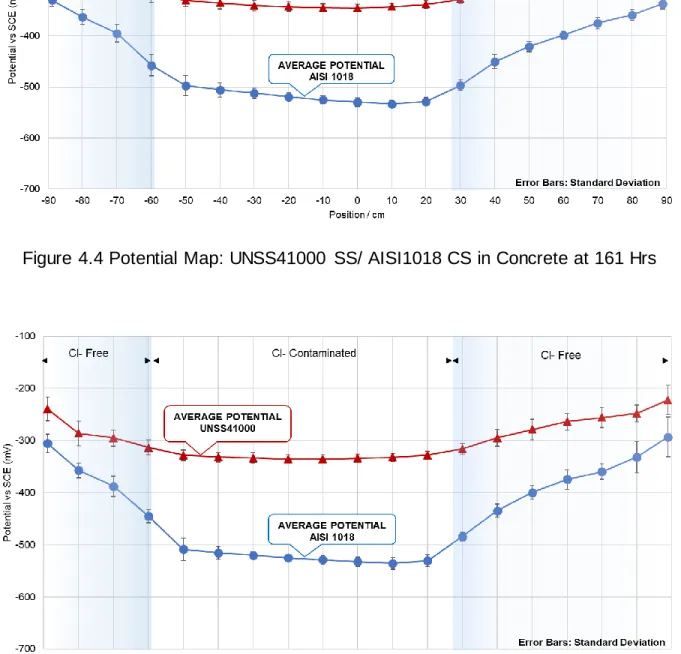
Figure 4.4 Potential Map: UNSS41000 SS/ AISI1018 CS in Concrete at 161 Hrs ... 76
Figure 4.5 Potential Map: UNSS41000 SS/ AISI1018 CS in Concrete at 236 Hrs ... 76
Figure 4.6 Potential Map: UNSS41000 SS/ AISI1018 CS in Concrete at 262 Hrs ... 77
Figure 4.7 Potential Map: UNSS41000 SS/ AISI1018 CS in Concrete at 307 Hrs ... 77
Figure 4.8 Potential Map: UNSS41000 SS/ AISI1018 CS in Concrete at 331 Hrs ... 78
Figure 4.9 Potential Map: UNSS41000 SS/ AISI1018 CS in Concrete at 401 Hrs ... 78
Figure 4.10 Potential Map: UNSS41000 SS/ AISI1018 CS in Concrete at 455 Hrs ... 79
Figure 4.11 Potential Map: UNSS41000 SS/ AISI1018 CS in Concrete at 479 Hrs ... 79
Figure 4.12 Potential Map: UNSS41000 SS/ AISI1018 CS in Concrete at 568 Hrs ... 80
Figure 4.13 Potential Map: UNSS41000 SS/ AISI1018 CS in Concrete at 598 Hrs ... 80
Figure 4.14 Potential Map: UNSS41000 SS/ AISI1018 CS in Concrete at 672 Hrs ... 81
Figure 4.15 Potential Map: UNSS41000 SS/ AISI1018 CS in Concrete at 768 Hrs ... 81
Figure 4.16 Fitting Results: UNSS41000 SS/ AISI1018 CS in Concrete. ... 83
Figure 4.17 Corrosion Rates: UNSS41000 SS/ AISI1018 CS in Concrete at ..768 Hrs ... 85
Figure 4.18 Nyquist Diagram: AISI1018 CS in Cl- Free Concrete for CSA... 85
Figure 4.19 Nyquist Diagram: AISI1018 CS in Cl- Contaminated Concrete for ..CSA ... 86
Figure 4.21 Nyquist Diagram: AISI1018 CS in Cl- Contaminated Concrete for
..CSB ... 87 Figure 4.22 Nyquist Diagram: AISI1018 CS in Cl- Free Concrete for CSC ... 87 Figure 4.23 Nyquist Diagram: AISI1018 CS in Cl- Contaminated Concrete for
..CSC ... 88 Figure 4.24 Nyquist Diagram: UNSS41000 SS in Cl- Free Concrete for SS01... 88 Figure 4.25 Nyquist Diagram: UNSS41000 SS in Cl- Contaminated Concrete for
..SS01... 89 Figure 4.26 Nyquist Diagram: UNSS41000 SS in Cl- Free Concrete for SS02... 89 Figure 4.27 Nyquist Diagram: UNSS41000 SS in Cl- Contaminated Concrete for
..SS02... 90 Figure 4.28 Nyquist Diagram: UNSS41000 SS in Cl- Free Concrete for SS03... 90 Figure 4.29 Nyquist Diagram: UNSS41000 SS in Cl- Contaminated Concrete for
..SS03... 91 Figure 4.30 Resistivity of Concrete at Age of 32 Days. ... 97 Figure 5.1 Effect of Counter Electrode Position on EIS Measurements. ... 108
ABSTRACT
Stainless steel (SS) has emerged as an alternative corrosion-resistant reinforcement in concrete instead of the commonly used carbon steel (CS). The biggest advantage of SS is that it takes more time for corrosion to initiate than for CS. An additional benefit from the use of SS in concrete may be derived from the period after the corrosion started until the concrete structure reaches a limit state. This period is called corrosion propagation stage (CPS) and it has been hardly studied in SS reinforced structures. The duration of this period could be related, among other factors, to the morphology of corrosion of stainless steel in concrete. In some instances, the corrosion detection methods for CS have been used on SS reinforced structures to estimate the corrosion condition. However, there is uncertainty if these methods can detect corrosion in SS reinforced structures properly. This investigation was organized in two parts: literature review and experimental work.
The literature review indicated among other findings that the duration of the CPS of SS’s embedded in concrete may be estimated to be in the order of several decades. High-grade SS’s would have a longer duration of the CPS. The review also indicated that even localized corrosion of SS reinforcement may induce concrete cracking. The literature also suggested that the corrosion detection on SS reinforced concrete may require a combination of conventional methods (half-cell potential) and advanced electrochemical techniques such as Electrochemical Impedance Spectroscopy, Electrochemical noise, etc.
The experimental work focused on further determining whether corrosion of SS in concrete can be detected by methods traditionally used for CS reinforcement, and to what extent localization of corrosion of SS compares with that of CS in concrete. The experiments consisted in accelerated corrosion testing of controlled anodic regions along concrete beams, for which tests were designed and initiated.
Martensitic UNS S41000 SS bars were partially embedded in chloride contaminated concrete (5.84% by weight of cement) to cause active corrosion. AISI 1018 CS was also used for comparison purposes. Traditional half-cell potential measurements on the reinforced concrete specimens were evaluated in comparison to that of advanced electrochemical impedance spectroscopy. Additional concrete resistivity monitoring gave an indication of the degree of the pore structure formation.
The traditional half-cell potential measurements on AISI 1018 CS reinforced concrete specimens appeared to be suitable to estimate the corrosion state of the reinforcement. However, there was uncertainty on the interpretation of the half-cell potential results and thus the corrosion state of UNS S41000 SS reinforced concrete specimens.
Low-dispersion corrosion rates values were found over large areas on SS and CS bars in concrete, but that SS embedded in concrete also seemed to develop instances of corrosion rate peaks. Among other findings, the duration of CPS of CS in concrete was estimated to be in the interval [6-59] years. Assuming that the CPS had been reached, SS specimens in concrete appeared to have a much longer duration of CPS than CS, with an interval [57-253] years. However, this assumption is likely not valid and more work is required to assess the CPS of SS reinforced concrete.
CHAPTER 1: INTRODUCTION 1.1. Overview
Stainless steel (SS) reinforced concrete has become an alternative corrosion-resistant solution instead of the traditional carbon steel (CS) in concrete. The corrosion process involves two stages: initiation and propagation. During the initiation stage, aggressive substances (e.g., chloride ions) penetrate the concrete cover from the outside and accumulate at the steel surface, eventually triggering the start of active steel corrosion. During the propagation stage, the corrosion of the concrete reinforcement creates expansive corrosion products that cause cracking of the concrete and associated structural deterioration. The service life span of the reinforced concrete can then be viewed as the sum of the durations of the initiation and the propagation stages.
Stainless steels in concrete have a much longer corrosion initiation stage (CIS) than carbon steel in concrete [1, 2]. However, there is uncertainty about the duration of the corrosion propagation stage (CPS) of SS. The duration of the CPS may depend on, but not limited to, corrosion that is uniform or localized [3]. Uniform corrosion of carbon steel often results in cracking of concrete due to accumulation of expansive corrosion products. However, if the corrosion of SS is localized, tensile failure of the reinforcement due to loss of cross sectional area could possibly occur before concrete cracking.
For several decades now, the corrosion of carbon steel reinforcement in concrete has been traditionally detected by using half-cell potential measurements standardized in the document ASTM C876 [4]. This method quantifies the electric potential shift between
the corroding spots on the steel surface and a given reference electrode [5]. The output data may give the localization of corrosion, an indication of the state of corrosion, but no indication of corrosion rate is given. A common application of the previous method is potential mapping, which uses several half-cell potential measurements over large concrete surfaces (e.g. concrete decks, columns) [6].
Half-cell potential method may be limited when the corrosion is localized because potential readings can be influenced by the concrete cover depth and resistivity of concrete [7]. The potential difference becomes smaller as the concrete cover increases. In low resistivity concrete, (e.g. wet concrete) the difference in potential developed by localized corrosion is pronounced and it is easy to detect. However, in high resistivity concrete (e.g. dry concrete), localized corrosion does polarize small surrounding areas and the difference in potential is difficult to detect. This technique has also been used on SS reinforced structures in some instances [7]. Nevertheless, the corrosion morphology may be localized on stainless steel [3], and the half-cell potential method might fail to detect highly negative corrosion potentials. Fortunately, specialized electrochemical impedance spectroscopy method may serve for verification of the information gained from half-cell potential measurements.
The corrosion rate can be estimated from electrochemical impedance spectroscopy (EIS) measurements [8]. This non-destructive method is convenient among others when complicating factors such as (non-uniform corrosion, presence of interfacial capacitance) are present [9]. In addition, EIS method can be performed in either galvanostatic or potentiostatic mode. EIS measurements in potentiostatic mode are more often performed on corrosion-resistant materials. These materials have a higher
impedance, and then the application of an electric excitation (usually 10 mV) results in a smaller response. Conversely, in a low- impedance material, the application of the electric excitation may change the corrosion state of the specimen [10]. As a result, such technology may merit exploration to achieve the objectives of this investigation.
Currently, Oregon DOT and Virginia DOT are incorporating SS in their concrete structures to reach longer durations of the corrosion initiation stage than that of carbon steel. However, a major concern of using SS is its susceptibility to localized corrosion, which may or may not induce concrete cracking [11]. The degree of corrosion is uncertain but estimated to be localized in SS compared to CS embedded in concrete, which may be uniform. Therefore, research is required to quantify the corrosion morphology of stainless steel in concrete.
Although other methods can be used to estimate corrosion rates, this study uses the EIS method in the potentiostatic mode for the reasons previously described. Additionally, chloride contaminated concrete was used to accelerate the reinforcement corrosion and to study the corrosion propagation stage on both types of steel. Finally, the structure of this investigation is divided into 6 chapters. Chapter 1 describes the concepts related to the investigation. Chapter 2 discusses the literature review outlining cases where SS was used as a concrete reinforcement in three exposure conditions: structural service, controlled external exposure, and laboratory conditions. Chapter 3 explains the experimental work carried out in the project. Chapter 4 lists the results of the investigation. Chapter 5 discusses the results outlined in the previous chapter and chapter 6 lists the conclusions of the investigation.
1.2. Objective Statement
The objectives of this investigation are: first, to find scholarly evidence on the duration of the corrosion propagation stage of stainless steel in concrete, associated corrosion morphology and, methods of detection. Second, to determine whether the corrosion of stainless steel in concrete can be detected by methods traditionally used for carbon steel reinforcement, and to what extent localization of corrosion of stainless steel compares to that of carbon steel in concrete.
1.3. Approach
To address the objectives, the following tasks were conducted:
1. A literature review was conducted to determine in which investigations of SS in concrete, the end of the corrosion initiation stage was reached, and if so, whether the end of the propagation stage had been reached as well. Three different test exposures were considered: actual structural service, test specimens under controlled external environments, and SS specimens in concrete or in simulated pore solutions under laboratory conditions. The literature review also examined the available evidence on how the onset of corrosion of SS can be detected by methods traditionally used for carbon steel rebar.
2. Experiments consisting of concrete beams were designed and initiated to address the second and third objective. Steel reinforced concrete specimens of dimensions (5 cm wide, 6.4 cm height and ~180 cm long) were prepared in the corrosion laboratory at the University of South Florida. Specimens were reinforced with ~6-feet long, 0.5” diameter, UNS S41000
SS and type AISI 1018 CS round bars. Each specimen was partially embedded in chloride free concrete (at the ends of the specimens) and chloride contaminated concrete (at the central area of the specimens) containing 1% (by weight of concrete) of admixed chloride. AISI 1018 CS was studied for comparison purposes. Additional concrete resistivity monitoring gave an indication of the degree of the pore structure formation. The chloride admixed concrete was used to facilitate the initiation of active corrosion of the reinforcement and thus to study the corrosion propagation stage.
3. Half-cell potential measurements, traditionally used for carbon steel reinforcement, were evaluated in comparison to that of electrochemical impedance spectroscopy to examine if corrosion of stainless steel can be detected by this method.
4. Corrosion rate measurements as well as half-cell potential measurements were performed on reinforced concrete specimens as a function of position to study the extent at which the localization of corrosion of stainless steel compares with that of carbon steel in concrete.
1.4. Corrosion Process in Reinforced Concrete Structures
Concrete deterioration can occur due to the surrounding environment (e.g. temperature changes), its constituent elements (e.g. aggregates or cement) and by the corrosion of reinforcing steel [12]. Carbon steel reinforcement in concrete (high alkalinity environment [13]) develops an oxide layer also known as a passive film in response to the corrosion process. The reinforcing steel corrodes when the passive film is destroyed
mainly by the chloride attack or concrete carbonation [14]. Chloride-related deterioration is commonly seen in the structures exposed to marine environment conditions.
The necessary components for corrosion of the steel reinforcement are: electrolyte (pore water in the paste), an electronic path (reinforcing steel), and two electrochemical reactions: anodic reaction sustained in the corroding areas and cathodic reaction located in the non-corroding areas [12]. These two electrochemical reactions will be explained in section 1.4.1.
1.4.1. Electrochemical Reactions 1.4.1.1. Anodic Reaction
The anodic reaction is the electrochemical process where a metal is oxidized in a given environment. In aqueous media, the reaction consists of the release of metal ions into the medium leaving behind electrons in the metal body. For iron, (the main component of carbon steel rebar) the anodic reaction is expressed as follows:
Fe Fe2++2e
-Equation 1: Anodic Reaction of Iron where e- represents an electron.
Once the metal ions (Fe++) leave the metal body, some of them react with oxygen
and water and then form corrosion products. The volume of the corrosion products can be ~ 7 times greater the volume of the reinforcing steel in the passive state [12]. Thus, inner expansion forces lead to the deterioration of concrete (e.g. cracking, spalls, or delamination).
1.4.1.2. Cathodic Reaction
The cathodic reaction is the electrochemical process where the electrons produced by the anodic reaction are consumed. In a concrete environment (pH~13), the most common cathodic reaction is oxygen reduction [12], which can be summarized as:
O2+2H2O+4e- 4OH
-Equation 2: Cathodic Reaction - Oxygen Reduction where e- represents an electron.
1.4.2. Corrosion Morphology of Concrete Reinforcement
The corrosion morphology of the reinforcing steels depends on where the electrochemical reactions (anodic and cathodic) are located on the metal body, and the conductivity of the medium [5]. The two morphologies that will be discussed throughout this investigation are uniform and localized.
1.4.2.1. Uniform Corrosion
Uniform corrosion, which occurs over an extensive area of the reinforcing steel [15], is typically found in carbon steel reinforced concrete structures. The most common way of reinforcing steel depassivation is through chloride attack [14]. A marine environment, due to their diluted salts, represents an ideal source of chloride ions to cause corrosion of reinforcing steel (see Figure 1.1). For example, concrete damage related to the uniform corrosion can be expressed as cracks, delamination, and spalls on the concrete surface.
1.4.2.2. Localized Corrosion
This type of corrosion is shown as small and isolated pits on the steel reinforcement. It is also classified as insidious corrosion [15] because it could generate
sudden failures in a system. The detection of this type of corrosion by applying the half-cell potential measurement is influenced by the concrete cover and concrete resistivity [5]. The literature indicates that the potential difference at the anodic areas can be reduced as the concrete cover increases. Likewise, it has been found that steel areas with localized corrosion can be easily detected in low-resistivity concrete. This is possible due to the anodic areas polarize the nearby surrounding cathodic areas, thus the sudden potential drop can be easy to detect by this measurement (see Figure 1.1).
Figure 1.1 Evans Diagrams for Uniform & Localized Corrosion of Reinforced Concrete. Source: Adapted from [5]. Where Ecorr is Corrosion Potential. E/A, E/C are Electric Potentials Developed by Anodic Reaction and Cathodic Reaction Respectively. i/A, i/C
are Currents Developed by Anodic Reaction and Cathodic Reaction Respectively. 1.4.3. Penetration Rate
The penetration rate is one of the widely used corrosion expressions to represent the loss of thickness due to the corrosion of reinforcement in concrete. This research will use micrometers per year (μmy) as corrosion unit. To calculate this value, the Faradaic formula was derived and it is given as follows:
W = ( Icorr
A ∗ t ∗ M) n ∗ F
CR =W ∗ 10
4
d
Equation 4: Corrosion Rate Equation with Units in μmy
where: “W” is the mass loss (g), “Icorr” is the current density in the anodic reaction (A/cm2). “A” is the estimated anodic area on the reinforcing steel in concrete (cm2). “t” is
the time and it is given per one year (s). “n” Valence of the metal and it is assumed n=2 for Iron (Fe). “F” is the Faraday constant F=96500 (coulombs per mole of electrons). “d” is the density of the metal it is assumed d= 55.85 (g/cm3) for iron.
For a better understanding of the conversion from corrosion density to penetration rate, examples for corrosion of carbon steel are given: 1μA/cm2 ≅ 0.45 mpy≅ 11.58 μmy. Where, “mpy” is an additional penetration rate unit that means mils per year.
1.5. Steel Reinforcement in Concrete 1.5.1. Stainless Steel
Stainless steel is being used as reinforcement in concrete, since aggressive environments limit the durability of carbon steel reinforced concrete. The cost of stainless steel rebar can be five times more than that of carbon steel rebar. As a result, its use in concrete structures has been restricted to critical elements, in which the corrosion attack on the reinforcement is imminent (e.g. piles, decks). Specifications of stainless steel reinforcements for concrete are stated in ASTM A955 [16].
Based on the ASTM specification [16], ferrous alloys with more than 10.5 % of chromium content by mass, and less than 1.2 % of carbon content by mass are considered stainless steel. It was found that the high chromium content in these alloys promotes the formation of the protective passive layer on the steel surface under certain
exposure conditions. It was also found that under basic or neutral exposure conditions, stainless steel might develop localized corrosion [17].
In this section of the investigation, three main topics on corrosion resistant steels will be discussed. The first point seeks to describe the relationship between the composition and the corrosion-resistant properties of the alloys. The second point describes an approach to quantify the corrosion resistance of the alloys as a function of their chemical components. Third, the properties of martensitic stainless steel will be described.
1.5.1.1. Chemistry of the Corrosion Resistant Alloys
Stainless steels contain different elements that influence their corrosion resistance properties. Chromium is the main element that increases the corrosion resistance property of the alloy. A chromium oxide film also called passive film forms on the steel surface protecting it from corrosion. In presence of oxygen, this passive film can auto regenerate. [18]. Elements such as Molybdenum, Copper, and Silicon also increase the corrosion resistance of the alloys. Others elements are added to increase their strength, formability and weldability such as, the Carbon, Nickel and Nitrogen [19].
1.5.1.2. Estimation of the Corrosion Resistance of SS
One way to measure and compare the corrosion resistance of stainless steels that contains mainly Nickel, Chromium (Cr), and Molybdenum (Mo) is through the Pitting Resistance Equivalent Number (PREN). In neutral and acidic environments [17], the formula to find PREN is as follows:
PREN = wt%Cr + 3.3 · wt%Mo + A· wt%N Equation 5: PREN Equation Given by Reference [17]
where “A” is commonly used as 16 [17]. Typical values of PREN for different stainless steels are listed in Appendix C. The PREN of UNSS41000 SS used in this investigation, was calculated by substituting its element contents in the Equation 5 as follows:
PREN of UNS S41000 SS = 11.6+3.3(0.011) +16*(0.031) = 12.13 1.5.1.3. Martensitic Stainless Steel
Martensitic steels are alloys that have been developed with high percentages of carbon and chromium. Due to the minimum 12% of chromium content in the alloy, these steels have some corrosion resistant properties. In addition, the amount of carbon in this type of alloy allows them to be hardened and strengthened by heat treatment as in the case of carbon steels. The heat treatment provides an optimum corrosion performance to the martensitic stainless steels. Some other elements are added to the alloy (e.g. Nickel and Nitrogen) to increase the weldability and corrosion resistance.
Although some high-grade allows (e.g. 300 series) may be more resistant to the onset of corrosion [19], martensitic steels could provide a more economical concrete reinforcement option that meets the common durability benchmark of 75 years. For this investigation, the Martensitic SS used was UNS S41000. This alloy includes Chromium, Nickel, and Nitrogen in the following percentages 11.66%, 0.11%, and 0.031% respectively.
1.5.2. Carbon Steel
Carbon steel has been used as a concrete reinforcement for many decades. The steel reinforcement provides strength to concrete elements. Specifications for carbon steel reinforcements for concrete are stated in ASTM A615 [20]. Its application in concrete structures has been decimated when it is exposed to chloride attack. The chloride
threshold value for carbon steel has been found around 0.4 % by weight of the cement content [12]. Technical documentation for the Florida Department of Transportation suggests the use of cement content of 658 pounds per cubic yard (pcy) for corrosion-resistant concrete applications (Type IV) [21]. For this type of concrete, the amount of chloride ion at the steel surface to initiate corrosion is given by the formula:
CT= 0.4% CF = 0.4% (658) = 2.63 pcy
Equation 6: Chloride Threshold for Carbon Steel 1.6. Service Life of a Concrete Structure
The durability of reinforced concrete structures has been summarized with a simple model presented in Figure 1.2. The durability model for reinforced concrete has two stages that define its service life span [14]. The first stage is called the corrosion initiation stage (CIS) and the second is called the corrosion propagation stage (CPS). The time needed for a reinforced concrete structure to reach its limits states is given by adding the durations of the corrosion initiation stage and the corrosion propagation stage. Often, limits states for reinforced concrete are concrete cracking, and concrete delamination [5].
Figure 1.2 Service Life Span for Reinforced Concrete.
Source: Adapted from [14]. Where CIS is Corrosion Initiation Stage, CPS is Corrosion Propagation Stage and SLS is Service Life Span. Circles Represent the End of Each
Stage. The Red Box Highlights the Uncertainty of the Duration of CPS of SS in Concrete.
1.6.1. Corrosion Initiation Stage (CIS)
During the initiation stage, aggressive substances (e.g., chloride ions) penetrate the concrete cover from the outside and accumulate at the steel surface, eventually triggering the start of active steel corrosion. In the case of flat concrete surface condition and, no rebar size effect, the duration of the initiation stage can be calculated as follows [22]: Ti = (X 2) 4 ∗ D ∗ (erf−1(1 −CT CS) 2
Equation 7: Duration of the Corrosion Initiation Stage [22]
where “X” is the concrete cover, “D” is the Apparent Diffusion Coefficient, “CT” is the
chloride threshold value of the reinforcement , and “CS” is the chloride concentration at
the concrete surface. A brief description of each influencing factor is given below. 1.6.1.1. Concrete Cover Thickness (X)
Concrete cover thickness is defined as the distance between the surface of the concrete and the outer reinforcing steel surface embedded in concrete. The concrete cover serves as a protective layer for the steel reinforcement from external contaminating agents (e.g. chloride ions).
1.6.1.2. Diffusion Coefficient (D)
In simple terms, the diffusion coefficient is defined as the rate at which chloride ions travel throughout the thickness of the concrete. According to [12], diffusion coefficients in modern concrete design can reach values of 10e-9 cm2/s.
1.6.1.3. Chloride Threshold (CT)
The chloride threshold is defined as the minimum amount of chloride ions on the steel surface required to de-passivate and subsequently breakdown the protective film of the steel. Compared to carbon steel, the CT value of stainless steels (e.g. 300-series austenitic SS) can be 10 times greater [12].
1.6.1.4. Surface Concentration Chloride (Cs)
The surface concentration is defined as the amount of chloride ions, (commonly expressed of a percentage of weight of cement or weight of concrete), at the surface of the concrete in a given environment (e.g. seawater).
1.6.2. Corrosion Propagation Stage (CPS)
During the propagation stage, the reinforcement corrosion in concrete creates expansive corrosion products that cause cracking of the concrete and associated structural deterioration. For case of carbon steel in concrete, the value of duration of the CPS was estimated in a decade [23]. It was estimated that 50 μm of metal loss of carbon steel reinforcing can cause cracking of the concrete [12]. For stainless steel in concrete, the duration of CPS is uncertain. In the absence of information, the CPS for SS was assumed conservatively as that of Carbon steel [23]. According to [24], the duration of the propagation stage depends on the critical concrete cover (Xcrit) and the corrosion rate (CR).
1.6.2.1. Critical Concrete Cover (Xcrit)
Quantifying the propagation stage duration may be derived from the quantification of the radial thickness loss of the steel (Xcrit) enough for producing cracking on the
concrete. A previous investigation [24] has derived a relationship for quantifying this loss and it is described below:
Xcrit = 0.0111 ∗ (C Ø) ∗ (
C L+ 1)
2
Equation 8: Empirical Radial Thickness Loss [24]
where “C” is the concrete cover, “Ø” is the reinforcing steel diameter, and “L” is the length of the anodic region. For this investigation, C= 1.5 cm, Ø=1.27 cm and L=1 cm (nominal average value derived from data in the reference [19]).Then, Xcrit is calculated as follows:
Xcrit = 0.0111 ∗ (1.5 1.27) ∗ ( 1.5 1 + 1) 2 = 81 𝜇𝑚 1.6.2.2. Duration of Corrosion Propagation Stage (TP)
The duration of the corrosion propagation state is given by the ratio of “Xcrit” and the corrosion rate “CR” of the steel [24] (See sections 1.4.3 and 1.7.2.2).
Tp =Xcrit CR
1.7. Electrochemical Corrosion Techniques
This investigation has applied three electrochemical techniques to estimate the corrosion behavior of the reinforcing steel in concrete. The first technique is half-cell potential and it is considered as a qualitative test of the corrosion state of the steel reinforcement in concrete. The second technique is called electrochemical impedance spectroscopy (EIS). This technique allows to determining corrosion rates, which gives quantitative measurements of the state of corrosion. The third technique is resistivity of concrete that indirectly studies the probability of steel corrosion and give an indication of the degree of the pore structure formation.
1.7.1. Half-cell Potential Method
In reinforced concrete, the steel reinforcement is balanced with its ions and the potential developed is the electrical interaction between the anodic reaction (steel oxidation) and cathodic reaction (oxygen reduction). Once the active corrosion takes place, the migration of positive metal ions to the environment gets faster and the electrical potential in the metal body becomes more negative.
The difference in potential in the circuit can be measured by using a voltmeter and a reference electrode as shown in Figure 1.3. This technique has been standardized in ASTM C-876 [4] and it is limited to estimate the probability of corrosion. Further descriptions of probability of corrosion are given in Table 1.1. No indication of corrosion rates is given by this methodology [25].
Figure 1.3 Diagram of Half-Cell Potential Measurements Table 1.1 Criteria to Evaluate the Corrosion Potential Results
PROBABILITY OF CORROSION CSE (mV) SCE (mV)
90% - High V < -350 V < -276
Uncertain -200<V< -350 -124< V <-276
10% - Low -200<V -124<V
where “V” is Electrical Potential. Source: Adapted from [4].
1.7.1.1. Potential Maps
The potential mapping technique is an application of the half-cell potential method to estimate the corrosion state of reinforcing steel in concrete [6]. This a non-destructive
technique that does not provide information on corrosion rates. To display the results using this technique, potential profiles or potential maps can be used as shown in Figure 1.4. For this investigation, the potential profiles were chosen due the geometry of the specimens prepared (~ six feet). To be an application of the Half – cell potential method, this technique also follows the criteria to evaluate the corrosion potential results given by ASTM C876 [4].
Figure 1.4 Potential Map for a Given Steel Reinforcement in Concrete
1.7.2. Electrochemical Impedance Spectroscopy (EIS)
The EIS measurements are used to obtain the corrosion rates of a system through the estimation of the value of the polarization resistance [9]. This technique consists in the application of a sinusoidal disturbance of the electrical potential produced by a given alternating current to a circuit. Meanwhile, the potential response of the system (amplitude and phase angle) is measured and the impedance is computed at each frequency of the established range (typically 1 mHz to 1Khz) [25]. The impedance “Z” is established by the ratio frequency-dependent potential and the frequency-dependent current. An estimated diagram for the EIS measurements performed in this investigation is shown in Figure 1.5
The polarization resistance of steel reinforcement in concrete can be estimated by fitting equivalent electrical circuits to the impedance spectrum [26]. Thus, the corrosion rates can be calculated by using the Stern-Geary equation.
Figure 1.5 Diagram of EIS Measurements
1.7.2.1. Equivalent Electric Circuit for Steel Reinforcements in Concrete
The equivalent circuit for corrosion of carbon steel in concrete is proposed and presented in Error! Reference source not found. [9], where “Rs” represents the solution resistance, “Rp” is the polarization resistance, and “CPE” is the constant phase angle element associated with the capacitive properties of the interface, which consist of the capacitance of the passive film formed. The Impedance of a CPE is calculated as 1/(Y*(jw)n), where “Y” is a numerical value of admittance (1/ΙZΙ) at w =1 rad/s and “n” is a
number between 0 and 1 [9].
Figure 1.6 Proposed Equivalent Circuit for Corrosion of CS in Concrete Source: Adapted from [9].
In the case of corrosion of stainless steel in concrete, a proposed equivalent circuit [27] is shown in Figure 1.7. Similarly, “Rs” represents the solution resistance; “Rsp” and
CPE2 are attributed to the metal surface areas protected by the passive layer. “Rp” is the
polarization resistance, “CPE1” is the constant phase angle element associated with the
double charge layer capacitance between the SS surface and the solution.
Figure 1.7 Proposed Equivalent Circuit for Corrosion of SS in Concrete Source: Adapted from [27].
1.7.2.2. Corrosion Rates by Using EIS
EIS measurements can provide estimates of the polarization resistance. The Stern-Geary equation uses polarization resistance values and Stern-Geary constant to calculate corrosion rates. For the purpose of this investigation, the corrosion current was calculated assuming a value of Stern-Geary constant (B) for iron (Fe) equal to B= 26 mV.
I corr = B Rp
Equation 9: Modified Stern-Geary Equation [9]
where “Icorr” is the corrosion current (A). “B” is the Stern-Geary constant for steel (V) and “Rp” is the polarization resistance (Ohms). Then, the value of “icorr” current density (A/cm2) can be determined as follows:
icorr =Icorr A
CR = icorr ∗ K
where “icorr” is the corrosion density (μA/cm2) and “K” is a conversion factor
(for Iron K = 11.58e+6)
1.7.3. Resistivity of Concrete
Electrical Resistivity is a non-destructive method to estimate indirectly the probability of reinforcement corrosion in concrete [28]. No indication of corrosion rate is given by this methodology [25]. The literature points out that a high value of electrical resistivity of concrete may indicate a low probability of corrosion of reinforcing steel. It has been found that the concrete resistivity depends, among other factors, on the water cement ratio [25]. The greater the amount of water, the faster the cathodic reaction will be.
To measure the resistivity of cylindrical concrete samples according to the Werner array probe technique (4-probes) [28], a cylindrical concrete specimen should have four probes spaced at a distance “a” (Figure 1.8). Then, a given current (I) in Amps is induced at the two external probes, and the potential difference “V” (in volts) is measured at the internal probes. The equation to compute concrete resistivity is as follows:
ρ app = 2 ∗ π ∗ a ∗V I
Equation 10: Apparent Concrete Resistivity [28]
According to [28], the Equation 10 must be corrected by a geometrical correction factor "K" when a small cylindrical concrete sample is tested.
ρ corrected =ρapp K
Figure 1.8 Concrete Resistance Measurement Using Four Probe Wenner Array. A Given Impressed Current Flow from One of the Outer Probe to the Other I1,I2.. The
Potential Difference is measured at the Two Inner Probes Va, Vb.
The following table shows criteria to evaluate the resistivity measurements in concrete according to [25]
Table 1.2 Criteria to Evaluate Concrete Resistivity Results
PROBABILITY OF CORROSION RESISTIVITY MEASUREMENTS
High ρ< 20 kΩ.cm
Medium 100 > ρ >20 kΩ.cm
Low ρ > 100 kΩ.cm
CHAPTER 2: REVIEW OF PROPAGATION STAGE LITERATURE FOR SS Sources accessed are listed in references, and further classified in Appendix A where it is indicated whether the work concerned one or more of the following categories:
1. SS reinforcement in actual structural service.
2. Exposure of SS-reinforced concrete samples to external/service environments.
3. SS in concrete or simulated pore solutions in controlled laboratory conditions.
The listing in Appendix A includes also indication as to whether for any of the SS evaluated the end of the corrosion initiation stage was reached and if so whether the end of the propagation stage had been reached as well. That latter attribute was of special interest to this project and those investigations were selected for detailed discussion, in particular if related to a structure in service (one instance as interpreted by the investigators cited) or natural/test yard exposures.
Appendix B is a listing of structures in service (mostly bridges) that incorporate SS reinforcement, noting details on construction year, location, dimensions, and quantity and type of SS used. Both Appendices A and B as well as the following Sections contain references to SS types that are variously named depending on the literature source. To facilitate comparisons, Appendix C is a table of approximate equivalence between the various SS designations.
The following Section 2 reviews relevant work in each of the three investigation categories noted above. In the following frequent reference is made to the Pitting Resistance Equivalence Number (PREN) index, a merit figure of a SS’s ability to resist pitting corrosion. The index is usually computed as PREN = wt%Cr + 3.3·wt%Mo + 16·wt%N [17], although there is some variability of multiplier factors among users.
The review is not intended to be exhaustive but rather highlights the most notable work among those listed in Appendix A. Moreover, given the scope of this work as noted in the introduction and the availability of recent detailed reviews on the performance of SS reinforcement during the initiation stage [17, 29, 30, 2, 31] , conclusions on issues pertaining primarily to that stage and related alloy rankings will not be repeated here. It is also noted that this review is limited mostly to the behavior of SS rebar that has been thoroughly descaled and freed or surface contamination by pickling and/or so-called passivation procedures [32, 33]. Moreover, with few exceptions the review considers only solid SS rebar that is normally commercially available. The reader is referred to other sources [34, 35, 36, 37] for work on the propagation stage of SS-clad rebar, which is not currently available commercially. The review also focuses on the use of the rebar as reinforcement. SS applications to pre or post-tensioned applications are emerging issue that has been considered elsewhere [38].
2.1. SS Reinforcement in Actual Structural Service
The listing in Appendix 2 shows that more than 100 bridges and related structures or sizable parts of structures have been built with SS reinforcement during the last 80 years. As shown in Figure 2.1, the pace of utilization of SS has increased during the last two decades without sign of abatement. This fast growing tendency of the SS usage in
structures emerged as designers become more persuaded of the potential economic benefits of corrosion resistant rebar, and the greater commercial availability of SS rebar. Current implementation of SS rebar in the field is evolving with various levels of quality assurance and control of rebar condition [39], [40]. Economic considerations are often a determining factor in the selection of rebar materials [41].
Figure 2.1 Cumulative Worldwide Tally of Bridges with SS Rebar
Appendix B classified SS-reinforced structures by country of origin. As shown in Figure 2.2, the U.S. leads with Europe and Canada filling much of the rest.
Progreso Pier Mexico 0 20 40 60 80 100 120 1920 1940 1960 1980 2000 2020 Nu m be r of stru ctu res Year
Figure 2.2 SS in Bridges by Country
Per Appendix B, the oldest major structure with SS reinforcing is located in Mexico (Progreso pier), having been the subject of several notable investigations. That work is detailed next, followed with a sampling of experience from other structures. It is noted that while there is abundant literature on the use of SS rebar in new structures, there are relatively few reports on actual performance evaluation after the structures were in service for an appreciably long period. The selection of cases discussed, accordingly limited, is presented in the following subsections.
2.1.1. Progreso Pier, Mexico 2.1.1.1. Background
The Progreso pier is part of the installations of the Port of Progreso in the Yucatan peninsula, located at Progreso, State of Yucatan, Mexico, latitude +21° 20' and longitude 89° 40' on the Gulf of Mexico. The yearly average temperature is 26 °C and water Cl- content is ~ 20,000 ppm [42]. The initial request for bids by the Mexican Government
specified a structure with “low corrosion-induced damage” [43]. The Danish company Christiani & Nielsen, who developed the successful bid, addressed that requirement by specifying the use of mass concrete and SS rebar and built the pier during the period 1937 – 1941.
The original 1941 pier includes three parts (Figure 2.3): the embankment, the viaduct, and the pier head. The entire structure is ~2.1 km long, 9.5 m wide in the viaduct and 50 m wide in the pier head.
Figure 2.3 Plan Layout of Progreso Pier
Based on the as-built report prepared by Christiani & Nielsen, the cross beams were cast with vibrated mass concrete and reinforced with type 304 SS rebar (SS) (UNS30400). The SS reinforcement was used to control cracks due to shrinkage and temperature in this structure [43]. According to recent evaluations, [44], the concrete cover in the cross girders in the S-N direction is ~ 20 cm and in the W-E direction is ~8 cm.
This structure contains ~200,000 kg of SS type 304. This roughly means a steel quantity of ~825 kg per beam or 14 #10 (30 mm) diameter type 304 SS rebar. Rebar, whenever exposed in recent investigations, was reported to be smooth with no corrugations. Additional information of the concrete elements in a section of the Progreso Pier is presented in Figure 2.4.
Figure 2.4 Pier Elevation and Section
2.1.1.2. Investigations of Corrosion Performance at the Progreso Pier
In the late 1990s a consulting firm performed an evaluation of the SS reinforcement of two arches (spans 8 and 9) and a column between spans 9 and 10. Results were published in a 1999 report [42]. The evaluation also included visual superficial examination of spans 1 to 7. Methods used included concrete cover and chloride content measurements, petrographic analysis, evaluation of corrosion extent, optical emission spectroscopy, and chemical and metallographic analysis of the SS.
Author’s conclusions and observations (quotation marks for special wording by authors) and comments include:
1. Despite the saline and subtropical environment combined with the use of concrete with relatively high porosity and some cast defects, no significant corrosion problems associated with embedded reinforcement were observed after 60-year service for the SS type 304 reinforcement. The tone of the findings follows that theme.
2. Visual examination revealed a few longitudinal cracks (width <1mm) but with no visible signs of corrosion.
3. At two spots in pier N-09 short segments of rebar (ends of hairpins) were directly exposed to the environment, without any cover, presumably due to previous mechanical damage. There was “serious laminated corrosion on the visible reinforcement and the reinforcement area was reduced to approximately 60-70%”.
4. In pier N-09 “breakups” of the concrete were made to examine embedded rebar. In a breakup by one of the two exposed rebar hairpins rebar cover was 18 mm and about 5% of the bar corrosion showed light corrosion. A breakup by the other hairpin revealed cover of 28 mm with <20% of the bar showing light corrosion. At two other spots in pier N-09 concrete was removed exposing cover of 32 mm (bar mostly “glossy”, only about 5% of the surface showing some light corrosion) and 105 mm (bar “glossy”, no corrosion).
5. Chloride penetration profiles were essentially flat, with near-saturation levels (typically ~ 1% Cl- by weight of concrete, with as much to 1.92%) up to a depth of ~100 mm. There was no significant evidence corrosion on the bars despite chloride contents that are an order of magnitude greater than what is normally regarded as critical for initiation of corrosion on ordinary carbon steel.
In 2002, the Progreso pier was inspected again by an academic-government interdisciplinary team to verify the state of the pier, toward outlining maintenance action
for extending the pier’s service life. Findings were published in a 2002 journal paper [45].The experimental procedure involved concrete carbonation, resistivity and chloride content measurements, as well as electrochemical techniques such as half-cell potential, corrosion rate, and metallographic analysis. Some of the findings were further stated in another publication in 2004 [46].
Concrete cores where extracted from a selected girder edge surface (at Pier 9) to test for carbonation depth, chloride content, and 11
The author’s conclusions and our observations include:
1. Chloride contamination levels were very high (1% to 2.5% of concrete weight, nearly flat profiles), in agreement with the findings above [5]. Those values were interpreted as being at or above the corrosion threshold for type 304 SS. Carbonation depth was only < 1.5 mm, typical of low elevation marine exposure.
2. Concrete resistivity measurements showed values ranging from 0.6 kΩ-cm to 2.5 kΩ-cm in the entire girder surface, consistent with highly permeable concrete and high chloride content (both evidenced by the high and nearly flat chloride profiles).
3. Some half-cell potentials were highly negative (as much as -553 mV CSE (Copper Sulfate Electrode)) suggestive of active corrosion in progress. 4. Corrosion rates estimated from linear polarization measurements with a
guard ring counter electrode ranged from 0.1 μA/cm2 (nearly passive) to 0.87 μA/cm2 (active corrosion).
5. Inspection of a core containing embedded rebar, near a part of the rebar that had been previously directly exposed to the environment, showed “a few rusty spots” identified as pitting.
6. The above findings were interpreted as providing “enough quantitative information to suspect that the SS bars from the girders are exposed to a high chloride concentration that is possibly causing their depassivation”. This work has an overall more conservative tone than that of the previous entry. Concrete porosity and density.
In 2005, a study was conducted by IMT (Mexican Institute of Transport) and CINVESTAV-Merida (Research Institute from IPN–National Polytechnic Institute) on the Progreso pier to describe its condition, translated title: “Study of the pier head´s durability and load testing of three arches in the pier viaduct of Progreso.” This work includes two parts: condition assessment of the pier head [47] and load capacity of three arches of the pier viaduct [48] . Tests conducted included carbonation depth, chloride content, and resistivity for concrete, half-cell potential, and polarization resistance for the SS bar. Cores supplementing earlier investigations were taken from cross beams Piers 9, 12, 13, 30, 34, and 164
The author’s conclusions and our observations include:
1. Confirmed high chloride content on South face of Pier 9 found in previous surveys, consistent with assumption of corrosion there.
2. Results found variability in chloride content, with more chloride on the surfaces facing South and West, and less on the other faces due to preferential rain washout.
3. Chloride content in Piers 12,13, 30, and 34 at rebar depth was high but below the assumed 1% of concrete mass threshold for type 304 SS, so “null” risk of corrosion was reported for those locations
4. The survey of pier viaduct revealed multiple cracks. They were assumed as structural cracks.
5. Cracks observed in the pier head (at cross beams at arches 161, 163,164, and 165) were deemed to be the result of rebar corrosion. That identification appears to be inferred from: 1) observations of high chloride content (~ 1.5 % of concrete mass) at rebar depth in three cores extracted from No. 164; 2) cracks observed were parallel to the SS bar and during core extraction at cracks, water used for the drill bit flow easily and reached bottom cracks, also parallel to the SS bar. Concrete discoloration was noticed along the crack as well.
6. Spalls and concrete damage in the cross girders of the pier head zone, where SS bars were found to be exposed, were apparently produced by lateral loads and boat impact and not by corrosion.
7. It was recommended to control corrosion of the SS bars by applying galvanic cathodic protection.
8. Carbonation was negligible.
In 2018 IMT published a compilation report of work to assess the durability, structural load capacity, and CFRP reinforcement of the Progreso pier viaduct. The report is entitled (translated) as “Progreso pier viaduct. The first concrete structure built with
stainless steel.” [44] This report included yearly visual inspection records of the Progreso pier for 2002-13.
The surveys showed increasing cracking incidence, to the extent that it was deemed that the structure has reached the end of its service life for heavy loads. It was recommended that heavy load traffic should be discontinued. The structure had been subject to repairs including CFRP strips at arches and pile wrapping reinforcement, but cracks had developed on some of it afterwards. It is noted that the deterioration was ascribed primarily to increasing traffic load on account of a pier extension having been built at the end of the 1980s. Corrosion of reinforcement was mentioned, but not identified as the primary cause of the deterioration.
2.1.1.3. Summary
This structure is the main exponent and most potentially informative source of the performance of SS rebar in aggressive corrosion conditions. The information is of special interest given that the pier rebar material is type 304 austenitic SS, somewhat less corrosion resistant than the type 316L SS commonly specified at present, but still sharing many mutual characteristics. The pier presents significant structural deterioration, but generally ascribed to enhanced loading and not the primary result of corrosion damage of the rebar.
A summary of reported results in the form of a damage function was created and presented in Figure 2.5, constructed using time sequence data from Reference [44]. This figure shows the cumulative reported percentage of damaged arches (rhomboidal symbols), out of a nominal total of 171 arches in the pier per Reference [43]. The damage assessment included cracks, stains, and structural settlement. By 2007, the damaged
arch tally reached 100 %. Four cross beams (161,163,164,165) out of a nominal total of 172 presented cracks that were attributed to corrosion, based on indirect evidence, per Reference [44] (red circle).
Figure 2.5 Notional Damage Function Displaying Percentage of Progreso Pier Arches Showing Distress.
Crossbeams with Cracking Attributed to Corrosion Damage, as a Function of Structure Age since Construction Completion in 1941 are Presented as Well.
In general, there is no direct evidence that cracking of the concrete cover was caused anywhere by expansive products of the SS bars: no external corrosion stains were observed, only concrete discoloration along the crack. There is some very limited direct observation of embedded rebar corrosion (the 2002 study, apparently limited to only one specimen, and the 1999 investigation referring to discoloration in a few
specimens) but without indication that the extent of corrosion was sufficient to cause concrete cracks, or to have resulted in the appearance of corrosion products at the external concrete surface. Indirect evidence includes some instances of corrosion rates (from linear polarization tests) that have values comparable to those that, for carbon steel rebar, would eventually cause concrete cracking. There were also half-cell potential measurements negative enough to have been, for carbon steel rebar, indicators of severe corrosion eventually leading to concrete cracking.
Finally, there were also instances of chloride content values at the rebar depth what would meet or exceed proposed values (>1% of concrete mass) of the chloride threshold for 304 SS rebar, a situation encountered for one case of concrete cracking and thought to exist at other 3 comparable locations. There were two cases of SS rebar that had corroded severely, but that was at two locations where the rebar cover was locally missing for a short distance (a few inches) and where the SS had been directly exposed to seawater for a period that may have been decades long. The evidence was not indicative that the cover missing was from a corrosion spall or other corrosion-induced result, but from an external impact (probably from a ship docking).
To help achieving the objectives of the present investigation, it is essential to seek direct evidence linking the extent of corrosion of the SS bars with manifestations of having reached a limit state. To that end, it would be highly desirable to obtain concrete cores, intersecting and containing rebar segments, from the cracked region of arches such as No. 161, 163,164, and 165 where suspected corrosion induced cracks had developed. The rebar in the cores would be examined in detail to ascertain the extent, morphology, microstructure and composition of any existing corrosion products. That information