T
o successfully manage your land, you need to know what you have. Surveying and mapping are two interrelated ways to describe your property in a way that helps you make manage-ment decisions. In this publication, we’ll describe surveying with an emphasis on the Public Land Survey System, which serves as the basis for describ-ing property boundaries in our region. We will also discuss the various types of maps used in woodland management as well as some of the new technology currently being used to collect and analyze geo-graphic data.Survey Types and Uses
Land surveying is the process of gathering and analyzing information about the physical earth. It’s the science of determining relative positions of existing points on the earth’s surface or of establishing such points. Surveys are conducted when one wants to locate property boundaries, roads, structures, watercourses, and other physical characteristics of the land. This work is carried out by licensed surveyors using a range of equipment and techniques. Surveyors are most commonly employed by landowners to mark or remark property boundaries, easements, and other legally deeded features, although there are many other
services they can provide, such as flood mapping Tristan Huff, Extension forestry agent, Coos and Curry counties, Oregon State University. Tristan Huff
PNW 581 • March 2015
Land Survey
and Mapping
An Introduction for Woodland Owners
A Pacific Northwest Extension Publication
Oregon State University n Washington State University n University of Idaho
and new road layout. When surveyors work with property boundaries and other features described in your deed, they will always work within the framework of the Public Land Survey System.
The Public Land Survey System
Most of the United States (outside the 13 original colonies, Kentucky, Tennessee, and Texas) has been surveyed using the Public Land Survey System. This is the kind of survey you’ll be most likely to work with.
In 1785, the Congress of the Confederation enacted a land ordinance for the public lands northwest of the Ohio River. The law provided for the survey of public lands into townships of 36 square miles. The ordinance established the use of the Cadastral Survey Plat, a system for recording land patents and related records essential to the chain of title. The rectangular survey system and, in 1800, the tract book system for permanently recording titles became the standard for transferring public lands into private ownership as western migration progressed.
In 1789, Congress established the Treasury Department and gave it responsibility for overseeing the sale of public lands. On April 25, 1812, the General Land Office (GLO) was created within the Treasury Department to oversee the sale and transfer of public lands into private hands. The GLO was transferred to the new Department of Interior in 1849. In 1946, the Bureau of Land Management (BLM) was created by merging the GLO and the Grazing Service.
BLM cadastral surveyors still conduct surveys of all federal lands being transferred by sale, donation, acquisition, or exchange. The BLM continues to provide GLO land and mineral recordation services for federal lands. The Oregon State Office of the BLM maintains a complete collection of all land status records, cadastral survey records, and mining claim records for Oregon and Washington. The Idaho State Office maintains records for Idaho.
BLM status records are current only for
federal lands. Once land leaves federal ownership, subsequent private title transfers, rights, and restrictions are recorded in the appropriate county assessor’s office.
How the Public Land Survey
System Works
The Public Land Survey System sets up a systematic grid, with the objective of establishing approximately 1-mile-square sections (1 mile on a side).
The rectangular survey system is built on a series of 37 initial points located through the United States. These points were very accurately located through astronomical observations and don’t change. Using these 37 points, control can be established for surveys anywhere in the areas of the continental United States covered by the Public Land Survey System (Figure 1). From each initial point, principal meridians run north and south, and baselines run east and west, creating the framework for the Public Land Survey System grid.
In Oregon and Washington, the rectangular survey system is referenced to the north–south Willamette Meridian and the east–west Willamette Baseline. These two lines cross on an initial point called the Willamette Stone located in the west hills of Portland. In Idaho, the system is referenced to
Figure 1. The initial points, principal meridians, and baselines for the Public Land Survey System. Bureau of Land Management
the Boise Meridian and Baseline, the initial point of which is in Meridian, Idaho.
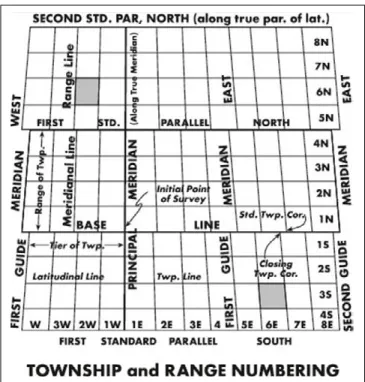
From each initial point, a grid of townships is established north and south of the baseline and east and west of the principal meridian. Townships are approximately 6 miles on each side and are numbered from the baseline, starting with Township 1 North (T1N) north to the Canadian border and Township 1 South (T1S) south to the California and Nevada state lines.
The east-west positions of a township are designated by its range. Ranges are numbered from the meridian west (e.g., R1W) and east (e.g., R1E). Thus, a township that is six grid locations north of the baseline and two grid locations west of the principal meridian would be designated as T6N, R2W. Similarly, a township three grid locations south of the baseline and six grid locations east of the principal meridian would be designated as T3S, R6E (Figure 2).
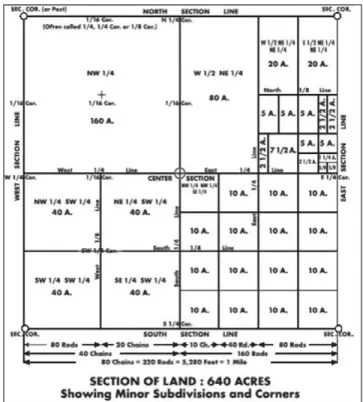
Normal townships contain 36 sections. Each section is approximately 1 mile square and contains 640 acres. All townships use the same system for numbering the sections within them. Sections are numbered beginning with number 1 in the northeast corner, going west to number 6, then south to 7, east to 12, south to 13, and so on (Figure 3).
Every section has four quarter corners, which usually are the midpoint on each of the lines forming the boundaries of the section. Sections can be
divided into quarters and halves by connecting these points. With a line drawn north–south or east–west through the center of a section to connect two quarter corners, the section is divided into halves. Each half is identified by its location in the section (north half, south half, east half, or west half).
With lines drawn north–south and east–west through the center of a section to connect all four quarter corners, the section is divided into quarters (Figure 4, page 4). Again, each quarter is identified by its location in the section (northeast quarter, southeast quarter, northwest quarter, or southwest quarter).
Halves and quarters can be subdivided further. Thus, a 40-acre block might be identified as the southwest quarter of the northwest quarter of Section 14, Township 2 South, Range 3 West,
Figure 3. Standard township plat
Figure 2. An example of township and range numbering
Willamette Meridian. A legal description then follows in parentheses. The legal description for small ownerships often includes a parcel identification number that may not match the quarters of a section. When these parcels deviate in shape from the usual subdivisions mentioned above, a licensed surveyor must tie the property
Figure 4. Section of land (640 acres) showing minor subdivisions and corners
lines into previously established section corners or quarter-corners.
Sometimes the grid isn’t perfect. For example, although every section is basically square and has four corners, these corners may or may not be shared with the adjoining section. And although each section should be 1 square mile and there are 640 acres in 1 square mile, not all sections have 640 acres. These discrepancies are a result of occasional measurement errors that were inevitable given the challenges of surveying vast tracts of unsettled wilderness. Also, because the Public Land Survey System uses plane surveying, which doesn’t take into account the curvature of the earth, surveyors would sometimes offset corners to avoid overlapping ownership; the result is sections that don’t have exactly 640 acres. Because of the process surveyors used to initially lay out townships, odd-shaped sections are generally along the western edges of townships.
Working with Maps
Maps are used for many different purposes and are created using many different survey methods. This section describes some features common to all maps and also discusses the different types of maps commonly used by woodland owners.
Features of a Map
MAP SCALES AND DISTANCES
A scale allows one to accurately estimate ground distances from maps. Map scales are written either as a ratio (1:12,000) or a representation (1 inch = 1 mile). In the first case, 1 inch on the map represents 12,000 inches (1,000 feet) on the ground. In the second case, 1 inch on the map represents 1 mile on the ground. In either case, you can find the distance between two points on the map by measuring with a ruler and multiplying by the map scale.
To try this out, select two points on a map. Measure the map distance using a scale or ruler that shows inches and tenths of inches. Now multiply the measured distance by the map ratio. Convert inches to feet. You’ve calculated the horizontal ground distance between the two points. Note that on steep ground, the horizontal distance calculated from a map will underestimate the slope distance which is the actual
When you use a map’s scale to measure the distance between points, you are measuring the horizontal (or map) distance. This is the “as-the-crow-flies” distance and doesn’t take topography into account. When traveling on the ground, you are traveling the slope distance, which will be longer (unless the ground is perfectly flat).
distance you would travel on the ground (see sidebar, “Accounting for Slope Distance,” page 4).
Enlarging maps using a photocopier provides a level of accuracy suitable for most woodland management applications. For example, a 1:24,000-scale USGS topographic (topo) map can be enlarged 200 percent to a 1:12,000-scale topo map. Distortion can be a problem, but the cost is very reasonable. Caution: If the scale is too large or too small, the map may be difficult to use for a given project.
DIRECTION
Maps are made with direction in mind, and the top of a map is usually oriented to true north (See “Magnetic Declination,” below). If you know how to read the direction between two points on a map, then you can use a compass to find the same direction on the ground and move from point to point.
Direction is expressed as azimuths or bearings. Azimuths are based on the 360 degrees of the compass. North is zero or 360 degrees. Azimuths are read clockwise from north, so east is 90 degrees, south is 180 degrees, and west is 270 degrees. Bearings are based on four 90-degree quadrants. Beginning from a north–south line, bearings are read from north to either east or west or from south to either east or west. For example, a bearing of N 45 degrees W is the same as an azimuth of 315 degrees, and a bearing of S 30 degrees E is the same as an azimuth of 150 degrees (Figure 5). Bearings are no more than 90 degrees since each quadrant contains only 90 degrees.
Figure 5. The bearing (left) and azimuth (right) systems of describing direction.
Figure 6. Laying out an azimuth on a map
Magnetic Declination
Earth’s magnetic field doesn’t align perfectly with the North and South poles. Because of this offset, there is a true north (the direction to the North Pole) and magnetic north (the way a magnetic compass will point). Maps are usually oriented with true north straight up, so to navigate using a magnetic compass you need to account for the offset between true north and magnetic north. This compass adjustment is called magnetic declination. Magnetic declination varies depending on your location and also shifts over time. In the Pacific Northwest, declination ranges from 12 degrees east in eastern Idaho to 17 degrees east in northwest Washington. You can find the precise declination for your area by visiting
www.ngdc.noaa.gov/geomag/declination.shtml National Oceanic and Atmospheric Administration
N 450 W 3150
1500 S 300E
Map work is most often done using azimuths rather than bearings because azimuths can be read more easily from a map using a 360-degree protractor. Select two points on a map and draw a line true north–south through one of the points and a line between the two points. Lay the protractor oriented north–south on the north–south line with the center of the protractor on the point. Where the line crosses the edge of the protractor, read the true azimuth from point to point (Figure 6, page 5).
Maps Commonly Used by
Woodland Owners
Transportation MapsAlthough a transportation map (Figure 7) typically covers a large area, such as an entire state or county, it can be used to help describe the location of your property. Transportation maps vary in design depending on who owns the land. Each government agency usually uses a consistent design, but there’s little consistency across agencies and
even less between maps of private and public lands. Typically, Forest Service maps concentrate on roads on National Forest lands and might not show other connecting roads. BLM maps do the same for BLM lands. This inconsistency can be a problem if you’re working in an area with checkerboard ownership. Forest Service and BLM transportation maps are available at National Forest and BLM district offices. State departments of transportation often produce maps at the state and county level.
Topographic Maps
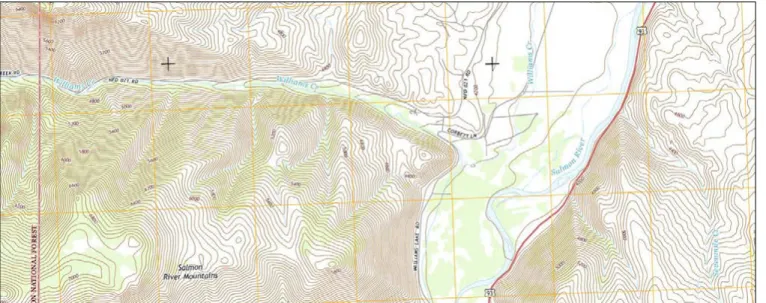
The U.S. Geological Survey (USGS) produces topographic (topo) maps which show hydrology, vegetation, geologic features, and human-made structures. Topo maps also contain contour lines that depict the lay of the land and can be used to estimate an area’s slope (Figure 8, page 7). Older USGS topo maps are available with a scale of
1:48,000 (1 inch on the map represents 48,000 inches or 4,000 feet on the ground) and newer USGS topo
Figure 7. An example of a transportation map Oregon Department of Transportation
maps are available with a scale of 1:24,000 (1 inch on the map represents 24,000 inches or 2,000 feet on the ground). The newest USGS 7.5-minute quads are available online in a format that allows you to select which layers (contour lines, streams, roads, etc.) are displayed (nationalmap.gov).
Plat Maps
Plats are maps used to record the legal boundaries of a property (Figure 9). These maps typically cover a single section, although they may be larger or smaller depending on the number of subdivisions. Property lines are described by their length and direction and some physical features and roads are included. While a surveyor should always be employed to accurately locate property boundaries, a landowner skilled with a compass can use a plat to approximate property lines on the ground. Plat maps can be found by visiting your county assessor’s office or online.
Aerial Photographs
Aerial photographs (Figure 10) are not maps per se but they can be used for many of the same purposes. Early photos were black and white, but now, high-resolution color photos allow one to discern species, density, tree height, and many other attributes of a forest. The present industry standard for stand-level photo coverage is a 1:12,000-scale color photograph. At this scale, with the aid of a
Figure 8. A topographic (topo) map from the U.S. Geological Survey U.S. Geological Survey
Figure 9. A surveyor’s plat map Coos County, Oregon
Figure 10. Aerial photographs are simple but contain a great deal of useful information.
hand lens, you can recognize an individual tree or brush clump as small as 2 feet in diameter.
Most photographs are oriented with the top of the photo to north. The top of the photo has information about the flight line number, photo number,
date of flight, and land ownership. Usually, aerial photographs are available as digital images that are either viewable on a computer or as printed copies.
A unique feature of aerial photography is the ability to see three-dimensional images of the land base, which makes it possible to see the topography of the land. This feature makes aerial photos extremely useful not only for planning purposes but also for locating on-the-ground features. Most people need overlapping photos and a tool called a stereoscope to see three-dimensional (3D) images (Figure 11). Overlapping images are obtained by following a flight line across the land base and taking pictures at predetermined intervals. People with good stereo vision and eyes of equal strength often can see 3D images without a stereoscope. New technologies allow for the creation of 3D images from aerial photographs. Some of these 3D maps are available online for metropolitan areas (maps.google. com) and will become more widespread in the future (Figure 12).
Because of the way aerial photographs are taken, older photos might contain distortions that can make measuring azimuths and distances difficult. However, almost all newer digital photos have been orthorectified, or geometrically corrected, to account for distortions. The resulting orthophotos can therefore be treated like detailed maps for the purposes of calculating distances and azimuths.
Figure 11. This stereoscope allows two users to view and
magnify aerial photographs in stereo. Figure 12. A 3D view of a forested landscape was created using angled aerial photographs from Google Maps.
Figure 13. A map created using GIS. Layers include an aerial photograph, property boundary, and streams buffered by riparian management areas.
New Technology in Mapping
Like many other aspects of land management, mapping and surveying have entered the digital era. While the basic principles discussed above still hold true, new technologies including Geographic Information Systems (GIS), the Global Positioning System (GPS), remote sensing, and Light Detection and Ranging (LiDAR) have greatly increased the amount of information available to landowners.
Geographic Information Systems
A Geographic Information System links
information collected about the earth and its features and resources to a digital base map. Information on each type of resource is stored as a mapping layer, like layers of acetate laid over one another (Figure 13). Resource layers commonly include the Public Land Survey System, topography, transportation, water, vegetation, geology, and land ownership. Digital aerial photographs are also commonly used in a GIS. The layering of different features allows for
complex analyses and modeling as well as detailed, efficient mapmaking.
GIS is generally an application for owners of large properties, but some small woodland owners are finding them to be useful. Freely available, web-based GISs such as Google Earth (earth.google. com) and Web Soil Survey (websoilsurvey.nrcs.usda. gov) allow easy access to quality aerial photographs and have tools for mapping and simple geographic measurements and analyses.
GPS
The GPS is a network of satellites orbiting the earth, transmitting very precise time and position data day and night. Signals from these satellites are broadcast to hand-held units on the ground. When the hand-held receiver receives signals from three or more satellites, it uses trilateralization to determine the user’s position on the earth. Hand-held units (Figure 14) vary in cost from as little as $100 for consumer-grade receivers up to tens of thousands of dollars for survey-grade instruments. Many mobile devices such as smartphones and tablets now have built-in GPS receivers.
Accuracy of inexpensive GPS receivers and smartphones can be low, especially when trees or other obstacles don’t allow a clear view of satellites,
Figure 14. A consumer-grade GPS receiver
but they can still be useful for making rough estimations or for navigation in the field.
GPS units can be used as stand-alone devices to estimate areas, distances, and elevations, and they can also be used to collect data for a GIS. Alternatively, features from a map or GIS (such as property lines, or points of interest) can be uploaded to a GPS receiver. This allows for easy navigation to those features on the ground.
Remote Sensing
Remote sensing is the process of collecting data about the earth from sensors in the air. Aerial photographs are the most familiar product of remote sensing, but images are also collected by satellites orbiting the earth. Because satellite images are taken from such a high elevation, they are typically of a larger scale and, thus, not useful with small properties. They can, however, contain additional information, including infrared images, and for a given point on earth, there will be multiple satellite images taken each year.
The recent development of unmanned aerial systems (UAS) capable of taking aerial photographs now allow for relatively inexpensive remote sensing over small properties. These small aircraft are capable of taking very high-resolution aerial photographs that are immediately available for use and analysis.
Potential uses in forestry include insect or disease surveys, forest inventory, wildlife monitoring, and fire detection. Unmanned aerial systems are a very new technology and are not currently readily available to landowners, but they are expected to revolutionize how forest properties are remotely sensed and mapped.
LiDAR
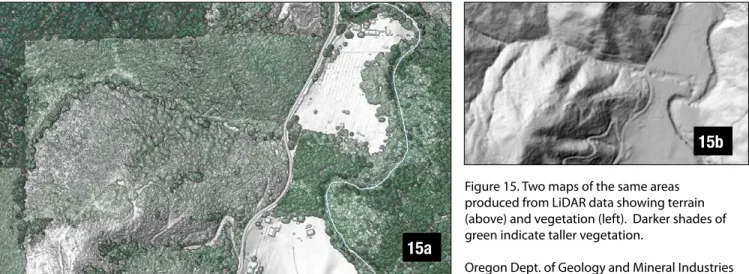
Light Detection and Ranging (LiDAR) is a special form of remote sensing that uses lasers to detect distances. By flying over a forest with a LiDAR sensor, a detailed, three-dimensional map can be created of the topography and also of vegetation. LiDAR topographic maps are detailed enough to view old stream channels, roadbeds, and the sites of landslides. Since vegetation is also detected with LiDAR, the heights of trees can be used to delineate different stands in a forest (Figures 15a and 15b).
Summary
There is a wide variety of tools and resources available to help you understand the geographic content of your woodland property—especially now, in the digital age, when new technologies are born every day. When exploring options for mapping your property, it’s important to keep in mind your specific goals and objectives. For small properties or
those managed less intensely, a simple set of aerial orthophotos might be all you need to accomplish what you need to get done. However, if your goals require more intense management, or your property is large or complex, more sophisticated mapping methods, perhaps using a computer, may be called for. With a basic understanding of the options available and of the Land Survey System, you are well on your way to developing an efficient and useful system for mapping your property.
For more information
Textbooks
Paine, D.P. and J.D. Kiser. 2012. Aerial Photography and Image Interpretation. New York. John Wiley Inc.
Kiser, J.D. Surveying for Forestry and the Natural Resources. 2010. Corvallis, OR: John Bell and Assoc.
Map and photo sources
Local Forest Service, Bureau of Land
Management, and state forestry or natural resources offices have transportation and topographic maps that show private and public ownership. However, since there are large blocks of private ownership that don’t adjoin federal lands, maps of these lands may
15a
15b Figure 15. Two maps of the same areas produced from LiDAR data showing terrain (above) and vegetation (left). Darker shades of green indicate taller vegetation.
Trade-name products and services are mentioned as illustrations only. This does not mean that the Oregon State University Extension Service either endorses these products and services or intends to discriminate against products and services not mentioned.
© 2015 Oregon State University. Extension work is a cooperative program of Oregon State University, the U.S. Department of Agriculture, and Oregon coun-ties. Oregon State University Extension Service offers educational programs, activities, and materials without discrimination based on age, color, disability, familial or parental status, gender identity or expression, genetic information, marital status, national origin, political beliefs, race, religion, reprisal, sex, sexual orientation, veteran’s status, or because all or a part of an individual’s income is derived from any public assistance program. Oregon State University Extension Service is an AA/EOE/Veterans/Disabled.
Published April 2006, Revised March 2015
not be available from federal sources. You may be able to obtain limited GIS maps from these agencies for cooperatively developed projects.
Most Forest Service and BLM offices have aerial photos of their lands, which often cover adjoining private lands as well. You may be able to borrow these photos and make color copies for field use. Again, large blocks of private land would not be available. Copies usually can be obtained at high-quality copy shops. Digital aerial photographs are available from a variety of online sources or from local Natural Resource Conservation Service and Farm Service Agency offices.
Every county courthouse has maps showing ownership of each tax lot. These maps contain property boundaries, public roads, and bodies of water, and can be useful as base maps for management plans. Many counties now have an online GIS with aerial photography overlain by property boundaries.
Numerous online map services, including Google Earth (www.earth.google.com) and Bing Maps
(www.bing.com/maps), provide easy access to fairly high-quality aerial photographs and transportation maps.
Idaho, Oregon, and Washington each has its own geospatial office that provides a wide variety of digital mapping and remote sensing products:
• Oregon Geospatial Enterprise Office
• Idaho Geospatial Office
• Washington State Geospatial Clearinghouse
Historical maps and aerial photographs are often available through university libraries. Map libraries for Idaho, Oregon, and Washington include:
IDAHO
University of Idaho Library Map Collection
Moscow, ID 83843-4144 Tel. 208-885 6584
OREGON
Map and Aerial Photography Library
University of Oregon 1501 Kincaid Street Eugene, OR 97403-1299 541-246-3053
WASHINGTON
Map Collection and Cartographic Service
University of Washington Libraries P.O. Box 352900
Seattle, WA 98195 2900 Tel. 206-543-4164