Requirements Gathering through First Responder Social Network
Analysis
∗
John S. Erickson
James P. McCusker
Zachary Fry
Rui Yan
Katherine Chastain
Deborah L. McGuinness
June 20, 2013
1
Introduction
In this report we present our work on applying social network analysis to the problem of enabling and supporting a requirements gathering methodology for stakeholder communities active in social media. We describe the design and prototype of a methodology optimized for the first responders community, based on a “dashboard” or set of online tools for interacting with the results of focused social network analysis. Our objective is to create a repeatable set of methods that can be applied to online first responder communities to carry out stages of the requirements gathering process. We are currently developing and refining a set of software tools to support these methods.
By “first responder” we refer to those individuals who, in the early stages of an incident, are responsible for the protection and preservation of life, property, evidence, and the environment; as well as emergency management, public health, clinical care, public works, and other skilled support personnel that provide immediate support services during prevention, response, and recovery operations. [2] Our interests are not specifically in the direct use of social networks for disaster response — this is an active area of study by others, including Cohen et.al [3] — but rather in how network analysis of community interactions before, during and after disasters can be used to identify roles within the community, thought leaders, significant contributors, and their topics of discussion.
Our team at the Tetherless World Constellation at Rensselaer Polytechnic Institute (TWC RPI) has been examining the current state of collecting and synthesizing responder requirements; assessing the effectiveness of that process; understanding current social media practices and platforms in use by the first responders community; identify tools and techniques for identifying potential requirements stakeholders within those networks; and ultimately producing a roadmap that can be used by the U.S. National Institute of Standards and Technology (NIST) and others to more effectively interact with key stakeholders in the first responder community.
A prototype implementation of the TWC RPI dashboard and methodology is in development using this roadmap and has been made available for testing, evaluation and actual requirements gathering. We have identified key aspects of an effective first responder requirements dialogue, driven and facilitated by social network analysis, ranging from identifying a stakeholder community and applying best practices for sustaining such communities, to producing actionable information to facilitate the research and standards processes.
We believe a key contribution of this work is our demonstration of the feasibility of analyzing ongoing social network activities by first responders to identify best-fit candidates to participate in a structured requirements gathering methodology. Continued development of the TWC RPI dashboard will demonstrate
its effectiveness in identifying themes for requirements gathering based on first responder interactions during disasters and day-to-day incident responses.
Our team has been recruiting stakeholders to provide exemplars of current practice, and will depend on their domain knowledge for observations that will transform the requirements gathering process. The path this evaluation takes depends heavily on the responses from the community; while we anticipate stakeholders will express concerns ranging from accessibility to transparency to usability, our hope is to uncover key observations that lead to transformational change in the requirements gathering process.
The TWC RPI team is developing a web-based portal to host our dashboard, our methodology and as a collection point for feedback and collaboration. We selected Drupal Commons1, a social network-enhanced
“installation profile” for the popular Drupal content management platform, as the basis for our prototype First Responders Innovation Network Portal.2 We expect that we will need to interconnect with other social
media sites, but are showcasing Drupal as a potential example of a “from scratch” social media site to engage stakeholders.
2
Requirements Techniques
We developed a framework based on ten familiar requirements gathering and refinement techniques that can be applied to stakeholders drawn from first responder social networks; our initial focus has been on that subset of the first responder community who are active on Twitter. Twitter was chosen both because it is clear that a large and growing number of first responders actively use it and because it provides a convenient representation of an accessible social media platform. [3] Our prototype tools take advantage of some features unique to Twitter, but we believe our approach can be adapted to most social media settings. The TWC RPI methodology is described below. Each facet of the methodology begins with a summary of a technique drawn from accepted requirements practices. A social network-driven model for identifying, recruiting and interacting with a group of stakeholders appropriate for each technique is presented, based on prototype social network analysis tools developed at RPI. Specific approaches are discussed in detail that can be or have been used to apply the technique to refine requirements in the first responders domain, depending upon whether the objective is to identify an area where requirements need to be gathered, actually need to be gathered, or an existing requirements document needs to be refined.
3
Overview of the First Responders “Data Dashboard”
3.1
Purpose
The First Responders Data Dashboard helps users identify potential stakeholders associated with a first responder community on Twitter. The Dashboard walks the user through a four-step process designed to filter active discussions relevant to first responders and identify users that are active contributors to that discussion. Those steps include Initial Hashtag Selection, Twitter Activity Analysis, Topic Modelling and Selection, andUser/Hashtag Co-occurrence. 3
3.2
Dashboard Step 1: Initial Hashtag Selection
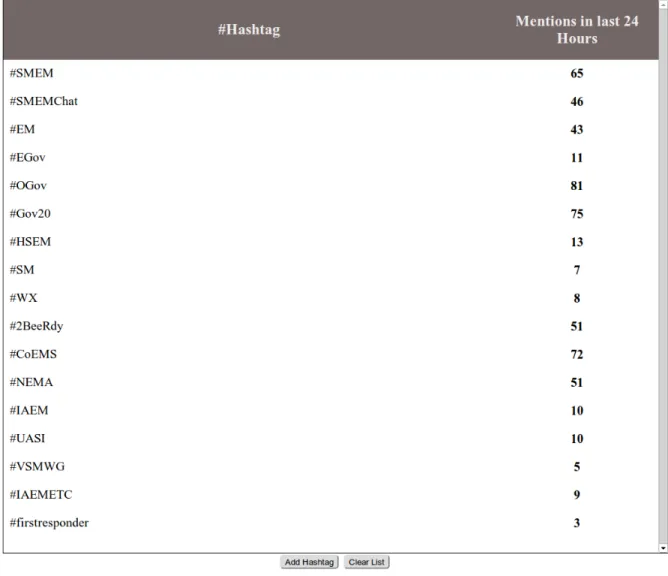
Description of Hashtag Selector Interface: The screenshot below shows the initial screen a user sees when accessing the dashboard. The list of hashtags is pre-populated with a list of 17 hashtags determined to
1
http://drupal.org/project/commons/
2http://firstresponders.tw.rpi.edu
3Prototypes of the tools comprising the Dashboard are available athttp://ec2-50-16-166-117.compute-1.amazonaws.com/
be relevant to first responders.4 For each hashtag in the list the tool displays how many times that hashtag
was mentioned during the previous 24 hour period.
The hashtags provided on this list serve as a starting point for analyzing first responder communities. The hashtags are passed into the Twitter crawler where all tweets that contain at least one of these hashtags are stored. A user can add a hashtag using the Add Hashtag button, and can clear the list using the Clear List button. To remove a hashtag, a user simply moves their cursor over a hashtag in the list and clicks. The screenshot above shows the user with their cursor over the #EM row, and if the user were to click, a prompt opens up confirming that the user does want to remove #EM from the list, and if true, then it is removed.
Future work for the Hashtag Selector Interface: Future work on this interface should include displaying mentions in the last 24 hours, based on a query requesting all mentions of a hashtag in the last 24 hours, updated at regular intervals.
Another feature of interest is trend analysis. The color of the font for each hashtag could range between a red and a green value, indicating the change in mentions over a smaller interval like 5 minutes. So, for example, if #SMEM has been mentioned frequently over the last 10 minutes, the font would be green in the list, whereas if #EM was not mentioned at all over the last 10 minutes then the font would be red.
Finally, It would be useful to display a live stream of tweets that mentioned these hashtags appear on the screen concurrently with the list of hashtags. This feature could possibly be implemented with Twitter’s Streaming API or Twitter’s Widget Interface.
3.3
Dashboard Step 2: Twitter Activity Analysis
Description of Twitter Activity Analysis Interface: This step involves focusing the analysis over an interval of time that might be more relevant given first responder discussions. The first screenshot shown below is a time series display of Twitter activity over a period of 9 days in February 2013. Each column in the chart represents the total number of tweets for a specific date and time. The width of each chart represents one hour, and the height represents the number of tweets over that hour time interval.
The chart is split horizontally in two. The bottom part is a draggable selector that allows the user to select a range of time at which to view tweets. The top part is then the twitter activity over the period of time specified in the bottom part. In the first screenshot below, the bottom part of the display is selecting the entire time range that the tweets were collected over. The cursor is over one of the columns, showing the tweet activity for that date and time.
The screenshot below shows the chart with the bottom part isolating a two day period of time, which is reflected in the top part. Each interval in the screenshot below is still one hour, and the height of each column is the number of tweets collected over that hour period. The cursor is once again over the same value as the screenshot below, showing the number of tweets for that specific time. The user continues on to the next step once they have specified the time window that they have chosen from the chart.
Future work for the Twitter Activity Analysis Interface: Future work on this interface involves refining the zoom functions on the top of the interface; in particular, it would be useful for these to enable the user to select a predetermined interval of time to analyze the occurrence of tweets.
3.4
Dashboard Step 3: Topic Modelling and Selection
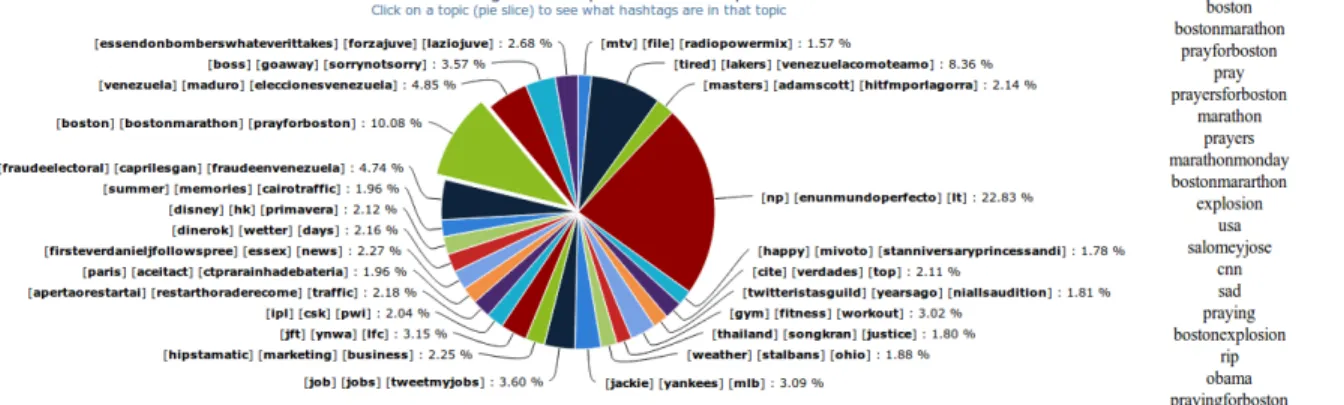
Description of Topic Modelling Pie Chart: The screenshot below shows the output of performing topic modeling on the Twitter data for the time period specified from the previousTwitter Activity Analysis. The topic modeling evaluation is performed on the server using MALLET, an open source machine learning and text analysis tool developed by UMass Amherst. 5 Topic modeling allows the user to cluster commonly
co-occuring hashtags into a group determined by how probably it appears with other hashtags in that topic.
4The list of hashtags used in our prototype includes #SMEM, #SMEMChat, #EM, #EGov, #OGov, #Gov20, #HSEM,
Figure 1: Hashtag Selector Tool: Indicates the number of times hashtags of interest appeared in the sample data over a 24 hour period
Figure 2: Twitter Activity Timeline: Displays Twitter activity on an adjustable timeline
Figure 4: Topic Modelling Tool: Each ”pie slice” represents the percentage of total tweets in the sample data reflected by a given ”topic” (a specific set of tags)
The pie chart in the screenshot below shows the top ten topics that occurred over the tweets collected over the period of time from the step before. When a user moves their cursor over a slice in the pie chart, a tooltip pops up showing the topic number, the percentage of the tweet set that the topic represents, and top 20 hashtags that define that topic. In the screenshot below, the cursor is positioned overTopic 4, highlighting the hashtags associated with that topic.
This analysis is useful for finding active conversations that first responders are having on Twitter. In the example above, the hashtags that define that topic are intuitively linked: #nemo, #blizzard, #snow, #weather, these are all hashtags that are discussing Winter Storm Nemo which was occurring during this particular data collection. This allows for the user to find sub communities within the first responder network on twitter, which could be useful for finding other users interested in that topic. The user continues on to the next step by selecting a topic that they want to analyze.
Future work for the Topic Modelling Pie Chart: This tool presents a unique user interface challenge that we are wrestling to optimize. Future work will include collecting user feedback and iterating on the interface to find a metaphor that best fits with the users understanding of the hashtag space they are navigating.
3.5
Dashboard Step 4: User/Hashtag Co-occurrence
Description of the User/Hashtag Co-occurrence Matrix: The screenshot below presents a co-occurrence matrix that relates the number of times a specific twitter user mentioned a specific hashtag. Along the vertical axis are hashtags from the topic selected from the previous step, denoted by the “#” symbol, and along the horizontal axis are the 20 most active twitter users, denoted by the “@” symbol. The strength of the color in each cell indicates the relative number of mentions that the twitter user mentioned that hashtag. When the user using the dashboard moves their cursor over a cell, the number of times that the hashtag was mentioned by that twitter user is displayed in a tooltip, as shown in the screenshot below. This analysis leads the user to the ultimate goal of discovering potential stakeholders relevant to a particular topic of discussion on Twitter. Users that are actively mentioning hashtags that are associated with a topic of interest could be seen as people who have a particular vested interest in first responders. This could lead to future relationships with the user in the form of interviews or other active communication.
Figure 5: Hashtag Co-occurance Tool: Indicates the frequency of watched tags and the most frequent user of those tags
4
Applying the Data Dashboard to Requirements Gathering
In the sections above we have described a set of prototype tools for analyzing social networks to identify first responder participants and popular topics of discussion, specifically focusing on tools that leverage Twitter data, a convenient source of social media data produced by first responders. Our social network “dashboard” enabled requirements developers to interactively visualize the social network activities of first responders, identify key contributors collect information on key issues, and collect requirements “snippets” or user stories [?] from the community’s Twitter activity. The following methods are used by one or more techniques in our methodology.Identifying stakeholders: Candidates to be recruited to participate in the process can be identified by analyzing active first responder social network “channels” or hashtags used by influential users. Twitter user activity using particular hashtags is analyzed, key contributors are identified, and candidates are selected based on the nature of their contributions. Users who are highly connected within or between groups in these channels tend to be knowledgeable about the needs and challenges of their groups and can serve as useful representatives of that group or links to others who are equally or better suited. [1]
Identifying clusters of stakeholders: Clusters of stakeholders may include users whose Twitter activity covers a set of topics that are relevant to the analysis based on work roles, age, technical expertise, geographic area, or other criteria.
Contacting stakeholders: Ideally, contact of potential stakeholders should take place through the contact preferences of that stakeholder. If the ongoing contact will be through a particular social network, then the initial contact should take place through that channel. [5]
Interviewing stakeholders: Interviews should take place in the preferred medium of the stakeholder and should be informed by the level of detail involved in the interview, but not at the expense of the requirements gathering process []. A detailed discussion of technical requirements is not especially suitable for Twitter. Formats for detailed discussions might include email, Skype, and conventional phone calls. Many of these media facilitate convenient logging either in email or chat trails or even audio recordings.
Summarizing emergent requirements: Many requirements analysis tools can serve as points of aggrega-tion of data. Some tools, like Review Center, provide a framework for eliciting feedback on requirements through social media channels. [6]
Passive monitoring: The candidate’s Twitter activity is monitored, collected and analyzed to provide real-time context for more active monitoring, possibly as a basis to trigger follow-up inquiries. Although permission is not technically required, it is highly recommended that the candidate’s permission be obtained., they be given access to all data gathered and they have the ability to delete this data. The purpose of this monitoring is
Active monitoring: This includes incident reporting or journaling and interactive, flash” interviews. With incident reporting, the candidate fills out the details of their incident response through an online form or mobile app. The NIST team is notified of the report and may follow-up. Alternatively, they may contact the candidate based on their monitored Twitter activity.
Summarizing job functions: It is important to study how first responders actually do their jobs; following candidates around discovers what they actually do based on their reporting and passive analysis of their activities.
Identifying emergent requirements: This corpus of observations about first responders job functions, collected through passive and (inter)active monitoring, is the context from which gaps in performance, efficiency or safety can be identified (by the candidate or through inference) and forms the basis for detailed, focused requirements gathering.
Online surveys: Online surveys provide a means to quickly get feedback on a range of issues. They can be informal (through an open invitation) or scientific (inviting a pre-selected cadre to participate), de-pending on the need. A number of tools are available for conducting surveys, including SurveyMonkey, Google Docs, and RedCap. A model survey, First Responders Requirements Methodology Survey, was constructed using Google docs, making the distribution (by linking), collection of results, and analysis easy.
Ideas bank: An “ideas bank” is a structured portal in which stakeholders work collaboratively to contribute and develop ideas. They are relatively easy to construct; at a minimum a collaborative editing platform such a Wiki is needed. One example ideas bank has been developed for OpenDNS, where users submit, comment and vote on ideas about how it should evolve. [4] The objective is to bring stakeholders together to share, build on and refine each others ideas and grow their collaboration network based on their common interests. An exemplary ideas bank is maintained by the OpenDNS community where users submit, comment and vote on ideas about how it should evolve. [4]
Social media aggregation services: The expansion of the number and scale of social media sites has led to the development of social media aggregation tools which collect data from multiple social media sites and pulls them together for analysis. These tools may save effort in building a broader view of the social media landscape by providing a single point of access for many social media platforms. An additional benefit is that these aggregation sites are becoming the only place analysts can gain access to the entire Twitter stream.
5
Future Work
Our current visualization tools represent methods of passive monitoring in order to find current topics of conversation among first responders on Twitter. We are working on adding user information as well - namely which users are most active on pertinent hashtags - with the idea that those users who are highly involved in relevant conversations are stakeholders in the community.
Additionally, as Twitter is a rapidly-changing environment, we also plan to enable methods to time-filter our visualizations. This will not only shed light on the topics and users discussing them at a particular moment, but also enables us to study how those conversations shift over time.
Finally and significantly, we recognize that monitoring common tags is a simplistic approach to monitoring the Twitter ”firehouse,” and that a more comprehensive and durable approach should consider all text in a message and should reconcile similar words (possibly due to errors).
6
Acknowledgements
Our thanks to the Law Enforcement Standards Office (OLES) of the U.S. National Institute of Standards and Technology (NIST) for sponsoring this work, and members of the DHS First Responders Communities of Practice Virtual Social Media Working Group (VSMWG) for numerous helpful discussions.
References
[1] Eytan Bakshy, Jake M Hofman, Winter A Mason, and Duncan J Watts. Everyone’s an influencer: quantifying influence on twitter. In Proceedings of the fourth ACM international conference on Web search and data mining, pages 65–74. ACM, 2011.
[2] US Army Combined Arms Center. Appendix H: First Responder Categories and Capabilities. http: //usacac.army.mil/cac2/call/docs/06-08/ap-h.asp, [Last accessed: 26/04/2013], 2006.
[3] First Responders Group First Responder Communities of Practice Program and Department of Home-land Security Virtual Social Media Working Group. First Responder Communities of Practice Vir-tual Social Media Working Group Community Engagement Guidance and Best Practices. https: //www.hsdl.org/?view&did=722650, [Last accessed: 26/02/2013].
[4] OpenDNS. OpenDNS Community ¿ Idea Bank ¿ Fresh Ideas. http://ideabank.opendns.com/, [Last accessed: 26/02/2013].
[5] Ovum. Maximizing Customer Value with Proactive Outbound Contact: How to reach out to customers in ways that delight them. http://voxeo.com/wp-content/uploads/2012/12/ OvumWhitePaper-Outbound-May2012.pdf, [Last accessed: 26/02/2013], 2012.
[6] Jama Software. Review Center Datasheet. http://www.jamasoftware.com/media/documents/Jama_ Review_Center_Datasheet.pdf, [Last accessed: 26/02/2013].