Study on Tensile Strength of SS304 Steel Weld Joint with Different Bevel Angles
by
Abu Bakar Sidiq bin Mohd Ismail 15041
Dissertation submitted in partial fulfillment of the requirements for the
Degree of Engineering (Hons) (Mechanical)
January 2015
Universiti Teknologi PETRONAS, 32610 Bandar Seri Iskandar, Perak Darul Ridzuan.
i
CERTIFICATION OF APPROVAL
Study on Tensile Strength of SS304 Steel Weld with Different Bevel Angles
by
Abu Bakar Sidiq bin Mohd Ismail 15041
A project dissertation submitted to the Mechanical Engineering Programme
Universiti Teknologi PETRONAS in partial fulfillment of the requirement for the
BACHELOR OF ENGINEERING (Hons) (MECHANICAL)
Approved by,
______________________________. (DR SRINIVASA RAO PEDAPATI)
UNIVERSITI TEKNOLOGI PETRONAS 32610, BANDAR SERI ISKANDAR, PERAK
ii
CERTIFICATION OF ORIGINALITY
This is to certify that I am responsible for the work submitted in this project, that the original work is my own except as specified in the references and acknowledgements, and that the original work contained herein have not been undertaken or done by unspecified sources or persons.
___________________________________. ABU BAKAR SIDIQ BIN MOHD ISMAIL
iii
ACKNOWLEDGEMENT
I would like to express my deepest appreciation to all those who provided me the possibility to complete this report. A special gratitude I give to my final year project supervisor, Dr Srinivasa Rao Pedapati whose contribution in stimulating suggestions and encouragement helped me to coordinate and execute my project.
Furthermore I would also like to acknowledge with much appreciation the crucial role of the technicians from block 16, 17 and 21, who gave the permission to use all required equipment and the necessary materials to complete the project and for teaching me the proper method to use the equipment.
I would also like to express my gratitude to my poster examiner, Dr Ainul Akmar Binti Mokhtar who gave comments on how to improve the project. Last but not least, many thanks go to my family who has been giving full support in order to finish the project that took two semesters.
iv
ABSTRACT
Welding is one of the most universal type of joining method used in the industry especially oil and gas industry. Good welding of pipe is crucial as bad welding can lead to cracks and failures. One of the parameter that affects the quality of weld is the bevel angle for single V butt joint weld. This paper aims to analyse the effect of different included bevel angle of SS304 stainless steel pipe weld. Simulation was performed in ANSYS which showed that 50 degree bevel angle is the optimum bevel angle for single V butt joint for SS304 steel with 13mm thickness. To verify the simulation result, experiment was performed. The type of welding process that was used to perform the weld was Gas Tungsten Arc Welding (GTAW), also known as Tungsten Inert Gas (TIG) welding. The SS304 stainless steel was first sectioned and milled in order to achieve different bevel angle before being welded using TIG welding and machined again in order to perform tensile test. Tensile test was performed according to ASTM E8 standard in order to determine the strength of the welded pipe. Based on the values obtained from the tensile test such as Yield Strength and Ultimate Tensile Strength (UTS), the optimum bevel angle for single V butt joint is 50 degree.
v TABLE OF CONTENTS CERTIFICATION OF APPROVAL ... i CERTIFICATION OF ORIGINALITY ... ii ACKNOWLEDGEMENT ... iii ABSTRACT ... iv
LIST OF FIGURES ... vii
LIST OF TABLES ... viii
CHAPTER 1: INTRODUCTION ... 1
1.1 Background Study ... 1
1.2 Problem Statement ... 2
1.3 Objectives ... 3
1.4 Scope of Study ... 3
CHAPTER 2: LITERATURE REVIEW ... 4
2.1 Tungsten Inert Gas (TIG) Welding Process ... 4
2.2 Bevel Angle of Butt Joint ... 5
2.3 Tensile Test ... 7
2.4 Stainless Steel SS304 ... 9
CHAPTER 3: METHODOLOGY ... 10
3.1 Research Methodology ... 10
3.2 Project Workflow ... 11
3.3 FYP Gant Charts ... 12
3.4 ANSYS Modeling ... 13
3.4.1 Test Matrix ... 13
3.4.2 Define element type ... 13
3.4.3 Define material properties ... 14
3.4.4 Boundary Conditions ... 14 3.4.5 Modeling ... 14 3.4.6 Meshing ... 16 3.4.7 Applying Load ... 17 3.4.8 Solve ... 17 3.5 Experiment Methodology ... 18 3.5.1 Sample Preparation ... 18
vi
CHAPTER 4: RESULT & DISCUSSION ... 26
4.1 Simulation Result ... 26
4.1.1 Stress in X direction (axis of force applied) ... 26
4.2 Experimental Result ... 28
4.2.1 Welding Result ... 28
4.2.1 Tensile Test Result for 30 Degree Bevel Angle Samples. ... 29
4.2.2 Tensile Test Result for 40 Degree Bevel Angle Samples. ... 30
4.2.3 Tensile Test Result for 50 Degree Bevel Angle Samples. ... 31
4.2.4 Tensile Test Result for 60 Degree Bevel Angle Samples. ... 32
4.2.5 Tensile Test Result for 70 Degree bevel Angle Samples. ... 33
4.3 Simulation Discussion ... 35
4.4 Ultimate Tensile Strength (UTS) Discussion ... 36
4.5 Yield Stress Discussion ... 38
CHAPTER 5: CONCLUSION AND RECOMMENDATION ... 40
5.1 Conclusion ... 40
5.2 Recommendation ... 41
vii
LIST OF FIGURES
FIGURE 2.1. TIG welding process. ... 4
FIGURE 2.2. Types of butt joints. ... 5
FIGURE 2.3. Standard welding preparation for single V butt weld according to American Welding Society. ... 6
FIGURE 3.1. 50 degree bevel angle model. ... 15
FIGURE 3.2. Fully Meshed 50 degree bevel angle model. ... 16
FIGURE 3.3. Dimension of SS304 plate as supplied by TSA Industries. ... 18
FIGURE 3.4. Horizontal hand saw machine. ... 18
FIGURE 3.5. Milling process to create angled plate. ... 19
FIGURE 3.6. Back surface of welded plate showing full penetration. ... 21
FIGURE 3.7. Front surface showing good weldment. ... 21
FIGURE 3.8. Tensile test Specimen cut from work piece using EDM wire cutting machine. ... 22
FIGURE 3.9. Tensile Specimen milled using manual milling machine. ... 23
FIGURE 3.10. Dimension of final tensile test specimen. ... 23
FIGURE 3.11. Sample fracture after tensile test... 25
FIGURE 4.1. Stress in X direction (axis of force applied) for model having 30º, 40º, 50º, 60º and 70º bevel angle respectively. ... 26
FIGURE 4.2. Incomplete penetration for 30 degree sample. ... 28
FIGURE 4.3. Full penetration for 40 degree sample. ... 28
FIGURE 4.4. Stress versus strain graph for 30 degree first sample. ... 29
FIGURE 4.5. Stress versus strain graph for 30 degree second sample. ... 29
FIGURE 4.6. Stress versus strain graph for 40 degree first sample. ... 30
FIGURE 4.7. Stress versus strain graph for 40 degree second sample. ... 30
FIGURE 4.8. Stress versus strain graph for 50 degree first sample. ... 31
FIGURE 4.9. Stress versus strain graph for 50 degree second sample. ... 31
FIGURE 4.10. Stress versus strain graph for 60 degree first sample. ... 32
FIGURE 4.11. Stress versus strain graph for 60 degree second sample. ... 32
FIGURE 4.12. Stress versus strain graph for 70 degree first sample. ... 33
FIGURE 4.13. Stress versus strain graph for 70 degree second sample. ... 33
FIGURE 4.14. Maximum stress in X axis versus bevel angle chart. ... 35
FIGURE 4.15. Ultimate Tensile Strength versus bevel angle chart. ... 36
viii
LIST OF TABLES
TABLE 2.1. Standard welding preparation for single V butt weld according to
American Welding Society. ... 6
TABLE 2.2. Specimen dimensions for tensile test according to ASTM A370 ... 8
TABLE 2.3. The chemical compositions of SS304 based on ASM data sheet. ... 9
TABLE 2.4. The mechanical properties of SS304 based on ASM data sheet. ... 9
TABLE 3.1. FYP I Gantt chart. ... 12
TABLE 3.2. FYP II Gantt chart. ... 12
TABLE 3.3. Test matrix... 13
TABLE 3.4. Material properties. ... 14
TABLE 3.5. Variables for each model... 15
TABLE 3.6. Number of passes. ... 20
TABLE 3.7. Thickness and width of tensile test sample. ... 24
TABLE 4.1. Maximum stress sustained in X axis. ... 27
TABLE 4.2. Summary of Ultimate Tensile Strength. ... 34
1
CHAPTER 1: INTRODUCTION
1.1 Background Study
Welding is the joining of materials by means of heat and/ or force with or without filler metal. It is a manufacturing process that is widely used in many industries. In fact, welding is the only manufacturing process that has been used and applied in air, underwater and space [1]. One of the popular types of welding process is Tungsten Inert Gas (TIG) welding. TIG welding is widely used as one of the top choice of welding in fabrication industries, steel construction, maintenance and repairs. One of the reasons is the simplicity of TIG process.
TIG is a type of arc welding wherein the weld is produced by using the heat produced by the arc between non consumable tungsten electrode and weld pool [2]. Inert gas such as argon, nitrogen, helium, hydrogen or combination of those gaseous is also supplied to provide shielding of the electrode, molten weld pool and solidifying metal from atmospheric contamination during welding. Weld filler is used in order to weld the two metals together. The weld filler will melt due to the arc which will also melt the parent metal and fuses with the molten filler metal to form weldment.
However, welding on pipe can become problematic if not done properly. There are many parameters that affect the strength of the weld. Murugan and Gunaraj [3] studied the effect of welding parameters such as welding speed, welding current, plate thickness and welding voltage on the weld penetration and width. However, the geometry of the weld is also affected by the geometry of the pipe. Single V butt weld which is widely used for SMAW welding of pipe in oil and gas industry is affected by the bevel angle of the single V butt joint. However, not many researchers have been done on groove parameters like bevel angle in single V butt weld [4]. Mahendramani [4] did a research closely related to groove angle and he concluded that angle in single V butt weld has a major effect on shrinkage of a metal and thus affecting the strength of the metal.
2
1.2 Problem Statement
One of the first welding processes a welder learns is Tungsten Inert Gas (TIG) welding. TIG welding requires filler metal since the tungsten electrode does not melt during the welding process. However, producing good weld is not easy. According to Kim et al. [5], producing good weld depends on the knowhow and long term experience. Trial and error is often used in order to achieve good weld.
Poor welding work will result in failure of the plate such as crack on the weldment area which can lead to fracture and can be catastrophic. Weld that fail to attain standard during inspection will have to be welded again which is very costly. Some of the welding defects that are common in welding are porosity, wed splatter, poor fusion, shallow penetration and cracking which are due to poor welding parameters [6]. Murugan and Gunaraj [3] also explained the effects of welding parameters to the quality of weld. In oil and gas industry, metal pipes are widely used to transport products and these pipes are welded together by welding processes such as TIG on single V butt weld.
One of the parameters that affect the strength of weld is bevel angle in butt weld [4]. A small bevel angle can cause not enough fusion between the parent metal thus low strength and the filler metal while a big bevel angle can be costly. Thus, this research aims to analyse the effect of bevel angle in butt welded joint through TIG welding process. In order to determine the strength of the weld, tensile test according to ASTM A370 [7] will be performed on the welded plate.SS304 stainless steel plate will be used in this study; however, the result from this study can be applied on SS304 stainless steel pipe which is used widely in oil and gas industry.
3
1.3 Objectives
The main objectives of this research are as follows:
To perform structural simulation using ANSYS on SS304 plate to determine the optimum bevel angle
To determine the tensile strength of single V butt welded SS 304 stainless steel with different bevel angles through experiment
To determine the optimum bevel angle for single V butt welded SS304 plate by validating the simulation with experiment results
1.4 Scope of Study
This research will cover simulation and experiment. The simulation only involves application of force on welding model; while the welding covers the TIG welding process on SS 304stainless steel plate and tensile test. The type of joint for the welding will be single V butt joint since double V butt joint is used for thicker metals. The only welding parameter that will be manipulated is the bevel angle of the metal to be welded (parent metal). The rest of the parameters will be kept constant in order to achieve good result. Tensile test according to ASTM A370 will be performed in order to analyze the strength of the weld. Tensile test specimen will be taken from welded SS304 plate using EDM wire cutting process.
4
CHAPTER 2: LITERATURE REVIEW
2.1 Tungsten Inert Gas (TIG) Welding Process
Gas tungsten arc welding (GTAW) or also known as tungsten inert gas (TIG) welding is a type of welding that uses a non-consumable tungsten electrode to produce weld as shown in Figure 2.1. Inert shielding gas is supplied to the weld area during welding to protect the weld from atmospheric contamination. Filler metal is normally used during TIG welding. Electric current produces arch between the tungsten electrode and the base metal which melts the base metal as well as the filler metal to produce weld.
5
2.2 Bevel Angle of Butt Joint
A welding joint is the area where the two pieces to be welded is joined together. One of the types of joint is butt joint. Butt joint itself can be broken down to many types and one of them is single V butt. Single V butt joint is used for relatively thinner materials since full penetration is not possible with thicker materials. For thicker materials, double V butt joined is used. Some other types of butt joints are square, closed square, single-bevel, single J, double bevel, double J, single U, double U, flange, tee and flare. The type of butt weld selection depends on certain parameters such as size of the plate to be joined and position of the weld as shown in Figure 2.2.
FIGURE 2.2. Types of butt joints [9].
The welding of the single V butt weld followed American Welding Society (AWS) [10]. This was done so that the welding process will follow a recognized standard. AWS specifies the geometry of the welding plate and thus can be used for this project. As stated earlier, the type of welding process chosen is TIG welding process and based on the Table 2.1, the geometry for butt joint under TIG welding process can be selected. Basically, it should be the same for TIG and MIG welding. The thickness of the base metal is unlimited and the root gap is from 0 to 3. The root gap selected for this research is 2 which are within the limit given by AWS.
6
TABLE 2.1. Standard welding preparation for single V butt weld according to American Welding Society [10].
AWS however does not discuss the effect of angle for single V joint. According to Murugan and Gunaraj [3] welding parameters can greatly affect the weld bead geometry such as weld penetration and width. This geometry can affect the strength of the weld. Murugan and Gunaraj [3] concluded that with increasing voltage, the width of the weld increases but the penetration of the weld decreases. However, they did not study the effect of angle of single V butt joint.
FIGURE 2.3. Standard welding preparation for single V butt weld according to American Welding Society [12].
7
Hamin [11] studied the effect of different bevel angles on the residual stress of the weld. The type of welding process for the research by Hamin is similar to this research which is TIG process. Hamin concluded that the included bevel angle of single V butt weld affects the integrity of the weld joint in terms of the residual stress, distortion and the temperature profile of the weld. His paper also concluded that the optimum included bevel angle was 40 degree for A36 steel with 20mm of thickness and 70mm of width since it produced the least amount of distortion and residual stress. The current research on the other hand will determine the optimum bevel angle for single V butt joint in terms of the tensile strength of the weld by performing weld on metal with different bevel angle and later on performing the tensile test on the weld metal based on ASTM standard.
2.3 Tensile Test
Tensile test is one of the important destructive testing whereby the material is subjected to control tensile until the material fractures and fails. Since tensile test is a destructive test, the material that has undergone tensile test will no longer be useful for application. When a material is under tension, the material will elongate and the thickness or radius of the material will be reduced. From these measurements and the value of the load that is used to stretch the material, a few important properties of the material can be obtained such as Young’s Modulus of elasticity, Poisson’s ratio, yield strength and ultimate tensile strength. Yield strength and ultimate tensile strength (UTS) are important properties in the design of pipes.
The tensile test will follow the ASTM standard. ASTM A370 [7] will be used for this research. This is due to the fact that ASTM standard is a widely recognized standard and is widely used in the oil and gas industry. The sample for tensile test must follow the dimension specified by ASTM. Basically, there are 3 types of specimen that can be selected for tensile test based on ASTM A370 which are standard specimen plate type, standard specimen sheet type and sub size specimen. For this research, sub size specimen is selected. The dimensions for sub size specimen as well as plate and sheet type are shown in Table 2.2 according to ASTM A370.
8
9
2.4 Stainless Steel SS304
Table 2.3 and Table 2.4 show the chemical composition and mechanical properties of SS304 respectively. Stainless steel is a form of steel containing a minimum of 10.5% chromium content that gives resistance to tarnishing and rust. It is also known as inox steel. It is a T300 Series Stainless Steel austenitic with minimum 18% Chromium and 8% Nickel combined with maximum 0.08% Carbon. There are three grades of type 304 stainless steel which are SS304, SS304L and SS304H. Grade 304L is the low carbon version of 304 which does not require post-weld annealing whereas grade 304H is the high carbon version of 304 which is highly applicable at elevated temperatures.
TABLE 2.3. The chemical compositions of SS304 based on ASM data sheet [13].
Grade Carbon Manga -nese
Silica Phospho -rus
Sulfur Chromium Nickel
304 Max 0.08 Max 2.0 Max 1.0 Max 0.045 Max 0.03 18.0 – 20.0 8.0 – 10.5 TABLE 2.4. The mechanical properties of SS304 based on ASM data sheet [13].
Grade Tensile strength (MPa) Yield strength (MPa) min Rockwell Hardness (HR B) max Brinell Hardness (HB) max 304 505 215 70 123 Other characteristics of SS 304:
Forming and welding properties
Corrosion/oxidation resistance due to chromium content
Deep drawing quality
High toughness
10
CHAPTER 3: METHODOLOGY
3.1 Research Methodology
The research methodology can be divided into three main parts;
1) Supervisor Consultation.
Supervisor is one of the main sources of reference for the project especially when there is a problem that requires expert clarification. Consultation with supervisor is also required during understanding the equation and principles related to shielded metal arc welding (SMAW).
2) Developing ANSYS model, meshing and applying load
To validate the experimental result, simulation of the experiment needs to be performed in ANSYS FLUENT. The simulation starts with modeling of 5 models, each model having different bevel angles according to the test matrix. Next, the models are meshed and lastly, the load is applied, in this case, force. The simulation is solved and the result is analysed.
3) Learning and performing SMAW process
Since the experiments will be involving many runs of SMAW welding, thus it is necessary to learn how to perform TIG welding. This reason is due to the fact that technicians are sometimes busy with other work and thus the welding needs to be done by the student.
4) Performing tensile test on welded specimen
Before tensile test can be performed on the specimen, the specimen must be first welded and then machined according to the dimension specified by ASTM standard. Only after the specimen complies with the dimension stated in ASTM standard can the result from tensile test be accepted as legit result. Mechanical properties will be obtained from the tensile test.
11
3.2 Project Workflow
Project background study and literature review Develop test matrix
Perform ANSYS modeling and meshing
Analyse simulation result
Sample preparation
Conduct TIG welding process
Machining the welded specimen (sample preparation)
Perform tensile test
Applying load on each meshed models
Analyse tensile test result Start
End
Technical report writing Experiment validates
simulation?
Yes
12
3.3 FYP Gant Charts
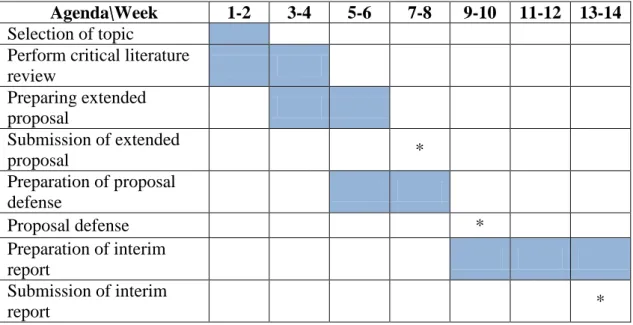
TABLE 3.1. FYP I Gantt chart.
Agenda\Week 1-2 3-4 5-6 7-8 9-10 11-12 13-14
Selection of topic
Perform critical literature review Preparing extended proposal Submission of extended proposal * Preparation of proposal defense Proposal defense * Preparation of interim report Submission of interim report * * Key milestone
TABLE 3.2. FYP II Gantt chart.
Agenda\Week 1-2 3-4 5-6 7-8 9-10 11-12 13-14
Purchasing materials Perform milling process to form the angles and conduct welding process Wire cutting process according to tensile specifications Preparation and submission of progress report * Conduct tensile testing
Pre-sedex presentation *
Analyze data from tensile testing
Ansys modeling and meshing and apply load. Analyse result from Ansys Submission of technical paper * Preparation and submission of final dissertation * * Key milestone
13
3.4 ANSYS Modeling
3.4.1 Test Matrix
The test matrix developed is shown in Table 3.3. Welding will be performed based on the metal with different bevel angle as shown in Table 3.3. The root gap of the butt joint will be kept constant at 2mm. The thickness of the sheet is ½ inch which is the common thickness of plates and pipes. The bevel angles selected are 30 , 45 , 60 , and 75 . The angles are selected based on previous research by Hamin (2013). Most common bevel angle used for single V butt joint is 60 . Thus 60 bevel angle is also selected in the test matrix.
TABLE 3.3. Test matrix.
Bevel angle Root Gap, mm
30 2
2
50 2
60 2
70 2
3.4.2 Define element type
The first step is to select a reliable element type to perform structural analysis. Element type Sloid 185 has been selected since it is used for 3D modelling of solid structures. Sloid 185 is defined by 8 nodes, having 3 degrees of freedom at each node, that is in x, y and z directions.
14
3.4.3 Define material properties
There are several material properties that need to be defined for the models. Each model is made up of SS304 steel as the parent metal and SS308L for the weld metal. There are 3 important parameters hat needs to be defined for each model, modulus of elasticity, Poisson ratio and density for both parent metal and weld area. The Table 3.4 shows the properties of the two materials.
TABLE 3.4. Material properties [13].
Material SS304 SS308L
Modulus of elasticity, GPa 193 210
Poisson ratio 0.29 0.3
Density, kg/m3 8000 8000
3.4.4 Boundary Conditions
One end of the metal plate will have zero displacement in all directions, which means it will be clamped. Force will be applied on the other end to pull the metal plate.
3.4.5 Modeling
To creating the geometry of the model, there were 3 volumes created, first and second volumes are the parent metal and both are identical and should have the properties of SS304. Volume 2 is the weld area and consist of filler metal thus will have the properties of SS308L which is in fact the filler used in the real experiment. The dimensions of the model are highlighted in Table 3.5. Each model has the same thickness, 13mm, and the total width of the plate is 50mm while the length is 100mm. The modeling started with creating key points, followed by area from key points and lastly extruding the area in normal directions to create volumes. The final model for 50 degree bevel angle can be seen in Figure 3.1. The 3 volumes were joined using the glue option in ANSYS.
15
TABLE 3.5. Variables for each model.
Bevel Angle Root face, f (mm) Root Gap, R (mm)
30 3 2
40 3 2
50 3 2
60 3 2
70 3 2
16
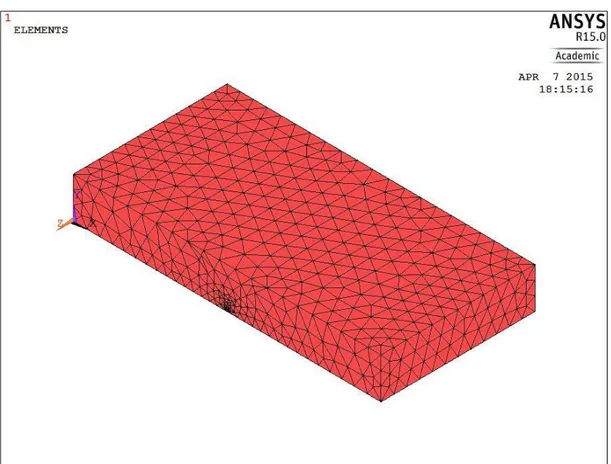
3.4.6 Meshing
Meshing is performed in ANSYS to represent field variables such as displacement by polynomial function that produces a displacement field compatible with applied boundary conditions. The size of the mesh has significant effect of the final result of the simulation, thus the size of the mesh was kept constant for all models. During meshing, the type of material properties was defined for each volume. Volume 1 and 2 were assigned to material 1 which has the properties of SS304 steel, while volume 3 was assigned material 2 which has the properties of SS308L. A fully meshed model can be seen in Figure 3.2.
17
3.4.7 Applying Load
The only load in this simulation is force. Force is applied on one end of the plate. The amount of force applied was 50% of the force at Ultimate Tensile strength of SS304. The value of force applied was 2930803.5715 kN.
3.4.8 Solve
The solve command was used to initiate solving of the simulation. Solve was initiated after the model was meshed, boundary conditions defined and load has been applied. The amount of time required for solve depends on the complexity of the model and the load applied.
18
3.5 Experiment Methodology
3.5.1 Sample Preparation
Before the metal plate can welded, the metal plate has to go through sample preparation. The original dimension of the plate as supplied by the supplier is shown in Figure 3.3.
60 mm
250 mm
FIGURE 3.3. Dimension of SS304 plate as supplied by TSA Industries.
3.5.1.1 Sectioning
The first process is cutting or sectioning the metal plate as shown in Figure 3.4. The SS304 plate is cut in half producing 2 identical plates with dimension of 125 mm X 60 mm. This process is performed using Horizontal Band Saw machine. Lubricants were supplied through the process in order to minimize the heat generation during cutting which can affect the properties of the metal plate. The speed of depth of the hand saw machine was also set at minimum since stainless steel plate is a hard material compared to carbon steel and aluminum thus the speed of depth needs to be slow to prevent excess heat generation and machine failure. Sectioning one metal plate took more than 10 minutes.
19
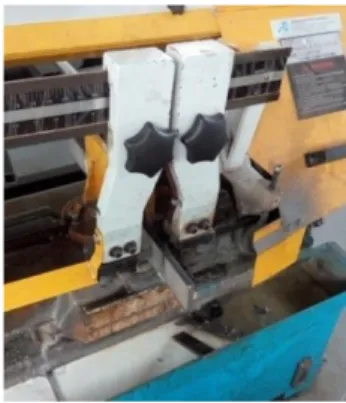
3.5.1.2 Milling bevel angle
After the metal plate has been sectioned, the side of the plate needs to be milled to produce bevel angle. The single V butt joint bevel angle has been milled according to test matrix. Manual milling machine has been used to introduce bevel angle. A root length of 3mm has been selected for each plate. Since manual milling machine by default is only able to mill flat surface thus to introduce angle to the metal plate, a special part known as angle plate is used. Figure 3.5 shows angle plat fixed to the table of the milling machine. The angle of the metal plate (SS304) to be milled can be changed by loosening the screw of the angle plate and selecting the desired angle based on the matrix.
20
3.5.1.3 TIG welding process
After the SS304 plates have been milled according to test matrix, 2 identical plates in terms of bevel angle are welded using Tungsten Inert Gas (TIG) welding process. The current selected for the TIG welding process is 150 A. The current is high due to the fact that the metal plates are thick (13mm) thus more current is required in order to melt and fuse filler metal and parent metal together.
In terms of the number of passes, for small bevel angle such as 30 , a single pass is sufficient to cover the single V butt joint. However, for large bevel angle, multiple passes were required in order to sufficiently weld the two metal plates together. Table 3.6 shows the number of passes for each bevel angle.
TABLE 3.6. Number of passes.
Bevel Angle Number of passes
30 1
1
50 1
60 3
70 3
Deformation of the plate was noticed after the plates were welded together. This is due to the heat generated during welding. One of the most important aspects during welding is to ensure that the weld fully penetrates the weld plate. Only plate with 30 included angle did not achieved full penetration of weld. This is because the angle was too small, thus the space was not enough for the tungsten electrode to fully melt the parent metal and filler rod. The penetration can still be increased by using a wider root gap but this is not plausible for plate with 30 since 2mm root gap has already been used which is very big. Figure3.6shows back of the welded metal plate which has been fully penetrated which is the case for all metal plates except for 30 . Figure 3.7 shows the front face of a good welded plate which is the case for the entire test matrix. The color around the welded region shows the heat affected zone.
21
FIGURE 3.6. Back surface of welded plate showing full penetration.
22
3.5.1.4 Cutting tensile test specimen from welded plates
The two plates welded together needs to be machined again (cut) in order to perform tensile test. The dimension of the samples needs to be machined is according to ASTM A307 [7]. The dimension according to ASTM A307 can be found in the literature review. The machine used to cut the tensile specimen from welded plates is Electrical Discharge Machining (EDM) wire cutting machine. In EDM wire cutting, electrical discharge is used to create sparks to cut the sample. The spark is created underwater, between the work piece and the wire that cuts the work piece.
The EDM wire cutting machine produces very high quality products since it is precise because it uses AutoCad 2004. A model of the sample that needs to be cut from the work piece needs to be modeled in AutoCad 2004 which is connected to the machine. The model follows the dimension as per ASTM A370. Tensile test specimen as cut from work piece using EDM wire cutting machine is shown in Figure 3.8.
FIGURE 3.8. Tensile test Specimen cut from work piece using EDM wire cutting machine.
23
This specimen however is still not complying with ASTM A370 due to the thickness. The thickness of the specimen cut using EDM wire cutting is 13 mmm whereas according to ASTM A370, the maximum thickness of the specimen for tensile testing for sub size specimen can only be 6 mm. Therefore, milling machine is used to reduce the thickness of the specimen. Simple horizontal milling is done on the specimen to reduce the thickness of the specimen from 13 mm to 6 mm. One of the specimens that have been milled is shown in Figure 3.9. The dimension is shown in Figure 3.10.
FIGURE 3.9. Tensile Specimen milled using manual milling machine.
24
3.5.1.5 Tensile Test
Tensile test will be performed on each of the sample that has been welded and machined according to ASTM A307 [7]. The tensile test will also follow ASTM A307 standard. Tensile test machine will be used to apply load on the sample until it fractures. The load will cause the sample to be under tensile stress and elongate. The value of stress versus strain will be plotted in order to determine the mechanical properties of the sample that has been welded such as the yield stress and ultimate tensile strength.
Before tensile test can be performed, 5 thickness reading and 5 width reading of the gauge area needs to be measured and the average needs to be calculated for each sample as shown in Table 3.7. The thickness of the gauge area of each sample was measured using micrometer screw gauge while the width was measured using Vernier caliper. Both of the equipment gave automatic reading.
TABLE 3.7. Thickness and width of tensile test sample.
Sample Label Mean Thickness, mm Mean Width, mm
30 (1) 5.3338 5.924 30 (2) 6.0068 5.972 40 (1) 5.5048 5.828 40 (2) 6.5804 5.936 50 (1) 5.8020 5.976 50 (2) 6.0660 5.832 60 (1) 5.5370 5.844 60 (2) 5.6970 5.730 70 (1) 4.9140 5.810 70 (2) 5.1690 5.684
25
3.5.1.6 Result Analysis
The final step of the project is to analyze the tensile test result obtained from sample with different bevel angle. The properties obtained from tensile test will be analyzed and optimum bevel angle for single V butt joint weld for ASTM A106 Grade B pipe will be determined. Figure 3.11 shows the fracture of the sample after tensile test has been performed.
26
CHAPTER 4: RESULT & DISCUSSION
The result is divided into the result for simulation and experiment.
4.1 Simulation Result
4.1.1 Stress in X direction (axis of force applied)
FIGURE 4.1. Stress in X direction (axis of force applied) for model having 30º, 40º, 50º, 60º and 70º bevel angle respectively.
27
The simulation is performed in ANSYS FLUENT in order to validate the result of the experiment performed. The simulation performed is structural simulation whereby force is applied on each model having different bevel angle. The value of force applied on every model is the same in order to determine the model sustaining the least amount of stress. Figure 4.1 shows the graph representation of the stress sustained for each model in the X axis. The stress in X direction is important as each model is subjected to each model only in the +X direction to simulate the real tensile test performed which also subjects the sample with force in on direction.
Apart from the graphical representation of the stress sustained in the X axis, ANSYS also gives the option to read the result in table form whereby the stress sustained on each node is shown. This is important as the maximum stress sustained by the model can be determined from the data. Table 4.1 shows the maximum stress sustained in X direction for each model.
TABLE 4.1. Maximum stress sustained in X axis.
Model Type Maximum Stress sustained, X axis, MPa
30 degree model 892.90
40 degree model 773.77
50 degree model 659.62
60 degree model 927.09
28
4.2 Experimental Result
4.2.1 Welding Result
Not all plates that were welded showed good weldment. 30 degree bevel angle plate did not achieve full penetration. The root area was not welded and remained empty. The filler metal did not reach the root area and the electrode was not able to reach deep enough to melt the parent metal and filler metal to fill in the root area. Figure 4.2 shows the tensile sample cut from 30 degree bevel angle plate showing incomplete penetration. This shows that 30 degree bevel angle is insufficient for full penetration. The rest of the bevel angle samples showed full penetration. For instance, Figure 4.3 shows sample cut from plate welded with 40 degree bevel angle showing full penetration.
FIGURE 4.2. Incomplete penetration for 30 degree sample.
29
4.2.1 Tensile Test Result for 30 Degree Bevel Angle Samples.
FIGURE 4.4. Stress versus strain graph for 30 degree first sample.
FIGURE 4.5. Stress versus strain graph for 30 degree second sample.
The Figure 4.4 and 4.5 show the tensile test result for 30 degree bevel angle. Both graph shows almost similar result for ultimate tensile strength. The first tensile test sample shows 514.76 MPa ultimate tensile strength while the second shows 499.152 MPa for ultimate tensile strength. Apart from UTS, another important result that can be obtained from Stress versus strain is yield stress. The first sample gives yield stress of 320.599 MPa while the second gives yield stress of 274.634 MPa. Both yield stress are taken at 0.02% offset.
30
4.2.2 Tensile Test Result for 40 Degree Bevel Angle Samples.
FIGURE 4.6. Stress versus strain graph for 40 degree first sample.
FIGURE 4.7. Stress versus strain graph for 40 degree second sample.
The tensile test result for sample with bevel angle of 40 degrees is shown in Figure 4.6 and Figure 4.7. Basically, for each bevel angle, two samples were taken and tensile test were performed on the two tensile test samples. The first sample result shows ultimate tensile strength of 594.95 MPa while the second sample shows ultimate tensile strength of 598.429 MPa. The yield stress for the first sample is 342.821 MPa while the second sample shows yield stress of 330.544 MPa. Both yield stress are taken at 0.02% offset.
31
4.2.3 Tensile Test Result for 50 Degree Bevel Angle Samples.
FIGURE 4.8. Stress versus strain graph for 50 degree first sample.
FIGURE 4.9. Stress versus strain graph for 50 degree second sample.
Figure 4.8 shows the stress versus strain for the first sample for 50 degree bevel angle stainless steel plate while Figure 4.9 shows the graph for the second sample from the same plate for the same bevel angle. The first sample gives ultimate tensile strength of 633.512 MPa while the second sample gives ultimate tensile strength of 637.191 MPa. The yield stress for the first sample is 380.683 MPa while the second sample gives yield stress of 390.699 MPa.
32
4.2.4 Tensile Test Result for 60 Degree Bevel Angle Samples.
FIGURE 4.10. Stress versus strain graph for 60 degree first sample.
FIGURE 4.11. Stress versus strain graph for 60 degree second sample.
Figure 4.10 shows the stress versus strain graph for SS304 plate welded with 60 degree bevel angle first sample while Figure 4.11 shows the stress versus strain for the second sample from the same plate. The ultimate tensile strength for the first sample is found to be 615.557 MPa while the ultimate tensile strength for the second sample is 614.72 MPa. The 0.2% offset yield stress for the first sample is 367.58 MPa and 366.061 MPa for the second sample.
33
4.2.5 Tensile Test Result for 70 Degree bevel Angle Samples.
FIGURE 4.12. Stress versus strain graph for 70 degree first sample.
FIGURE 4.13. Stress versus strain graph for 70 degree second sample.
The Figure 4.12 shows the stress versus strain for the first sample for 70 degree bevel angle SS304 stainless steel plate while Figure 4.13 shows the second sample from the same plate for the same bevel angle. The first sample gives ultimate tensile strength of 628.908MPa while the second sample gives ultimate tensile strength of 609.157MPa. The yield stress for the first sample is 347.865MPa while the second sample gives yield stress of 372.305MPa.
34
Summary of Ultimate Tensile Strength for all the samples is shown in Table 4.2. Table 4.3 shows summary of yield stress for all the samples and average yield stress for each bevel angle.
TABLE 4.2. Summary of Ultimate Tensile Strength.
Sample First Sample UTS, MPa
Second Sample UTS, MPA Average UTS, MPa 30 degree 514.976 499.152 507.064 40 degree 594.95 598.429 596.6895 50 degree 633.512 637.191 635.3515 60 degree 615.557 614.72 615.1385 70 degree 628.908 609.157 619.0325
TABLE 4.3. Summary of yield stress and average yield stress.
Sample First Sample Yield Stress, MPa
Second Sample Yield Stress, MPa Average Yield Stress, MPa 30 degree 320.599 274.634 297.6165 40 degree 342.821 330.544 336.6825 50 degree 380.683 390.699 385.6910 60 degree 367.580 366.061 366.8205 70 degree 372.305 347.865 360.0850
35
4.3 Simulation Discussion
Simulation was performed in ANSYS FLUENT using only structural. The 5 models were developed, each having different bevel angle as specified in the test matrix. The simulation involved applying force 2.9308035715 MN which is 50% of the force that the sample sustains at the ultimate tensile stress (505MPa) for SS304 material. The force was applied on one end of the sample while the other was anchored. The trend for the maximum stress sustained is similar even if the value of stress is increased up to 100%.
FIGURE 4.14. Maximum stress in X axis versus bevel angle chart.
It should be noted that this stress value is the maximum stress sustained when the force for all the samples are similar. Thus, a sample with lower stress is better compared with a sample with higher stress. This is because, for the same amount of force, if a model experiences higher stress, then the model will fails first compared to the model which experiences lower stress for the same amount of force applied provided that both models are made up of the same material which is true for this simulation. 0 200 400 600 800 1000 1200 1400 1600 1800
30 degree 40 degree 50 degree 60 degree 70 degree
Stres
s,
MPa
36
As can be seen in Figure 4.14, the model with 50 degree bevel angle sustains the least amount of stress for the same value of force, thus 50 degree bevel angle is the optimum angle. Stress in X direction is considered instead of Von Mises due to the fact that the force applied is only in one direction, the x axis. Thus, stress analysis in x direction is sufficient. Von Mises stress is important only when the model is subjected to force in multiple directions.
4.4 Ultimate Tensile Strength (UTS) Discussion
In order to validate the ANSYS model, experiment was performed with the same test matrix. Tensile test was performed on the samples. There are 2 types of stress versus strain graph, one using engineering stress and another using real stress. The difference is in area, in real stress the instantaneous area is taken while in engineering stress, original area is considered to calculate stress. This is the reason why the stress value in engineering stress versus strain graph decreases after UTS since the area actually reduces and the sample actually should have more stress since its area is in fact reduced. However, engineering stress is used in engineering application since after necking; the material is no longer safe and usable. The result of the experimental tensile test is based on engineering stress versus strain.
FIGURE 4.15. Ultimate Tensile Strength versus bevel angle chart.
0 100 200 300 400 500 600 700
30 degree 40 degree 50 degree 60 degree 70 degree
U
TS,
MPa
37
Based on the Figure 4.15, it can be seen that the UTS value increases as the bevel angle is increased until the bevel angle reaches 50 degree. 50 degree sample achieves the maximum UTS. The UTS value reduces as bevel angle is increased further and remains almost the same for 60 degree and 70 degree.
This shows that the SS304 plate with 50 degree bevel angle is the optimum angle since it is able to hold the maximum amount of load before it fractures. In tensile test, the force applied is in tension thus the UTS value reflects the maximum tension the sample is able to hold before it starts to fracture and break.
The metal plate welded with 30 degree bevel angle shows the weakest UTS value which is expected even after the metal was welded. This is because there was not enough melting and fusion between the parent metal and the weld filler. The reason is because bevel angle of 30 degree does not have enough space for the electrode to go close to the grove area thus only the top part of the parent metal receives enough heat and melts while the bottom part of the parent metal does not melt nor does the filler metal reaches the bott0m part of the parent metal (root length section). The plate welded with 30 degree bevel angle also shows that there is no full penetration during welding which proves that bevel angle of 30 degree does not have enough space for perfect welding.
The ultimate tensile strength value increases as the bevel angle is increased from 30 degree to 40 degree and 50 degree. This is due to the fact that as the bevel angle is increased, the tungsten electrode is able to reach deeper into the bevel angle and thus it is able to melt even the bottom part of the parent metal. This also causes the metal plate to experience full penetration which increases the strength of the metal plate.
The ultimate tensile strength for bevel angle 60 degree and 70 degree is almost similar which are higher than 40 degree and 30 degree but lower than 30 degree. However, the bevel angle 60 degree and 70 degree are not practical to be used in the industry since the bevel angle is too larger. Since the bevel angle is too large, it will require a lot of filler metal to fill the gap which can increase the cost. The large bevel angle will also require more number of passes in order to fill up the gap. For 70 degree bevel angle, 3 passes were insufficient to completely fill up the gap. If the gap
38
is not completely filled up, then the weld area can become stress concentrator due to its reduced area. The cross sectional area of the weld will be lower compared to the rest of the structure or pipe, and thus it will experience larger stress compared to the rest of the structure or pipe and will most likely fail even at load that the rest of the pipe is able to sustain.
4.5 Yield Stress Discussion
Apart from ultimate tensile strength, another important result that can be obtained from stress versus strain graph taken from tensile test is the 0.2% offset Yield Stress. Yield stress or also known as Yield strength is the maximum stress the sample is able to hold before the material starts plastic deformation. Stress lower than the yield stress will result in elastic deformation were by the material will be able to revert back to its original dimension and microstructure after the force is removed. Therefore the material will only sustain temporary deformation.
However, if the material experiences stress above the yield stress, the material will experience permanent deformation. The material will not be able to revert back to its original dimension and microstructure even after the load is removed. Strain hardening will occur in permanent deformation which will increase the tensile strength but it will cause the material to become less ductile. In most engineering application, design of structures is made based on the yield strength. The structure is assumed to fail if the stress exceeds the yield stress.
39
FIGURE 4.16. Yield Stress versus bevel angle chart.
The trend for yield stress follows the same trend for ultimate tensile strength for every degree of bevel angle as shown in Figure 4.16. The SS304 plate with 50 degree bevel angle is still the optimum bevel angle based on the highest 0.2% offset yield stress which is 385.691 MPa. However, it should be noted that for yield stress bevel angle 60 degree is better than 70 degree since it has slightly higher yield stress although 70 degree bevel angle has higher ultimate tensile strength compared to 60 degree bevel angle.
Therefore, the result for experiment validates the ANSYS model. Both Ultimate Tensile Strength and Yield Stress shows that bevel angle of 50 degree is the optimum angle which validates the result from ANSYS simulation which also shows that bevel angle of 50 degree is the optimum angle.
0 50 100 150 200 250 300 350 400 450
30 degree 40 degree 50 degree 60 degree 70 degree
Yie ld s tres s, MPa
40
CHAPTER 5: CONCLUSION AND RECOMMENDATION
5.1 Conclusion
The simulation has been successfully performed in ANSYS. 5 models have been created, each for every test matrix. Structural load (force) has been applied on every model in order to determine the stress sustained by the models. The simulation showed that for the same value of force applied, the model with 50 degree bevel angle single V butt joint experienced the smallest value of stress.
In order to validate the simulation, experiment has been performed. Stainless steel SS304 plates with 13 mm thickness has been successfully machined and welded with different bevel angles according to test matrix. Two samples have been successfully cut from each welded plate and tensile test has been performed to determine the tensile strength (Ultimate Tensile Strength and Yield Stress). In order to validate the experiment, simulation has been performed in ANSYS software according to the test matrix for each bevel angle. A total of 5 models have been tested, each model having different bevel angles.
Based on the experimental result, the optimum bevel angle for butt jointed for 13mm thickness SS304 steel is 50 degree since it has highest UTS value compared to the rest of the bevel angles. Steel plate with bevel angle 50 degree also resulted in the highest yield stress compared to the rest of the samples, thus it is the most suitable bevel angle for butt joint of SS304 steel and the simulation result has been validated.
41
5.2 Recommendation
There are a few recommendations in order to improve the quality of the experiment and simulation and to increase the scope of the project. Firstly, since it has already been proved that 50 degrees bevel angle is the optimum, thus the future research should narrow down the bevel angle study between 40 degrees to 60 degrees in order to refine the optimum bevel angle. The difference in angles should also be refined up to 1 degree if possible.
Steel with various thicknesses should also be investigated since there are many pipes and structures that use various thickness of steel. Fir this research, only one thickness is investigated, 13 mm.
The machining for sample preparation should be done using automated CNC machines in order to achieve higher quality and accuracy of sample preparation. The welding process should also be done using robot arm so that the other variables such as speed of welding can be investigated along with bevel angles to determine the best combination.
42
REFERENCES
[1] P. D. Patel, & S. P. Patel, (2011). Prediction of Weld Strength Metal Active Gas
(MAG) Welding Using Artificial Neural Network. International Journal of
Engineering Research and Application (IJERA), Vol. 1, Issue 1, pp.036-044
[2] Tungsten Inert Gas Welding. (2007). Retrieved 20 December 2014 from
http://www.ewf.be/media/documentosdocs/doc_87_technical_sheet_-_tig_welding.pdf
[3] N. Murugan, & N. Gunaraj, (2002). Prediction and control of weld bead geometry and shape relationships in submerged arc welding of pipes.
[4] G. Mahendramani, (2012). Effect of included angle in V-groove butt joints on shrinkages in Submerged arc welding process. Int journal of Eng Science and technology (IJEST), Vol 14, April 2012.
[5] I. S. Kim, Y. J. Jeong, C. W. Lee, & P. K. D. V. Yarlagadda, (2003). Prediction of welding parameters for pipeline welding using an intelligent system. Springer-Verlag London, 22,713-719.Doi: 10.1007/s00170-003-1589-y
[6] Lincoln Electric (1994), The Procedure Handbook of Arc Welding, Cleveland, Ohio: Lincoln Electric, ISBN 99949-25-82-2.
[7] ASTM A370-14, Standard Test Methods and Definitions for Mechanical Testing of Steel Products, ASTM International, West Conshohocken, PA, 2014, www.astm.org
[8] L. D. Smith, (2001). The fundamentals of gas tungsten arc welding: Preparation, consumables, and equipment necessary for the process. The Fabricator.
Retrieved 8 December 2014 from
http://www.thefabricator.com/article/arcwelding/the-fundamentals-of-gas-43
tungsten-arc-welding--preparation-consumables-and-equipment-necessary-for-the-process
[9] J. Sean,(2012). Shielded metal arc welding (SMAW). Welding process weld design. Retrieved December 8, 2014 from
http://www/corrosionist.com/shielded_metal_arc-welding_(SMAW).htm
[10] American Welding Society (AWS), standard welding preparation for single V butt weld, AWS D1.1: Structural Welding Code-Steel. Retrieved December 8, 2014 from https://law.resource.org/pub/us/cfr/ibr/003/aws.d1.1.2000.pdf
[11] M. Z. Hamin, (2013). Finite Element Analysis of Residual Stress in Welded Thick Plates of a Single Butt Weld with Different Included Bevel Angles. UTPEDIA. Retrieved December 10,2014 from
http://utpedia.utp.edu.my/13733/1/completed.pdf
[12] Technical knowledge, design part 3. The Welding Institute. Retrieved 9
December 2014 from
http://www.twi-global.com/technical-knowledge/job-knowledge/design-part-3-092/
[13] AISI Type 304 Stainless Steel, ASM Aerospace Specifications Metal Inc. Retrieved December 8, 2014 from
![FIGURE 2.2. Types of butt joints [9].](https://thumb-us.123doks.com/thumbv2/123dok_us/1389699.2686138/14.892.171.816.441.684/figure-types-of-butt-joints.webp)
![TABLE 2.1. Standard welding preparation for single V butt weld according to American Welding Society [10]](https://thumb-us.123doks.com/thumbv2/123dok_us/1389699.2686138/15.892.173.782.166.586/table-standard-welding-preparation-according-american-welding-society.webp)
![TABLE 2.2. Specimen dimensions for tensile test according to ASTM A370 [7].](https://thumb-us.123doks.com/thumbv2/123dok_us/1389699.2686138/17.892.168.769.146.573/table-specimen-dimensions-tensile-test-according-astm-a.webp)
![TABLE 2.3. The chemical compositions of SS304 based on ASM data sheet [13].](https://thumb-us.123doks.com/thumbv2/123dok_us/1389699.2686138/18.892.154.797.591.745/table-chemical-compositions-ss-based-asm-data-sheet.webp)