978-1-4577-0428-4/11/$26.00 ©2011 IEEE
Semi-RAID: A Reliable Energy-Aware RAID Data Layout
for Sequential Data Access
Li Xiao, Tan Yu-An, Sun Zhizhuo Beijing Institute of Technology School of Computer Science and Technology
5 South Zhongguancun Street, Haidian District, Beijing 100081, P. R. China
Abstract
In this paper, we propose an alternative RAID data layout, Semi-RAID (S-RAID), for the kind of applica-tion that exhibits a sequential data access pattern. The data layout of S-RAID uses a grouping strategy that makes only part of the whole array active and puts the rest of the array into standby mode. In this way S-RAID can greatly reduce the power consumption and improve the reliability while still satisfying the I/O requirements of the application. We have shown that transforming a traditional RAID 5 into S-RAID 5 makes average mean time to failure (MTTF) 8 times as long as before, and reduces the power consumption to 74% in a 5-disk configuration. In a typical video sur-veillance system that has 25 disks, S-RAID may reduce the power consumption to nearly 15% in the best case. The performance of S-RAID is evaluated and proved to be sufficient for the workloads it is optimized for. Pos-sible optimization for other workloads has also been given at the end of the paper.
1. Introduction
Storage subsystem has always been an important component in a computer system, especially in those data-intensive systems. As Internet grows rapidly every year, large-scale data processing applications become ubiquitous. Online transaction processing systems, media broadcast systems, data protection systems, vid-eo surveillance systems, to name just a few, have in-creased requirements for high performance storage system.
These requirements may be generally described in three aspects: larger amounts of disk space, higher da-ta-transfer rates and higher reliability. To satisfy these requirements, Disk arrays or Redundant Arrays of In-expensive Disks (RAID) [1] have been widely used as the standard architecture for almost all storage systems. In the standard levels 4, 5, 6 of RAID, there are more than one data disks in the array plus one or two
parity disks that work in a parallel scheme. The data to be written to the array are divided into chunks and then are written to these data disks concurrently. In such a way RAID provides large capacity and high transfer rate for those data-centric applications. Also with the presence of redundant parity disks, RAID gains such high reliability and availability that when one or two disk failures occur the array continues to run in a de-graded mode.
However, another important aspect of storage sys-tems has become the main concern of many large scale data-centric systems in recent years. Power saving, which was thought to be important only in mobile sys-tems now has been accepted as one of the most essen-tial optimization targets [3, 4]. That is because power consumption is not only related to power delivery cost, but it also results in high cost in cooling the system components, and in the impact of operating tempera-tures on the stability and reliability of the whole sys-tems [2]. Studies have shown that the power consump-tion of large data centers can be several Mega-Watts, and the power densities could grow to over 100 Watts per square foot [5].
It has been shown that spindle motor for the disks consumes most of the power [2]. Therefore one way to reduce power consumption is to shut down disks or put them into a standby mode in which the disks are spin-ning at a relatively low speed when the disks are not in use. Such method has been widely used in mobile de-vices to save battery energy [6]. But with the RAID case, the method seems unsuitable because of the par-allelism nature of RAID. In achieving higher data transfer rate, more disks are added to the array to max-imize the parallelism, and more power is consumed.
In spite of the fact that many applications men-tioned before ask for high data transfer rate, there are indeed applications that perform well enough at a moderate data transfer rate. Video surveillance, contin-uous data protection (CDP), virtual tape library (VTL), etc., are applications using RAID not for high data transfer rate, but for the large disk capacity and the
reliability. With the standard RAID levels, they have got the extra data transfer rate and in the meantime the extra cost of power delivery and cooling system. The more disk capacity such a system uses, the more disks have to be added into the array, hence aggravating the problem. Furthermore, as more disks work concurrent-ly, disk failure rate increases correspondingly. Another important characteristic of this kind of applications is that their I/O access pattern is sequential in most of the time.
For example, in a video surveillance system with 32 digital cameras, each camera captures the video stream in D1 format which requires a bandwidth of 2Mbps for the storage system. If the video surveillance system needs to keep the captured video for a period of one month, the storage space needed will approximates 20TB. If a single disk has a capacity of 2TB, 10 data disks are necessary to satisfy the storage requirement. However, the video surveillance system only asks for a total transfer rate of 8MB/s of sequential-write, while a traditional RAID 5 of 10 data disks provides a transfer rate of about 1000MB/s in ideal case. The extra trans-fer rate is wasted, and with all disks being active at the same time, extra power is consumed. Therefore for these kinds of applications, a new method needs to be found that retains the advantage of traditional RAID’s redundant data protection while reducing the power consumed by having all disks active at the same time.
This paper proposes an energy-aware RAID data layout for that kind of applications, the Semi-RAID (S-RAID). S-RAID sacrifices part of the parallelism of RAID in order to save power by making only a few disks in the array active, and putting other disks into standby mode while still providing enough transfer rate for the application.
The rest of the paper is organized as follows: sec-tion 2 discusses the related work; secsec-tion 3 goes through the traditional RAID data layout; section 4 presents the design and data layout of S-RAID; the procedure of read and write operation is described in section 5; section 6 and 7 evaluate the reliability and power consumption of S-RAID; section 8 discusses the performance of S-RAID and gives concrete examples; section 9 concludes the paper and proposes probable optimizations of S-RAID.
2. Related Work
The problem of power minimization in storage sys-tem has been long studied. Huge amount of methods ranging from large data center power reduction to mo-bile device power saving have been proposed in the
literature. For the scope of this paper, this section mainly concerns the work on disk power minimization.
Most algorithms trying to reduce the disk power consumption are based on some kind of spin-down strategy. As mentioned in [8], the spinning of platter dominates the disk power consumption. When put into the standby mode, the disk may consume only 10% of the power of the normal mode.
A straightforward method is partitioning the storage system into RAID systems [1]. By doing so, disks are grouped into sub-RAID systems, therefore the work-loads are balanced, and when a sub-RAID is inactive, disks in the sub-RAID can be spun down to save ener-gy. However this method is typically applicable only for large data centers that deploy hundreds of disks because a single RAID is not suitable. In medium or small storage systems that use only single RAID, di-viding disks into sub-RAID systems will result in more than one redundant parity disk which is not necessary and greatly decreases the available storage capacity.
In the context of a single disk array, much work has so far focused on prediction strategies of the disk idle period to spin down the disk [9, 10, 14]. Most of these methods use normal disk with two modes of full speed and standby. Some of these methods predict the next disk idle period and spin down the disk in advance; others spin down the disk when it has been idle for a certain length of time. Although these methods predict disk idle period according to some gathered infor-mation, such as the number of the requests in the re-quest queue, it’s still not very effective in making ac-curate prediction due to the limit view of the workload evolution. Other work on the prediction scheme em-ploys precise model of disk state transition such as Markov model [11], but the method exploits multi-speed hard disk which is not widely used. In [16], a multiconstraint energy-saving model is developed for the RAID environment by considering both disk char-acteristics and workload. And an energy saving policy, eRAID is proposed. eRAID focuses on conventional disk-based mirrored disk array architectures like RAID 0, and the power-saving effect is limited on parity re-dundant disk arrays like RAID 5.
On the other hand, efforts have been made in in-creasing the disk idle period in order to benefit from putting disk into standby mode together with other power saving strategies. Hibernator [12] abstracts the power saving problem into an optimization problem, and exploits the optimum solution in data migration between disks. The method also makes use of multi-speed disk. PARAID [13] exploits the free space on the disks to duplicate data and uses a skewed striping
pat-tern to adapt to the system load by varying the number of powered disks, thus needing no specialized hard-ware. However, both of these methods need to move data between the disks, and this behavior will introduce more overheads in synchronizing large amount of data. As a result, the effect of power saving is limited. In [15], a method to increase the disk idle period by ad-justing the data layout has also been proposed. The scheme focuses on array-based scientific code. By ana-lyzing the array access traces obtained through profil-ing, the algorithm determines the data layout. Because the method determines the data layout of each array used by the code, it is only suitable for certain scien-tific code that makes large use of array data structure. EERAID [17] is another energy-efficient RAID system architecture which conserves energy by taking ad-vantage of redundant information. The idea of develop-ing scheduldevelop-ing and cache management policies inside a RAID controller is typically effective in large data cen-ters whose workload is dominated by random read data access.
3. Traditional RAID Data Layout
Before going into the detail of Semi-RAID design, it is necessary to look at the design of the traditional RAID data layout. Having the data layout of a standard RAID, we can easily transform it into an S-RAID data layout.
In the rest of the section, we first discuss the case of RAID 4 data layout, and then we will extend the result to RAID 5.
A RAID 4 uses block-level striping with a dedicated parity disk. Each data disk in the array can act inpendently if only a single block is requested. We de-scribe the data layout of a RAID 4 setup in Figure 1 below.
In Figure 1, DD00 to DD33 and PP represent the disks in
the array. There are 4 data disks DD00, DD11, DD22 and DD33,
with PP being the parity disk. In the rest of the paper, we use NNdata diskdata disk to represent the number of data disks
in an array. In Figure 1, we have NNdata diskdata disk= 4= 4.
Likewise, we use NNparity diskparity disk and NNarray diskarray disk to
rep-resent the number of parity disks and the total number of disks in the array. As in RAID 4, there is only one parity disk in the array, so NNparity diskparity disk= 1= 1 and
Narray disk =Ndata disk+ 1
Narray disk =Ndata disk+ 1 holds.
Bd;s
Bd;s denotes a data block in the array and PPss
de-notes a parity block in the array, where dd denotes the disk number and ss denotes the stripe number. For ex-ample in Figure 1, BB11;;22 is the block of DD11 that lies in
Stripe2
Stripe2 and PP22 is the parity block in the same stripe.
Given a Logic Block Address (LBA) blknoblkno of a RAID 4 that has NNdata diskdata disk data disks andNNstripestripe
stripes, the following mapping is used to compute the stripe number and the disk number of the correspond-ing block in that disk:
Stripe(blkno) =bNdata disk
blkno c Stripe(blkno) =bNdata disk
blkno c (2.1) Disk(blkno) =blkno¡ bNdata disk
blkno cNdata disk Disk(blkno) =blkno¡ bNdata disk
blkno cNdata disk(2.2)
From the mappings we can see if a large request containing 4 sequential LBA blocks, say LBA 0, 1, 2, and 3, is sent to a RAID 4 as shown in Figure 1, the request would be divided into 4 small requests and sent to all 4 data disks concurrently, thus gaining the high data transfer rate almost 4 times as fast as a single disk. And as mentioned before, in the case of small read request which is mapped to blocks in different data disks in the array, the disks act independently and again maximize the parallelism. The arrows in Figure 1 denote the data block sequence in LBA ascending or-der. B1,0 B1,1 B0,0 B0,1 B3,0 B3,1 B2,0 B2,1 D0 D1 D2 D3 Stripe0 Stripe1 Stripe3 P0 P1 P B1,2 B1,3 B0,2 B0,3 B3,2 B3,3 B2,2 P2 ... B0,n ... B1,n B2,3 ... B2,n ... B3,n P3 ... Pn Stripe2 Stripen
Figure 1 Data layout of RAID 4
However, there is a bottleneck of small write re-quest because the blocks in parity disk are calculated from each block of the data disks in the same stripe using exclusive OR operation:
P =M i Di=D0©D1©: : :©Dn¡1 P =M i Di=D0©D1©: : :©Dn¡1 (2.3)
where PP represents the parity disk and DD11 through
Dn¡1
Dn¡1 represents data disks. We can write the equation
Pk= n¡1 M i=0 Bi;k =B0;k©B1;k©: : :©Bn¡1;k Pk= n¡1 M i=0 Bi;k =B0;k©B1;k©: : :©Bn¡1;k (2.4)
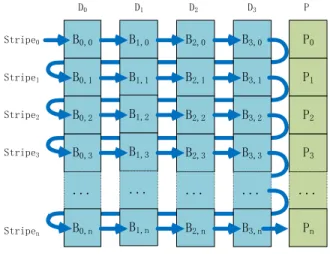
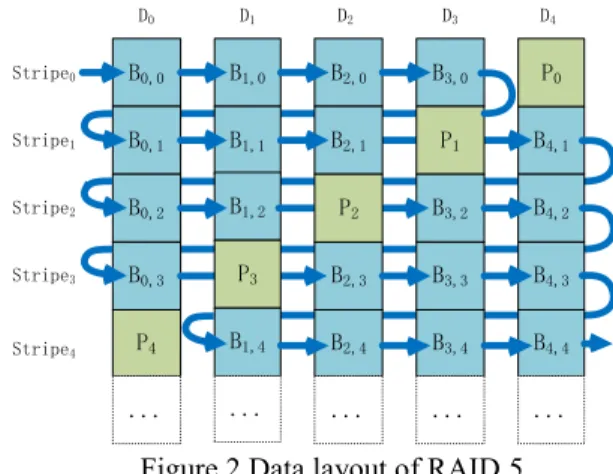
where nn is the number of data disks, kk is the number of stripe which the parity are calculated from. There-fore, if a small write request is mapped to a few single blocks in a stripe, the parity needs to be recalculated, and other data blocks in the stripe may have to be read out for the calculation. This also blocks write request in other stripe, since all parity blocks are in a single disk. The parity disk hereby becomes the bottleneck, and this is the place where RAID 4 differs from RAID 5. In RAID 5, parity blocks are distributed to each disk in the array, thus relieving the contention of parity disk between small write requests. A typical data layout of RAID 5 is depicted in Figure 2. The calculation of the parity block in RAID 5 is the same as RAID 4, where-as the parity blocks are uniformly distributed in all the disks in the array.
By now we have described the data layout of tradi-tional RAID and how the parity is generated from the data disks. It is clear that in order to benefit from the parallelism, all disks in the RAID should stay in active mode with the spindle motor spinning at full speed. The data layout of traditional RAID also leads to the situation in which sequential write requests are always mapped to blocks in more than one disk. As a result of data locality, putting some of the data disks into standby mode is inapplicable in traditional RAID data layout. B1,0 B1,1 B0,0 B0,1 B3,0 B4,1 P1 B2,0 B2,1 D0 D1 D2 D3 Stripe0 Stripe1 Stripe3 P0 D4 B1,2 B0,2 B0,3 P3 B2,3 B3,2 B3,3 P2 B4,2 P4 ... B1,4 ... B2,4 ... B3,4 ... B4,3 B4,4 ... Stripe2 Stripe4
Figure 2 Data layout of RAID 5
4. Semi-RAID Data Layout
In the last section, we have pointed out that it is in-applicable to shut down or put into standby mode some disks in traditional RAID data layout to reduce power
consumption. This section will present the Semi-RAID data layout that allows part of the RAID to stay in standby mode while the other part of the RAID is ac-tive. S-RAID trades data transfer rate for energy effi-ciency and reliability, and is suitable for the applica-tions like video surveillance which requires moderate data transfer rate but large storage capacity and high reliability. These applications also exhibit a highly sequential data access pattern that S-RAID is opti-mized for.
In this section, we first discuss the data layout of S-RAID 4, and then generalize the idea to S-S-RAID 5. In S-RAID 4, we divide the data disks DDii into groups.
Each group has one or more disks. We use GGnn to
rep-resent a group where nn is the group number, and NNGG
represents the number of disks in a group. Like RAID 4, there is only one parity disk, which is written as PP. Blocks in data disks are written as SSd;sd;s, blocks in
pari-ty disk are written as SPSPss where dd denotes the disk
number and ss denotes the stripe number. the calcula-tion of SPSPss is the same as RAID 4, which is calculated
from each block of the data disks in the same stripe using exclusive OR operation.
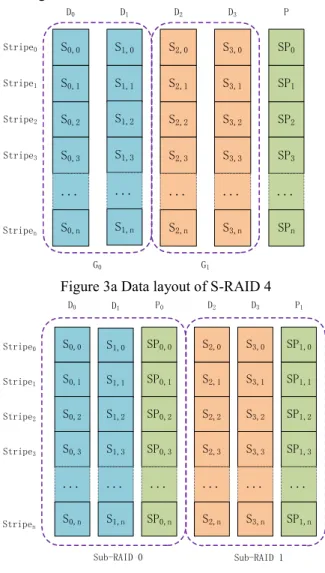
We first show an example data layout of S-RAID 4 in Figure 3a that corresponds to the example given in section 3 to explain the idea behind S-RAID. A Sub-RAID layout is shown in Figure 3b for contrast. It is clear that an extra parity disk is used in the sub-RAID data-layout with 2-disk groups. With more groups, more parity disks have to be used in sub-RAID while S-RAID constantly uses only one parity disk.
In Figure 3a we can see there are two groups of data disks, GG00 and GG11, each of which has two disks,
G0=fD0; D1g
G0=fD0; D1g , GG11==ffDD22; D; D33gg , so we have
Narray disk= 5
Narray disk= 5, and NNGG= 2= 2. What makes S-RAID 4
differ from RAID 4 is that the LBA of the array are mapped to SSd;sd;s in such a way that the first half of the
LBA space lies in GG00, and the second half of the LBA
space lies in GG11. As a result of this layout, when the
requests are clustered in group GG00, disks in group GG11
could be put into standby mode. This is the case for the applications that have a sequential data access pattern. Since a group includes at least a whole data disk, there is enough LBA space in one group for the sequential request to cluster in. For example, in a video surveil-lance system using an S-RAID of 15 disks as storage system, video data is sequentially written to the array. If NNGG= 2= 2, the video data is first written to the first
and second disk of S-RAID. When these two disks are full, the video data is continuously written to the third and fourth disk of S-RAID, thus only two disks are active at the same time, and others can be put into standby mode to save power. If a traditional RAID of
15 disks is used for the video surveillance system, all 15 disks will be active all the time to provide a high transfer rate, although the video data I/O never asks for such high transfer rate.
S1,0 S1,1 S0,0 S0,1 S3,0 S3,1 S2,0 S2,1 D0 D1 D2 D3 Stripe0 Stripe1 Stripe3 SP0 SP1 P S1,2 S1,3 S0,2 S0,3 S3,2 S3,3 S2,2 SP2 ... S0,n ... S1,n S2,3 ... S2,n ... S3,n SP3 ... SPn Stripe2 Stripen G0 G1
Figure 3a Data layout of S-RAID 4
S1,0 S1,1 S0,0 S0,1 S3,0 S3,1 S2,0 S2,1 D0 D1 D2 D3 Stripe0 Stripe1 Stripe3 SP0,0 SP0,1 P0 S1,2 S1,3 S0,2 S0,3 S3,2 S3,3 S2,2 SP0,2 ... S0,n ... S1,n S2,3 ... S2,n ... S3,n SP0,3 ... SP0,n Stripe2 Stripen Sub-RAID 0 Sub-RAID 1 SP1,0 SP1,1 P1 SP1,2 SP1,3 ... SP1,n
Figure 3b Data layout of Sub-RAID
To generalize the idea to an arbitrary RAID 4, we use a matrix to represent an S-RAID 4 with nn data disks and mm stripes:
0 B B B @ S0;0 S1;0 : : : Sn¡1;0 SP0 S0;1 S1;1 : : : Sn¡1;1 SP1 .. . ... . .. ... ... S0;m¡1 S1;m¡1 : : : Sn¡1;m¡1 SPm¡1 1 C C C A 0 B B B @ S0;0 S1;0 : : : Sn¡1;0 SP0 S0;1 S1;1 : : : Sn¡1;1 SP1 .. . ... . .. ... ... S0;m¡1 S1;m¡1 : : : Sn¡1;m¡1 SPm¡1 1 C C C A (2.5)
In the matrix, each row corresponds to a stripe in the array and each column corresponds to a disk in the array. Element SSd;sd;s in the matrix corresponds to the
block of disk DDdd which lies in StripeStripess.
To describe the data layout of this S-RAID 4 for-mally, first we define the groups which in turn defines the mapping from LBA to S where:
S=fSi;j j0·i < n;0·j < mg
S=fSi;j j0·i < n;0·j < mg.
Assume there are rr groups: GG00; G; G11; : : : ; G; : : : ; Grr¡¡11, and
NG
NG is the number of disks in each group. Define the
start LBA of each group as follows: LGk =m¢NG(k= 0; : : : ; r¡1) LGk =m¢NG(k= 0; : : : ; r¡1)
Then for every LBA blknoblkno in the array, there exists a kk that satisfies LLGGkk ··blkno < Lblkno < LGGkk+1+1. Thus the mapping ff::LBALBA!!SS can be defined as :
fstripe(blkno) =b blkno¡LGk NG c fstripe(blkno) =b blkno¡LGk NG c
fdisk(blkno) =blkno¡LGk fdisk(blkno) =blkno¡LGk
¡¡NNGG¢¢ffstripestripe(blkno) +(blkno) +kk¢¢NNGG
f(blkno) =Sfdisk(blkno);fstripe(blkno) f(blkno) =Sfdisk(blkno);fstripe(blkno).
Similarly, given a block SSd;sd;s in group GGkk of an
S-RAID 4, we can compute the LBA of this block: LBA(Sd;s) =LGk+s¢NG+d¡k¢NG LBA(Sd;s) =LGk+s¢NG+d¡k¢NG.
Now,it is easy to transform a traditional RAID 4 into an S-RAID 4. Given that a traditional RAID 4 which is represented in matrix:
0 B B B @ B0;0 B1;0 : : : Bn¡1;0 P0 B0;1 B1;1 : : : Bn¡1;1 P1 .. . ... . .. ... ... B0;m¡1 B1;m¡1 : : : Bn¡1;m¡1 Pm¡1 1 C C C A 0 B B B @ B0;0 B1;0 : : : Bn¡1;0 P0 B0;1 B1;1 : : : Bn¡1;1 P1 .. . ... . .. ... ... B0;m¡1 B1;m¡1 : : : Bn¡1;m¡1 Pm¡1 1 C C C A
has a grouping GG==ffGG00; G; G22; : : : ; G; : : : ; Grr¡¡11gg, the element
in the corresponding S-RAID 4 would be:
S
d;r=
B
Disk(LBA(Sd;r);Stripe(LBA(Sd;r)S
d;r=
B
Disk(LBA(Sd;r);Stripe(LBA(Sd;r).SPr:= n¡1 M d=0 Sd;r SPr:= n¡1 M d=0 Sd;r
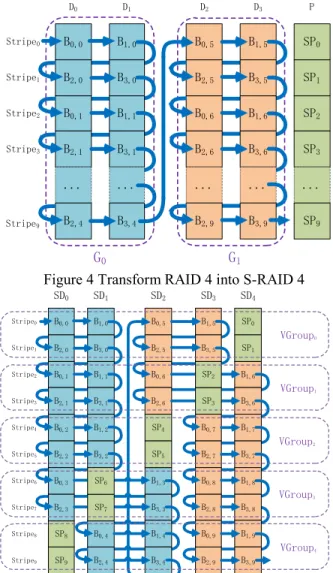
Take the example of RAID 4 in Figure 1, and the grouping in Figure 3a, we obtain an S-RAID 4 as shown in Figure 4 if mm= 10= 10. As in Figure 1, the ar-rows denote the data block sequence in LBA ascending order.
As described above, S-RAID 4 uses a fixed parity disk like traditional RAID 4, hence the parity disk may also become a bottleneck. This not only affects the
performance but also reduces reliability. Not like the data disks in difference group, the parity disk cannot be put into standby mode, since each write request needs to recalculate the parity block and write it back to the parity disk. This makes the failure rate of the parity disk higher than the data disks.
To ease the bottleneck of parity disk, we introduce the S-RAID 5 data layout that uniformly distributes parity blocks among the disks. Having the data layout of RAID 5, it is easy to obtain S-RAID 5 data layout accordingly. Like in S-RAID 4, we again use a group-ing strategy that further divides the stripes into vertical groups. We use V GroupV Groupnn to represent a vertical group
where nn is the group number, and NNV GV G represents the
number of stripes in each vertical group. There is no fixed parity disk in S-RAID 5, instead in each vertical group we put parity block into different disks.
B1,0 B3,0 B0,0 B2,0 B1,5 B3,5 B0,5 B2,5 D0 D1 D2 D3 Stripe0 Stripe1 Stripe3 SP0 SP1 P B1,1 B3,1 B0,1 B2,1 B1,6 B3,6 B0,6 SP2 ... B2,4 ... B3,4 B2,6 ... B2,9 ... B3,9 SP3 ... SP9 Stripe2 Stripe9 G0 G1
Figure 4 Transform RAID 4 into S-RAID 4
Stripe9 Stripe8 Stripe7 Stripe6 Stripe5 B1,0 B3,0 B0,0 B2,0 B1,5 B3,5 B0,5 B2,5 SD0 SD1 SD2 SD3 Stripe0 Stripe1 Stripe3 SP0 SP1 SD4 B1,1 B3,1 B0,1 B2,1 B0,6 B1,6 SP9 B2,4 B2,6 B2,9 B3,6 SP3 Stripe2 Stripe4 B0,2 B1,2 SP4 B0,7 B2,2 B0,3 B2,3 SP8 B3,2 B1,3 B3,3 SP7 B0,4 SP5 B1,4 B3,4 B2,7 B0,8 B2,8 B0,9 B1,7 B3,7 B1,8 B3,8 B1,9 B3,9 SP6 SP2 VGroup0 VGroup1 VGroup2 VGroup3 VGroup4
Figure 5 Data layout of S-RAID 5
To avoid repetition, take a concrete S-RAID 5 data layout for example. Assume NNarray diskarray disk= 5= 5, NNGG= 2= 2,
NV G= 2
NV G= 2, and NNstripestripe= 10= 10, S-RAID 5 rearranges
data blocks of a traditional RAID 5 (as in Figure 2) and recomputes parity blocks SPSPii(i(i= 0; : : : ;= 0; : : : ;9)9) as shown
in Figure 5. In Figure 5, data blocks in different Group are shown in different color, parity blocks are repre-sented in green boxes. Note that data blocks in stripes of each V GroupV Group preserve the same relations as in a corresponding S-RAID 4, whereas parity blocks are shifted between each data disks. It also should be pointed out that in actual S-RAID 5 disk array, the number of V GroupV Group usually equals the number of disks in the array. In this way the parity blocks are uniformly distributed and there are sufficient stripes in a V Group
V Group, which increases disk idle period, making it possible to put the disk into standby mode.
When we configure the S-RAID for specific appli-cation, the parameters can be set according to the ap-plication’s I/O workload. For example, the smaller the
NG
NG is, the lower the power consumption may be. The
I/O performance gets lower as well. If the application requires a relatively low I/O performance, NNGG may be
set to 1, that is, one active disk is sufficient to the ap-plication. If NNGG==NNdata diskdata disk, all the disks will work
parallel, and the S-RAID is equivalent to a traditional RAID.
5. Read and Write Operation in S-RAID
In the last section, we have presented the data lay-out of S-RAID 4/5. The idea is using the size of each group to balance the data-transfer rate and the power consumption. The more disks in a group, the higher the data transfer rate when the group is active. This is be-cause the data layout in such a group is identical to the data layout in a traditional RAID, in which disks in one group operates in parallel manner.
The read and write operation in traditional RAID should be modified to exploit the grouping scheme in S-RAID. As mentioned before, in the best case, only one group is active at one time, disks in other groups are shut down or put into standby mode. This is done by a daemon Diskpm. Diskpm monitors the request queue of each disk in S-RAID. If a disk has been idle for the designated length of time Diskpm will put the disk into standby mode to save power. The parity disk will always be active in S-RAID 4, therefore like a traditional RAID 4, it will be the bottleneck. In the case of S-RAID 5, this problem doesn’t exist. Each disk is alternatively used as data disk and parity disk in different V GroupV Group, the active group and parity disk
change when the accessed data block locates in differ-ent V GroupV Group
Read operations are much simple compared to write operations. When a read request is sent to the S-RAID, equations in section 3 are used to compute the disk and the stripe number of the corresponding block in the array. If the disk holding the block is in the group cur-rently active, then the request is directly sent to that disk with no additional operation. If the disk holding the block is in a group currently in standby mode, then S-RAID first spins up the disks in that standby group, and sends the request to the disk holding the block. The spin-up time of a typical 7200RPM hard disk drive is less than 15 seconds, cache scheme or other prediction strategy may be used to address the spin-up delay.
It can also be seen from the read procedure that read requests in the same group may operate parallel when there are more than one disks in the group, and read requests in different groups are always handled in the parallel way, but it will result in more than one group being active. For the target of power saving, it is ap-preciated that fewer groups are active at the same time. Because of the group layout and the data locality of the application like video surveillance and continuous data protection, in most time, there will be only one or two groups being active at the same time. We will show this in next section.
The write operations in S-RAID are all small-write as in the traditional RAID 4. When a write request is sent to the S-RAID, like in the case of read request, first the corresponding group is selected and made ac-tive if needed. Then all the blocks in the disks of the selected group and the parity block must be read out from the same stripe where the write request block is in. Lastly, S-RAID recalculates the parity and writes the new data of write request and the parity back to disk. For the S-RAID 4 in (2.5), the recalculation of the pari-ty in group GGkk can be derived from equation (2.3) and
(2.4): P :=P M Di2Gk (Di©D0i) P :=P M Di2Gk (Di©D0i) :=P©Dq©Dq0©: : :©Dq+NG¡1©D 0 q+NG¡1 :=P©Dq©Dq0©: : :©Dq+NG¡1©D 0 q+NG¡1 SPs:=SPs M Si;s2Gk (Si;s©Si;s0 ) SPs:=SPs M Si;s2Gk (Si;s©Si;s0 ) :=SPs©Sq;s©Sq;s0 ©: : :©Sq+NG¡1;s©S 0 q+NG¡1;s :=SPs©Sq;s©Sq;s0 ©: : :©Sq+NG¡1;s©S 0 q+NG¡1;s where qq==kk¢¢NNGG, DDii00 and SSi;si;s00 are the new data.
For example, assume that a write request of SS22;;22
and SS33;;22is sent to the array in Figure 3a. The new data
are S0
2;2
S0
2;2, SS3300;;22.The write procedure starts by making
group GG11 active if needed. SS22;;22; S; S33;;22; SP; SP22 are read out
from disk to carry out the following calculation:
SP2:=SP2©S2;2©S20;2©S3;2©S30;2
SP2:=SP2©S2;2©S20;2©S3;2©S30;2.
Finally, the calculated
SP
SP
22 and SS2200;;22, SS3300;;22 arewrit-ten to the corresponding disk.
The small-write behavior makes the write I/O inef-ficient, as every write request leads to a series of read and write requests. However, this can be mitigated in two ways. The first way is to use a read-ahead algo-rithm. Given the sequential data access pattern of the application, it is easy to predict the consequent read request and read the data into a large buffer in advance. Another way is to adjust the size of each group in S-RAID. Increasing the size of a group will raise the par-allelism of the group. Although the write operation will still be small-write, more blocks are written to disk concurrently. This is the rationale behind the grouping scheme of S-RAID.
6. Reliability
The design target of S-RAID is to reduce the failure rate and the power consumption of the traditional RAID by sacrificing part of the parallelism. As de-scribed in the last section, this target is achieved by dividing the data disks into groups, letting only few groups active and putting other groups into standby mode. In this section, we will investigate the benefit of S-RAID 5 in reducing the failure rate and power con-sumption.
Before we begin the evaluation, a few assumptions should be made. First of all, the failures we talk about stem solely from the failures of the disks in the array and are unrelated to the whole software and electronic system. The failure of disks reflects the manufacturing technique and is exponentially distributed. Furthermore, each disk in the array is independent. For example, earthquake or power surge is a situation in which an array of disk might not fail independently.
For simplicity, we hereby consider an average case of S-RAID 5:
a) The access pattern of S-RAID 5 is in such a fashion that at most half of the data disks plus a parity disk are being active at the same time (this is the situation when approximately half of the groups are being active).
b) The time before putting the idle disks into standby mode are negligible when compared to the time being in standby mode.
The reliability can be measured by the mean time to repair (MTTR) and the mean time to failure (MTTF). When a disk fails we assume that within a short time the failed disk will be replaced and the data will be reconstructed on to the new disk using the redundant information. This time is called MTTR. The MTTR can be reduced if the system includes hot spare disks. MTTF means literally the time between two successive failures which we have explained [1].
Let MTTF of a single disk be M T T FM T T Fdiskdisk and
MTTR of a single disk be M T T RM T T Rdiskdisk. According to
the assumptions above, at one time at most half of the data disks of S-RAID 5 are active. In the worst case the array is equivalent to a traditional RAID 4 which has half of the data disks plus a parity disk. Therefore we can evaluate the lower bound of MTTF of the S-RAID 5 by evaluating the MTTF of the equivalent RAID 4.
Because RAID 4 is single-error repairing, from [1] we can calculate the MTTF of the equivalent RAID 4 as follows:
M T T Fraid4=
(M T T Fdisk)2
Nraid4disk(Nraid4disk+ 1)M T T Rdisk M T T Fraid4=
(M T T Fdisk)2
Nraid4disk(Nraid4disk+ 1)M T T Rdisk.
where NNraidraid44diskdisk denotes the number of data disks in
the equivalent RAID 4. As described before:
Nraid4disk= 1 2Nsraid5disk Nraid4disk= 1 2Nsraid5disk.
where NNsraidsraid55diskdisk denotes the number of data disks in
S-RAID 5. Thus the lower bound of the MTTF of the S-RAID 5 would be rewritten as:
M T T Fsraid5=
4¢(M T T Fdisk)2
Nsraid5disks(Nsraid5disks+ 2)M T T Rdisk
M T T Fsraid5=
4¢(M T T Fdisk)2
Nsraid5disks(Nsraid5disks+ 2)M T T Rdisk
When compared with a traditional RAID 5 which have the same number of disks, we have:
MT T Fsraid5¼4¢MT T Fraid5
MT T Fsraid5¼4¢MT T Fraid5
That is, in average case, the conservative estimation of MTTF of S-RAID 5 is 4 times of the traditional RAID 5. If we consider the best case that only the disks in one group are active at the same time, then we have: Nraid4disk= Nsraid5disk number of group Nraid4disk= Nsraid5disk number of group.
MT T Fsraid5¼(number of group)2¢MT T Fraid5
MT T Fsraid5¼(number of group)2¢MT T Fraid5.
That is, in the best case, the MTTF of S-RAID 5 is proportional to the MTTF of traditional RAID 5 and
proportional to the square of the number of group. Take a traditional RAID 5 of 16 disks for example. If MTTF and MTTR of a single disk are 30000 hours and 1 hour respectively, we can calculate the MTTF of such a RAID 5: MT T Fraid5= (30000)2 15£16£1 = 3750000 MT T Fraid5= (30000)2 15£16£1 = 3750000. The corresponding S-RAID 5 in which each group consists of 5 data disks will give a MTTF of:
MT T Fsraid5= (30000)2 5£6£1= 30000000 MT T Fsraid5= (30000)2 5£6£1= 30000000 That is 8 times as the traditional RAID 5.
7. Power Consumption
Under the same assumption, the evaluation of pow-er consumption is relatively simple compared to relia-bility. Suppose WWactiveactive is the power consumption of a
single active disk, and WWstandbystandby is the power
consump-tion of a disk in standby mode, the power consumpconsump-tion of an S-RAID can be computed as:
Wsraid= (NG+ 1)¢Wactive
Wsraid= (NG+ 1)¢Wactive
+(Ndata disk¡NG)¢Wstandby
+(Ndata disk¡NG)¢Wstandby.
To evaluate the power saving effect of S-RAID in actual situation, we use the measurement framework from [13] to test the power consumption of a video surveillance system with 32 digital cameras. Each camera captures the video stream in D1 format which requires a bandwidth of 2Mbps for the storage system.
We implement the S-RAID 4/5 data layout in Linux MD driver, together with a user space daemon Diskpm which monitors the disks in S-RAID and puts the idle disks into standby mode after a constant length of time. The superblock update routine in MD driver is also modified to allow the superblock update of the standby disk to be delayed to the time when the disk is active. This prevents the standby disk from being wak-ened up by the MD superblock update routine.
We use S-RAID 5 as the storage system for the vid-eo surveillance system. The S-RAID 5 includes 5 Seagate ST3500418AS 500G 7200RPM Disks, and is divided into 2 groups of 2 disks. The number of verti-cal group is set to 5, the same as the number of the disks.
A digital multimeter is connected to the disk in the S-RAID 5 as shown in Figure 6, a 0:1Ð0:1Ð resistor is in-troduced into the disk’s +12V and +5V power lines. The +12V line supplies power to the spindle motor; the +5 line supplies power to the disk electronics. On the client, the multimeter software logs the data using Mi-crosoft Excel. To measure the power of a disk, the multimeter measures the voltage drop across the resis-tor VVrr. The current II through the resistor can be
com-puted by VVrr=R=R, which is also the current used by the
disk. Given the voltage drop across the disk VVdd, its
power consumption is then VVdd¢¢II. The total power
consumption of the disk is thus the sum of the power consumption on both the +5V line and the +12V line.
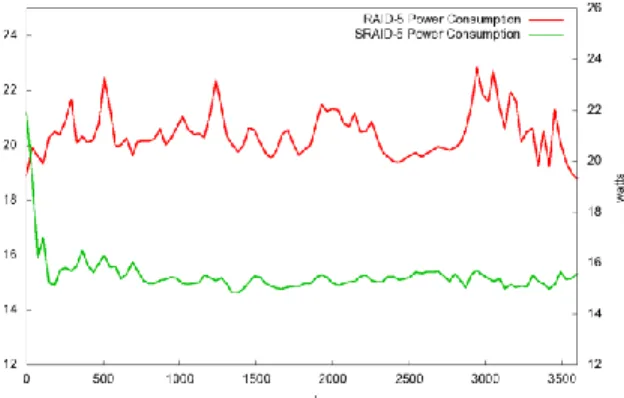
We run the experiment for a time period of 1 hour and measure the power consumption of each disk in the S-RAID 5 every second. Because most of the disk re-quests from the video surveillance system are sequen-tial write requests and the size of the video data written to S-RAID 5 is relatively small compared to the size of the disk. Only the first group of S-RAID 5 remains active during the experiment. The result is shown in Figure 7.
It can be seen in the graph that after a short period of time, the power consumption of S-RAID 5 drops dramatically. This is because in the beginning of the experiment, the idle disks are not spun down by the daemon Diskpm. But after a constant length of time, still no request arrives at the idle disks so the daemon finally spins down these disks.
Figure 7 Power Consumption of S-RAID 5
We compute the average power consumption of S-RAID 5 and the corresponding S-RAID 5. The results are 15.236W and 20.458W respectively, that is, the aver-age power consumption of S-RAID 5 is 74% of the traditional RAID 5. In the ideal case, there will be only 3 disks active in this configuration of S-RAID 5, in-stead of all 5 disks active in the same configuration of a traditional RAID 5. That means the power consump-tion may be reduced to 60% in the ideal case. This re-sult shows a conservative case of S-RAID because there are only two groups in the array. If there are more disks in the array, then the number of groups may be increased. As proved in the last section, we could ex-pect higher energy efficiency by using S-RAID with more groups.
8. Performance
As mentioned earlier, the performance of S-RAID is optimized for reliability and power saving. According to the analysis in section 5, if one group contains exact-ly one disk in S-RAID and onexact-ly one group is active at a time, we have the best case of reliability and power consumption, but it is also the worst case of read/write performance.
When there is only a single disk in a group, the read request sent to S-RAID will be handled much like a normal disk. However each write request will become a read request plus a write request. It seems that this behavior of write operation will greatly affect the write performance of S-RAID, and consequently S-RAID is not suitable for production systems. This section will show that for applications that continuously write to sequential blocks on disks, even an S-RAID disk array of small group size can deal with the workload with the advantage of higher reliability and lower power con-sumption.
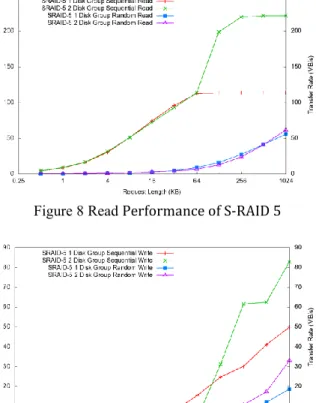
To see the actual performance of S-RAID, we have carried out a set of experiments in the same environ-ment as we measure the power consumption in last section. 5 Hitachi HDE721010SLA330 7200RPM SA-TA drives have been employed to create two types of S-RAID 5. One has exactly one disk in each group and the other has 2 disks in each group. The results of the experiments are obtained from the widely used I/O subsystem measurement and characterization tool Iom-eter. We have generated two kinds of synthetic work-load of different request length, the 100% sequential Read (Write) workload and the 100% random Read (Write) workload. The results are shown in Figure 8 and 9.
Figure 8 Read Performance of S-RAID 5
Figure 9 Write Performance of S-RAID 5 From the figure we can see, in S-RAID, read opera-tion is much faster than write operaopera-tion, and along with the increasing of request size, both read and write speed increases. In the case of 1024KB request size, the read speed of S-RAID 5 with 2 disk group is around 220MB/s, which approximates 2 times as fast as single disk read speed. This means the read opera-tion fully benefits from the parallelism in the S-RAID. On the other hand, write speed in S-RAID is slower than the single disk. This is both because of the soft-ware implementation of exclusive OR operation in Linux MD driver and the small-write behavior of S-RAID.
We can also see in the graph, when we increase the size of group in S-RAID, the transfer rate of sequential request increases accordingly. However for the random request, especially for random read request, the transfer rate doesn’t benefit much from the extra disks in the group.
As we have mentioned earlier, S-RAID layout is de-signed for the workload that mainly consists of sequen-tial access. The transfer rate for sequensequen-tial access shown in the experiments is acceptable for many of the applications like video surveillance and continuous
data protection. A simple calculation can help reach this conclusion.
Take the video surveillance system we discussed in the last section for example. Even with only one disk in a group and the workload completely random, the transfer rate is still 18.65MB/s. It can support up to 64 digital cameras that capture video stream in D1 format. If we use S-RAID 5 that has a group size of 2 disks with the sequential access pattern of the video surveil-lance system, the transfer rate will reach 82.73MB/s. It can support a number of 320 digital cameras with D1 format video stream. On the other hand, if the video surveillance system needs to keep the captured video for a period of one week, the storage space needed will approximates 50TB, which needs a disk array of 25 disks with 2TB single disk capacity. However, the power consumption of S-RAID 5 of 25 disks are not much higher compared to a S-RAID of 5 disks with the same group size of 2, because there are still only 3 disks in active mode at the same time. Conversely, a traditional RAID 5 of 25 disks consumes approximate-ly 5 times the power of a RAID 5 of 5 disks. This means using S-RAID 5 for the 25 disks video surveil-lance system will reduce the power consumption to nearly 15%.
Another example is continuous data protection (CDP). A CDP system is a kind of protection system that records every modification of the protected disks in a backup storage, thereby recovering the protected disks to any point in time since the system starts. Sup-pose the average IO size of those disks being protected is 4KB, we can take the following calculation:
IOP Ssraid= 50£1024KB 4KB = 12800 IOP Ssraid= 50£1024KB 4KB = 12800.
This is because CDP system records the modified data sequentially to S-RAID. Consequently there is no seek operation involved. On the other hand, the IO operations on the protected disks include both random and sequential write, the typical OLTP IOPS of a 10k RPM Serial Attached SCSI drive is around 140. There-fore, a CDP system using a single-disk grouping S-RAID 5 can protect 12800
140 ¼91
12800
140 ¼91 disks at the same time.
9. Conclusion and Further Work
In the previous sections, we have shown that as an alternative RAID data layout optimized for sequential data access, S-RAID provides extra reliability and high energy efficiency. The trade-off is that, the perfor-mance drops in S-RAID especially for write request.
So, S-RAID is suitable for applications like video sur-veillance, CDP, VTL, etc.
S-RAID addresses performance issue by adjusting the group size. Read and write speed increases while there are more disks in the active group at the expense of reliability and power efficiency. When all data disks of the array are in the active group, that is, when the active group is the only remaining group, S-RAID de-generates into a traditional RAID that maximizes the performance. As described in the paper, each group of S-RAID has the same number of disks, which suggests a possibility of setting and managing dynamic group size in RAID in the future. Therefore the same S-RAID can adapt to the variations of data transfer rate of the application. Algorithm dynamically arranging the size of each group in S-RAID could also provide a flexible management of the balance between perfor-mance and power efficiency in S-RAID.
Another way to improve performance of S-RAID is to design fine-grained schedule algorithm for disk spin-down and spin-up. Instead of waiting the idle disk for a constant length of time, other heuristic method based on the runtime information gathered from the access pattern could be employed. That will make S-RAID more efficient for the workload which includes more random requests.
10. References
[1] D.A. Patterson, G.A. Gibson, and R.H. Katz, “A case for Redundant Arrays of Inexpensive Disks (RAID)”, Proc. ACM SIGMOD International Con-ference on Management of Data, pp. 109-116, 1988. [2] Sudhanva Gurumurthiy, Anand Sivasubramaniamy,
Mahmut Kandemiry, Hubertus Frankez, “DRPM: dynamic speed control for power management in server class disks”, Proc. 30th Annual International Symposium on computer Architecture, pp. 169-179, 2003.
[3] P. Bohrer, E. Elnozahy, T. Keller, M. Kistler, C. Lefurgy, C. McDowell, and R. Rajamony, The Case for Power Management in Web Servers, chap-ter 1, Kluwer Academic Publications, 2002.
[4] J. Chase, D. Anderson, P. Thakur, A. Vahdat, and R. Doyle, “Managing Energy and Server Resources in Hosting Centers”, Proc. 18th ACM Symposium on Operating Systems Principles (SOSP’01), pp. 103-116, October, 2001.
[5] J. Chase and R. Doyle, “Balance of Power: Energy Management for Server Clusters”, Proc. 8th
Work-shop on Hot Topics in Operating Systems (HotOS), May, 2001.
[6] E. Harris, S. Depp, W. Pence, S. Kirkpatrick, M. Sri-Jayantha, and R. Troutman, “Technology Di-rections for Portable Computers”, Proc. IEEE, 83(4):636–658, April 1995.
[7] IBM Hard Disk Drive - Ultrastar 36ZX. http://www.storage.ibm.com/hdd/ultra/ ul36zx.htm. [8] John Zedlewski, Sumeet Sobti, Nitin Garg, Feng-zhou Zheng, Arvind Krishnamurthy, Randolph Wang, “Modeling Hard-Disk Power Consumption”, Proc. FAST '03, 2003.
[9] Y.-H. Lu and G. de Micheli, Adaptive Hard Disk Power Management on Personal Computers, Proc. Ninth Great Lakes Symposium on VLSI, pages 50– 53, 1999.
[10] F. Douglis, P. Krishnan, and B. Bershad, Adaptive Disk Spin-Down Policies for Mobile Computers, Proc. USENIX Symp. on Mobile and Location-Independent Computing, pages 121–137, 1995. [11] Garg, R. Seung Woo Son Kandemir, M. Raghavan,
P. Prabhakar, R,Markov Model Based Disk Power Management for Data Intensive Workloads, Proc. 9th IEEE/ACM International Symposium on Clus-ter Computing and the Grid, 2009.
[12] Q. Zhu, Z. Chen, L. Tan, Y. Zhou, K. Keeton, and J. Wilkes, Hibernator: Helping Disk Arrays Sleep through the Winter, Proc. ACM Symposium on Op-erating Systems Principles, pages 177–190, 2005. [13] Charles Weddle, Mathew Oldham, Jin Qian, An-I
Andy Wang, PARAID: A Gear-Shifting Power-Aware RAID proc. 5th USENIX Conference on File and Storage Technologies, pp. 245–260, 2007. [14] Brandt S, Long D, A Hybrid Disk-Aware Spin-Down Algorithm with I/O Subsystem Support, Proc. IPCCC 2007, 2007.
[15] S. W. Son, G. Chen, M. Kandemir, Disk Layout Optimization for Reducing Energy Consumption, Proc. 19th annual international conference on Su-percomputing, 2005.
[16] Jun Wang, Huijun Zhu, Dong Li, eRAID: Con-serving Energy in Conventional Disk-Based RAID System, IEEE Transactions on Computers, Vol. 57, No. 3, Mar, 2008.
[17] Dong Li, Peng Gu, Hailong Cai, Jun Wang, EE-RAID: Energy Efficient Redundant and Inexpen-sive Disk Array, Proc. 11th ACM SIGOPS Europe-an Workshop, 2004.
![Figure 6 Measurement Framework [13]](https://thumb-us.123doks.com/thumbv2/123dok_us/1351769.2680853/8.918.481.806.893.1028/figure-measurement-framework.webp)