Methods and Applications
Chengqiang Huang
College of Engineering, Mathematics and Physical Sciences
University of Exeter
Submitted by Chengqiang Huang to the University of Exeter for the degree of
Doctor of Philosophy in Computer Science
This thesis is available for Library use on the understanding that it is copyright material and that no quotation from the thesis may be published without proper acknowledgement.
I certify that all material in this thesis which is not my own work has been identified and that no material has previously been submitted and approved for the award of a degree by this or
any other University.
Signature:...
I hereby declare that except where specific reference is made to the work of others, the contents of this dissertation are original and have not been submitted in whole or in part for consideration for any other degree or qualification in this, or any other university. This dissertation is my own work and contains nothing which is the outcome of work done in collaboration with others, except as specified in the text and Acknowledgements.
Chengqiang Huang June 2018
I would like to thank my supervisors, Prof. Geyong Min, Prof. Richard Everson, Dr. Yulei Wu and Prof. Yiming Ying for their kind helps and supports in supervising my works. In addition, I would like to thank Dr. Lejun Chen, Prof. Zhiwei Zhao, Dr. Ke Pei, Dr. Haozhe Wang, Dr. Wang Miao, Dr. Alma Rahat, Prof. Chunlin Wang, Prof. Yang Liu, Dr. Jia Hu, Mr. Jin Wang and Mr. Yuan Zuo for their helpful discussions and comments for my works.
In particular, I would like to thank my mom, Mrs. Shuijiao Zhang, my sister, Mrs. Yongjing Huang, and my lover, Dr. Jingya Liu, who always love me and support me. And I would like to have special thanks to Dr. Lejun Chen and Dr. Yimei Chen for being my greatest friends and mentors during my whole Ph.D. period. Also many thanks to Ms. Zhengxin Yu and Ms. Yang Mi for their supports and helps.
1. C. Huang, Y. Wu, G. Min, Y. Ying, Kernelized Convex Hull Approximation and its
Applications in Data Description Tasks,The 2018 International Joint Conference on
Neural Networks (IJCNN), accepted to appear, 2018.
2. C. Huang, Y. Wu, Y. Zuo, K. Pei, G. Min, Towards Experienced Anomaly Detector
through Reinforcement Learning,The 32nd AAAI Conference on Artificial Intelligence
(AAAI Student Abstract), accepted to appear, 2018.
3. C. Huang, G. Min, Y. Wu, Y. Ying, K. Pei, Z. Xiang, Time Series Anomaly Detection
for Trustworthy Services in Cloud Computing Systems, IEEE Transactions on Big
Data, accepted to appear, 2017.
4. C. Huang, Y. Wu, Y. Zuo, G. Min, Towards Practical Anomaly Detection in Network
Big Data,Big Data and Computational Intelligence in Networking, Y. Wu, F. Hu, G.
Min, A. Zomaya (editors.), Taylor & Francis/CRC, ISBN: 978-1498784863, Chapter 17, 2017.
5. Y. Zuo, Y. Wu, G. Min, C. Huang, X. Zhang, Distributed Machine Learning in
Big Data Era for Smart City, From Internet of Things to Smart Cities: Enabling
Technologies, H. Sun, C. Wang, B. Ahmad (editors.), Taylor & Francis/CRC, ISBN: 978-1498773782, Chapter 6, 2017.
6. C. Huang, Z. Yu, G. Min, Y. Zuo, K. Pei, Z. Xiang, J. Hu, Y. Wu, Towards Better
Anomaly Interpretation of Intrusion Detection in Cloud Computing Systems,IEEE
Anomaly detection is a fundamental research topic that has been widely investigated. From critical industrial systems, e.g., network intrusion detection systems, to people’s daily activi-ties, e.g., mobile fraud detection, anomaly detection has become the very first vital resort to protect and secure public and personal properties. Although anomaly detection methods have been under consistent development over the years, the explosive growth of data volume and the continued dramatic variation of data patterns pose great challenges on the anomaly detection systems and are fuelling the great demand of introducing more intelligent anomaly detection methods with distinct characteristics to cope with various needs. To this end, this thesis starts with presenting a thorough review of existing anomaly detection strategies and methods. The advantageous and disadvantageous of the strategies and methods are elaborated. Afterward, four distinctive anomaly detection methods, especially for time series, are proposed in this work aiming at resolving specific needs of anomaly detection under different scenarios, e.g., enhanced accuracy, interpretable results and self-evolving models. Experiments are presented and analysed to offer a better understanding of the performance of the methods and their distinct features. To be more specific, the abstracts of the key contents in this thesis are listed as follows:
• Support Vector Data Description (SVDD) is investigated as a primary method to fulfill accurate anomaly detection. The applicability of SVDD over noisy time series datasets is carefully examined and it is demonstrated that relaxing the decision boundary of SVDD always results in better accuracy in network time series anomaly detection. Theoretical analysis of the parameter utilised in the model is also presented to ensure the validity of the relaxation of the decision boundary.
• To support a clear explanation of the detected time series anomalies, i.e., anomaly interpretation, the periodic pattern of time series data is considered as the contextual information to be integrated into SVDD for anomaly detection. The formulation of SVDD with contextual information maintains multiple discriminants which help in distinguishing the root causes of the anomalies.
• In an attempt to further analyse a dataset for anomaly detection and interpretation, Convex Hull Data Description (CHDD) is developed for realising one-class classifi-cation together with data clustering. CHDD approximates the convex hull of a given dataset with the extreme points which constitute a dictionary of data representatives. According to the dictionary, CHDD is capable of representing and clustering all the normal data instances so that anomaly detection is realised with certain interpretation. • Besides better anomaly detection accuracy and interpretability, better solutions for
anomaly detection over streaming data with evolving patterns are also researched. Under the framework of Reinforcement Learning (RL), a time series anomaly detector that is consistently trained to cope with the evolving patterns is designed. Due to the fact that the anomaly detector is trained with labeled time series, it avoids the cumbersome work of threshold setting and the uncertain definitions of anomalies in time series anomaly detection tasks.
List of figures xv
List of tables xvii
Nomenclature xix
1 Introduction 1
1.1 What is an Anomaly? Outlier or Novelty? . . . 1
1.1.1 Types of Anomalies . . . 2
1.1.2 Types of Datasets and Contexts . . . 4
1.1.3 Types of Solutions . . . 5
1.1.4 Types of Applications . . . 7
1.2 Research Problems, Challenges and Objectives . . . 8
1.2.1 Problems and Challenges . . . 8
1.2.2 Objectives . . . 9
1.3 Thesis Outline and Contributions . . . 10
2 Related Work 13 2.1 Strategies for Anomaly Detection . . . 13
2.1.1 Rule-based Strategy . . . 14
2.1.2 Case-based Strategy . . . 15
2.1.3 Expectation-based Strategy . . . 17
2.1.4 Property-based Strategy . . . 19
2.1.5 Summary . . . 21
2.2 Techniques for Anomaly Detection . . . 22
2.2.1 Distance-based Methods . . . 23
2.2.2 Density-based Methods . . . 27
2.2.3 Boundary-based Methods . . . 32
2.2.5 Property-based Methods . . . 38
2.2.6 Discussion and Other Methods . . . 45
2.2.7 Summary . . . 47
2.3 Time Series Anomaly Detection . . . 49
2.3.1 Strategies for Time Series Anomaly Detection . . . 49
2.3.2 Techniques for Time Series Anomaly Detection . . . 50
2.3.3 Summary . . . 53
2.4 Conclusion . . . 53
3 Support Vector Data Description with Relaxed Boundary 55 3.1 Introduction . . . 55
3.2 Related Work . . . 58
3.2.1 Time Series Anomaly Detection . . . 58
3.2.2 Support Vector Data Description (SVDD) . . . 59
3.3 Relaxing Linear Programming Support Vector Data Description . . . 60
3.3.1 Linear Programming SVDD (LPSVDD) . . . 60
3.3.2 Relaxing LPSVDD (RLPSVDD) . . . 62
3.3.3 The Restriction of the Parameterρi . . . 64
3.3.4 Time Series Anomaly Detection . . . 67
3.4 Experiment Results . . . 69
3.4.1 RLPSVDD with Constrained Parameter . . . 69
3.4.2 Time Series Anomaly Detection . . . 72
3.5 Conclusion . . . 80
4 Support Vector Data Description with Contextual Information 81 4.1 Introduction . . . 81
4.1.1 Why is it Better to Treat Contextual Information Separately? . . . . 83
4.1.2 What is the Granularity of the Anomaly Interpretation? . . . 83
4.2 Related Work . . . 84
4.3 Anomaly Detection with Interpretation . . . 85
4.3.1 Linear Programming Support Vector Data Description . . . 85
4.3.2 Linear Programming Support Vector Data Description Plus . . . 85
4.4 Experiment Results . . . 87
4.4.1 Datasets . . . 87
4.4.2 General Settings . . . 88
4.4.3 Results . . . 89
5 Convex Hull Data Description 95
5.1 Introduction . . . 95
5.2 Related Work . . . 96
5.2.1 Data Description . . . 96
5.2.2 Convex Hull Analysis . . . 97
5.3 Convex Hull Data Description . . . 97
5.3.1 Problem Formulation . . . 97
5.3.2 Convex Hull Approximation . . . 98
5.3.3 Convex Hull Approximation with Gaussian Kernel . . . 100
5.3.4 Convex Hull Data Description (CHDD) . . . 103
5.4 Experiment Results . . . 109
5.4.1 One-class Classification . . . 109
5.4.2 Clustering . . . 111
5.5 Conclusion . . . 113
6 Towards Experienced Anomaly Detector with Reinforcement Learning 115 6.1 Introduction . . . 115
6.2 Related Work . . . 116
6.3 Problem Formulation . . . 117
6.4 System Architecture . . . 119
6.5 Discussion . . . 122
6.5.1 Time Series Anomaly Detection and Markov Decision Process . . . 123
6.5.2 Online Learning and Manual Time Series Labeling . . . 123
6.5.3 Active Learning and Automatic Labeled Time Series Generation . . 124
6.6 Experiment Results . . . 125
6.6.1 One-step MDP and Multi-step MDP . . . 125
6.6.2 Anomaly Detection with Similar Types of Time Series . . . 127
6.6.3 Anomaly Detection with Different Types of Time Series . . . 129
6.7 Conclusion . . . 132
7 Conclusion and Future Work 135
1.1 The taxonomy of anomalies . . . 3
1.2 The taxonomy of datasets . . . 5
1.3 The taxonomy of solutions . . . 6
1.4 Key contents of the thesis . . . 10
2.1 The rules and facts in a rule-based reasoning system . . . 15
2.2 The workflow of a case-based reasoning system . . . 17
2.3 The components of an expectation-based anomaly detection system . . . . 19
2.4 The basic idea of a feature correlation anomaly detection method . . . 20
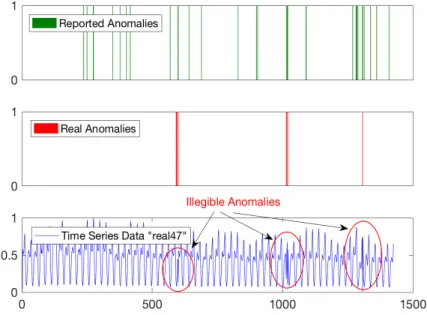
3.1 Anomaly detection over time series “real47” using SVDD . . . 56
3.2 LPSVDD in feature space with constrainta2+R2=1 . . . 62
3.3 The restriction of parameter selection in DSVDD and RLPSVDD . . . 64
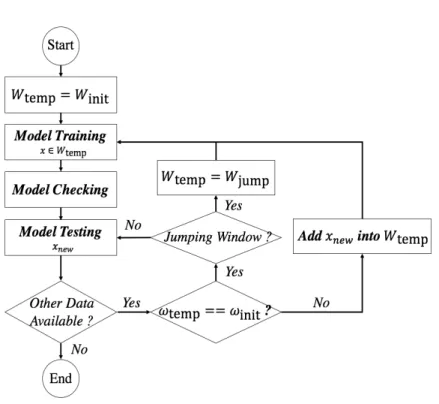
3.4 RLPSVDD-based time series anomaly detection workflow . . . 68
3.5 The comparison of all methods over Yahoo A1Benchmark . . . 78
3.6 The cases in which RLPSVDD wins/losses the competition . . . 79
4.1 An example of different anomalies . . . 82
4.2 The performance of LPSVDD+ over time series “syn54” in Yahoo A2Benchmark 91 4.3 The performance of LPSVDD+ over time series “TS63” in Yahoo A3Benchmark 93 5.1 Gaussian kernel space . . . 101
5.2 The performance of convex hull one-class classification in four toy datasets. (n=0.1×N, Gaussian kernelσ =0.3, better view in color) . . . 105
5.3 The performance of convex hull clustering in four toy datasets. (The first three subfigures usen=0.1×N and Gaussian kernelσ =0.2, while the last subfigure usesn=0.5×N and Guassian kernelσ =0.18, better view in color)107 6.1 The architecture of the proposed system . . . 120
6.3 Sample anomaly detection results by different MDPs . . . 126
6.4 Labeled time series datasets in A2Benchmark, A3Benchmark and A4Benchmark127
6.5 The results (F1-score) of anomaly detection in Yahoo A2Benchmark-A4Benchmark128
6.6 Labeled time series datasets in A1Benchmark . . . 129
6.7 The performance of the proposed method in Numenta dataset (Satisfactory) 133
2.1 A comparison of related surveys . . . 48
3.1 Practicality checking for different models Learned from Iris dataset . . . . 70
3.2 Methods to be compared with RLPSVDD . . . 74
3.3 RLPSVDD V.S. other methods in terms of F1-Score . . . 76
4.1 The parameters of using LPSVDD+ over Yahoo benchmarks . . . 89
4.2 The overall accuracy of using LPSVDD+ over Yahoo A2Benchmark . . . . 90
4.3 The overall accuracy of using LPSVDD+ over Yahoo A3Benchmark . . . . 92
5.1 The datasets for one-class classification . . . 109
5.2 The results (AUC) of one-class classification in UCI datasets . . . 110
5.3 The results (AMI) of clustering in UCI and CRAN datasets . . . 112
6.1 The specification of the prototype . . . 125
Acronyms / Abbreviations
AMI Adjusted Mutual Information
ANN Artificial Neural Network
AR Auto-regressive model
ARIMA Auto-regressive Integrated Moving Average model
ART Adaptive Resonance Theory
AUC Area Under the Curve
BDD Binary Decision Diagram
CHDD Convex Hull Data Description
COF Connectivity-based Outlier Factor
CRAN Comprehensive R Archive Network
DDoS Distributed Denial of Service
DRMF Direct Robust Matrix Factorisation
DSVDD Density-induced Support Vector Data Description
DT Decision Tree
ECG Electrocardiogram
EEG Electroencephalograms
EM Expectation-Maximisation
ESD Extreme Studentised Deviate
ES Exponential Smoothing
FFT Fast Fourier Transform
FN False Negative
FP False Positive
FSM Finite State Machine
GMM Gaussian Mixture Model
GP Gaussian Process
GPU Graphics Processing Units
GRNN Generalised Regression Neural Network
HMM Hidden Markov Model
HTM Hierarchical Temporal Memory
iForest Isolation Forest
KDE Kernel Density Estimation
KNN K-Nearest Neighbor
KPCA Kernel Principal Component Analysis
LDOF Local Distance-based Outlier Factor
LOF Local Outlier Factor
LPSVDD+ Linear Programming Support Vector Data Description Plus
LPSVDD Linear Programming Support Vector Data Description
LR Linear Regression
LSH Local Sensitive Hashing
LUPI Learning using Privileged Information
MA Moving Average model
MDP Markov Decision Process
MLE Maximum Likelihood Estimation
NMF Nonnegative Matrix Factorisation
NNLS Non-Negative Least Square problems
OCSVM One-class Support Vector Machine
PCA Principal Component Analysis
PDE Parzen Density Estimation
QP Quadratic Programming
RLPSVDD Relaxed Linear Programming Support Vector Data Description
RL Reinforcement Learning
RNN Recurrent Neural Network
RNN Replicator Neural Network
RPCA Robust Principal Component Analysis
RRI Rank-one Residual Iteration
Semi-NMF Semi-Nonnegative Matrix Factorisation
SOM Self-organising Map
SVDD Support Vector Data Description
SVM Support Vector Machine
SVR Support Vector Regression
SV Support Vectors
TN True Negative
TP True Positive
Introduction
Anomaly detection is a fundamental research topic that has gained much research attention in various application domains. From critical industrial systems, e.g., network intrusion detection systems, to people’s daily activities, e.g., mobile fraud detection, anomaly detec-tion has become the most critical and very first resort to protect and secure the public and personal properties. With the consistent development over the years, the gradual perfection of data collecting, cleaning and integrating have backed anomaly detection in diverse areas. Nevertheless, the explosive growth of data volume and the continued dramatic variation in data patterns pose great challenges on the anomaly detection systems and are fuelling the great demand of introducing more intelligent anomaly detection methods with distinct charac-teristics to cope with various needs of anomaly detection. Therefore, this thesis is dedicated to offering innovative anomaly detection methods with distinct features so as to suffice the specific requirements under varying anomaly detection scenarios. Before introducing the methods, this chapter firstly clarifies the related concepts of anomaly detection, e.g., outlier detection and novelty detection. Then, diverse aspects of anomaly detection, for example, the types of anomalies and the general taxonomy of methods, are further discussed. With the related concepts and taxonomy being addressed, the research problems, challenges and aims of this thesis are delivered. Finally, the outline of this thesis is presented.
1.1
What is an Anomaly? Outlier or Novelty?
Anomaly detection is a concept encompassing a broad spectrum of techniques concerning the detection of abnormality. In related literature, anomaly detection has different names, such as outlier detection, novelty detection, noise detection and deviation detection. These names are often used interchangeably. In this thesis, “anomaly detection” is utilised as a general term for all related names, while “outlier detection” and “novelty detection” are emphasised
as two primary distinct concepts in anomaly detection. To put it formally, assume a general datasetX ={x1,x2,· · ·,xn}withxi∈Rd,i∈ {1,2,· · ·,n}, where the notationsnanddare
the number and dimension of the data instances in the dataset, respectively. The following definitions are summarised to differentiate outlier detection from novelty detection.
Outlier Detectionis the process of the identification of an observationx∈X (or asubsetof the observationsXsub⊂X) which appears to be inconsistent with the
remainder of the given observationsX.
Novelty Detectionis the process of the determination of the novelty of anew
observationy(or observations) according to the known observationsX, where
y∈Rdandy∈/X.
It is now clear that the concept of anomaly detection involves1) the identification of
the abnormal data, e.g., noise or outlier, from the original dataset and2)the discovery of
novel data instances based on the knowledge learned according to the original dataset. From the perspective of machine learning, in outlier detection, the training dataset contains the anomalies that should be pinpointed, while, in novelty detection, the training dataset has no anomaly. In the latter scenario, it is the testing dataset that should be examined for anomalies. Therefore, outlier detection and novelty detection share prominent distinction. Nevertheless, due to the reasons that the term “anomaly detection” is generally used synonymously with “outlier detection” and “novelty detection”, and the solutions for anomaly detection, novelty detection and outlier detection often share similar principles, the related work of this thesis aims to consider all such detection schemes and variants.
1.1.1
Types of Anomalies
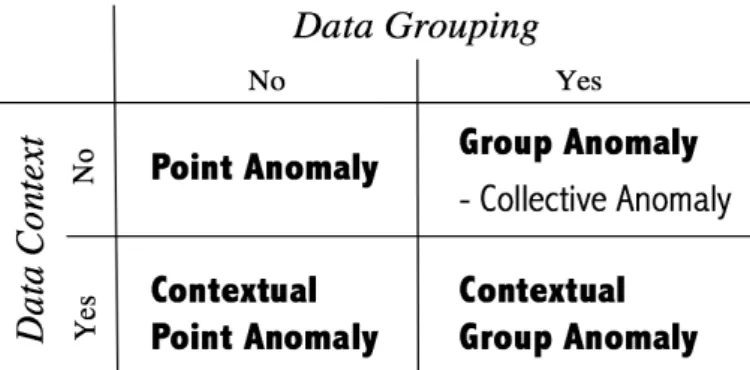
To the end of better understanding anomaly detection, the taxonomy of the types of anomalies is of fundamental importance. In [29] and [101], anomalies have been categorised into point anomaly, collective anomaly and contextual anomaly. A detailed analysis of this taxonomy reveals intense overlapping between the contextual anomaly and the collective anomaly, while point anomaly may also stem from its anomalous context. Hence, this thesis
categorises anomalies into four detailed classes:1) point anomaly, i.e., a data instance that
is much different from others; and2) group anomaly, i.e., a group of data whose patterns
or properties deviate significantly from similar groups of other data. When the contextual information is considered as the source data for anomaly detection, a detected point anomaly
is called a 3) contextual point anomaly and a group anomaly is a 4) contextual group
Fig. 1.1 The taxonomy of anomalies
• Point anomaly is an observationxorythat deviates remarkably from X according
to some predefined criteria, where x∈X andy∈/X. For instance, the absence of a
student in the Math lesson on Monday morning during the term time is a point anomaly, because, different from other students, the student is absent.
• Group anomalyis a set of observationsXoorYn, which is grouped based on a
prede-fined criterion, that does not follow the regular patterns of other sets of observations
according to certain definitions of the regular patterns, whereXo⊂X andYn⊈X. For
example, the absences of the students who sat in the first row of the classroom in the Math lesson on Monday morning during the term time is a group anomaly. This is due to the reason that other groups, e.g., the students sat in the second row, are present. • Contextual point anomalyis an observationxorythat deviates remarkably fromX
according to some predefined criteria under certain context, wherex∈X andy∈/X.
An example of this is the presence of a student in the classroom during the summer vacation. This is because although the presence of the student is usual, the time (context) when the student appears is unexpected.
• Contextual group anomalyis a set of observationsXoorYn, which is grouped based on a predefined criterion, that does not follow the regular patterns of other sets of observations according to certain definitions of the regular patterns under certain
context, whereXo⊂XandYn⊈X. Similarly, the presence of a student in the classroom
during a period of the summer vacation (a group of contexts) is unanticipated and regarded as a contextual group anomaly.
Note that the utilisations ofx,Xo and y,Yn in the explanations are to differentiate the
outlier detection and novelty detection. In reality, the types of anomalies, as well as other factors discussed later, are shared between outlier detection and novelty detection. Therefore, the uses ofyandYnare omitted later for brevity.
As shown in Fig.1.1, this categorisation emphasises the way in which anomalies are detected, i.e., from individual observations or groups of observations, and particularly stresses contextual information as a critical factor for the classification. It maintains point anomaly, collective anomaly (as a type of group anomaly) and contextual anomaly, but details the contextual anomaly according to data grouping. As a result, specific contexts can be examined for contextual anomaly detection upon diverse types of datasets, e.g., time series, graphs, videos and profiles. In the next part, the properties of various datasets are elaborated with the focus on the different contexts in anomaly detection.
1.1.2
Types of Datasets and Contexts
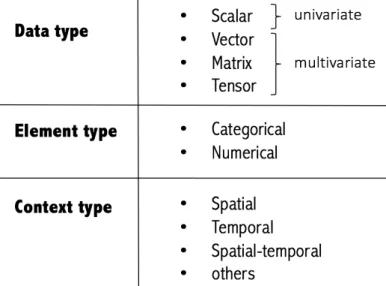
A key and fundamental aspect of any anomaly detection technique is the nature of the target dataset. Essentially, a dataset is a collection of data instances or observations. According to specific application scenarios, a data instance can be a number, record, video, song, graph, image, event, profile, etc. All these disparate forms of data should be transformed into general data types for the purpose of anomaly detection. Temporally, general data types comprise
1) scalar,2) vector,3) matrixas well as4) tensor, and their elements are known as data
attributes, features, or fields, which can be1) numericalor2) categorical. In literature, the
scalar is called univariate, while the vector, matrix and tensor are all multivariate data types. To sum up, the taxonomy of datasets from the two perspectives is shown in Fig.1.2.
Besides the original dataset, the contexts under which the data instances are observed are another crucial source of information that is helpful in detecting abnormal events/behaviors/etc. of a target system/object/etc. Usually, the contextual information is distinctive and not measured or recorded explicitly in different applications. The context that is helpful for anomaly detection is always obscure. Therefore, in this section, only ubiquitous contexts
are considered, i.e.,1) spatial context;2) temporal context;3) spatial-temporal context.
Specifically, spatial context concentrates on the location where a data instance is observed, while temporal context reveals the sequential information among observations. The integra-tion of the two contexts motivates the spatial-temporal context which has attracted much attention in recent years. To analyse contextual information in anomaly detection, two basic strategies exist. On one hand, feature engineering is adopted to consolidate the contextual information and the original information. A well-developed example is the time embedding technique for time series analysis in which temporal information is critical. On the other hand, contexts are analysed separately for contextual anomalies. For instance, the year-on-year growth of the financial income in a company instantiates the contextual information of previous incomes and can be investigated for contextual anomalies.
Fig. 1.2 The taxonomy of datasets
1.1.3
Types of Solutions
To provide a valid solution for anomaly detection, the concept of normality is strictly required. Only with a clear concept or definition of normality, the quantified measurement is achievable. In general, depending on the availability of manual definition of normality, i.e., data labels, the solutions for anomaly detection cover three fundamental categories: supervised, semi-supervised and unsemi-supervised methods:
• Supervised anomaly detectionmodels both normality and abnormality. It requires the availability of labels for the definitions of normality and abnormality. Consequently,
supervised anomaly detection is essentially aclassificationproblem that differentiates
normal data from the abnormal ones. Theoretically, supervised anomaly detection is superior in its overall accuracy due to the clear understanding of normality and abnormality. Nevertheless, some practical problems immensely hinder its utilisation. Firstly, the data labels are usually not available or extremely costly to obtain under many scenarios, e.g., the label of a configuration of a network is not entirely clear unless the network is practically run and examined. Secondly, the data labels may not be balanced. Typically, in practical anomaly detection problems, the normal samples greatly outnumber the abnormal ones, which results in a prominent bias in the classification model that may degrade the performance of anomaly detection. Lastly, the involvement of both normal and abnormal data may introduce more noise into the model, hence the disgraced performance.
Fig. 1.3 The taxonomy of solutions
• Semi-supervised anomaly detectionhas only normal data samples or only abnormal ones as the inputs. It endeavors to model a single concept and achieves anomaly detection according to the fitness of the data in the concept. Therefore, semi-supervised
anomaly detection constitutes aone-class classificationproblem. In comparison to
the classification problem, one-class classification requires only normal or abnormal samples, which is more feasible in reality. In addition, due to the sole type of samples, one-class classification negates the problem of imbalance dataset. The very problem concerning the dataset is the inaccurate or noisy data instances that ask for high robustness of the one-class classification methods.
• Unsupervised anomaly detection is typically employed in the situation where no prior knowledge of the dataset is known. In other words, no label information is presented. An anomaly detection method has to analyse the dataset to infer the real concept of abnormality or make an assumption of the concept. A concrete example
of this type is the set ofclustering-based anomaly detection methodswhich presume
the data that rest inside small clusters are prone to be anomalous. Unsupervised anomaly detection enjoys similar merits of semi-supervised anomaly detection, while it is always criticised because of the validity of the assumptions made in related tasks. Distinct scenarios have shown different preferences of the solutions. The three general types of anomaly detection solutions are offered according to the viability of the data labels, i.e., the input of an anomaly detection method. From another perspective, i.e., the output, current anomaly detection supports two typical types of solutions: methods that output
1) continuous scoresand2) discrete labels. The continuous score would be preferred by systems that demand detailed analysis of the data instances or favor the adaptive concept of abnormality, while the discrete label is more convenient for users and it greatly simplifies the anomaly detection system design in term of threshold setting for anomalies.
Here, categorisations of the anomaly detection solutions according to their input and output characteristics are presented (Fig.1.3). In chapter 2, a more detailed taxonomy of anomaly detection methods will be given according to the underlying techniques.
1.1.4
Types of Applications
Anomaly detection is a pivotal data analysis tool that finds extensive use in a wide variety of applications. From people’s daily life, e.g., health monitoring, to the normal operations of the government, i.e., intrusion detection, anomaly detection plays critical roles. A rough categorisation of the applications is presented in the following list which sorts the applications according to the number of required data sources and detection targets:
• Single data source, single detection target: Applications with a single data source for anomaly detection is comparatively easy to deal with. Such applications demand the preprocessing of a sole data type and have a clear idea of the target anomalies. Fraud detection, image novelty detection, meter monitoring and etc. are all instances of this type. Supplied with useful information, such as transaction records, normal images, meter readings and etc., an anomaly detection method should pinpoint anomalous transactions, novel images, erroneous meter readings and etc.
• Multiple data sources, single detection target: Anomaly detection applications with multiple data sources, e.g., health monitoring, behavior detection and city traffic monitoring, are relatively hard to analyse. They accept information from a number of data sources. For example, to support health monitoring, the electrocardiogram (ECG), electroencephalograms (EEG), blood pressure and etc. are acquired. The anomaly detection over all the information is to conclude with a single result of whether the monitored patient is healthy. Therefore, while the data sources are somewhat redundant, the detection target is clear.
• Multiple data sources, multiple detection targets: Applications, such as network intrusion detection or network fault diagnosis, require anomaly detection as the very fundamental tool to process data from diverse sources. The detections of anomalies in distinct data sources typically reflect different intrusions or faults within the target system. As a result, in systems where detailed analysis of anomalies are mandatory, the task of general anomaly detection covers multiple facets and is much more complex. An anomaly detection system or an anomaly diagnosis engine is demanded for higher level analysis, e.g., anomaly correlation analysis, in order to generate valuable guidance in network intrusion prevention or fault prevention.
Generally, the taxonomy above reflects the complexity of different applications. For simpler applications, the difficulties lie in the data preprocessing process and the anomaly detection process. While in more complex applications, the anomaly detection provides the basic information for further analysis. In both cases, the anomaly detection method plays the core role in the applications. This thesis will, therefore, investigate the most up-to-date anomaly detection methods/systems and existing research problems. Endeavors will be made to achieve practical anomaly detection in some applications.
1.2
Research Problems, Challenges and Objectives
1.2.1
Problems and Challenges
While many anomaly detection methods/systems are attractive and solid theoretically, a host of technological problems need to be overcome before they are practically adopted in various areas. These problems generally concern the accuracy, efficiency, and other capabilities, e.g., interpretability, scalability, etc. Despite the fact that many research efforts have been conducted in dealing with miscellaneous cases, this thesis particularly targets at three critical problems witnessed in time series anomaly detection applications and addressing corresponding difficulties:
• The high false alarm rate: In systems where time series analysis is required, the false alarm rate of an anomaly detection method is a vital criterion for deciding its applicability. In critical systems, such as the automatic driving system in an airplane, false alarms are strictly unacceptable. However, many existing anomaly detection methods have high false alarm rates especially when the target environment is noisy. Therefore, better methods are urgently demanded. To achieve better accuracy in anomaly detection, supervised learning is always preferred. However, the availability of labeled data is usually a major issue that hinders the utilisation of supervised learning methods. In addition, training datasets always contain noise that introduces degraded accuracy in sensitive anomaly detection methods. Last but not least, the normal or abnormal patterns are often inexhaustive. The differentiation of normality from abnormality is a challenging problem in the presence of limited patterns. All these difficulties contribute to the doubtful guarantee of the accuracy in anomaly detection. • The simplified analysis of contextual information: The contextual information, e.g., periodicity and trending, in time series analysis is essential for the determination of time series anomalies. Traditional methods typically consider specific contexts and do
not generalise in dealing with novel contexts. For instance, time series differencing is a specific technique for trending analysis in applications such as sales prediction, but it does not consider the periodicity within the time series. Therefore, investigating a general method that is capable of adaptively analysing different contexts is another attractive research problem. For distinct application domains, the exact notions of the contexts are always different. Applying a contextual anomaly detection technique developed in one domain to another is generally not straightforward. Moreover, in a specific domain, various contexts exist such that pinpointing the most useful context for anomaly detection is not an easy task. Furthermore, the criteria for detecting different contextual anomalies usually vary significantly. As a result, although attractive the in-depth analysis of contextual information is very challenging.
• The incapability of handling dynamic data patterns: In online time series analysis, the pattern of the time series always evolves along with the change of the underlying system. For example, the pattern of the metric which measures the speed of the engine in a car changes according to the behavior of the car. However, few existing methods are capable of handling dynamically changing data patterns of a sequential dataset, especially when the new patterns are unknown. This has raised a hot research problem in applications such as intrusion detection systems where intruders exhibit diverse/changing patterns of intrusion behaviors. General speaking, the dynamicity is a dominant issue concerning the analysis of sequential data. In many domains, normal behavior keeps evolving and the concept of normality is temporary. Therefore, it requires the incremental updating of the anomaly detection model to keep the pace with the evolvement of the notion of normality. Nonetheless, not all the anomaly detection methods support incremental data analysis. And the design of an incremental anomaly detection method is not a painless task.
1.2.2
Objectives
This thesis aims at proposing practical methods for anomaly detection and particularly targets at easing the aforementioned challenges in time series anomaly detection scenarios. More
specifically, methods will be introduced to1)enhance the accuracy of time series anomaly
detection in network systems, 2)analyse contextual information and anomalies for better
anomaly interpretation and3)cope with the challenge of dynamicity in sequential anomaly
Accuracy
Contextual Information
& Anomaly Analysis
Chapter 3. Support Vector Data Description
with Relaxed Boundary
Chapter 4. Support Vector Data Description
with Contextual Information
Chapter 5. Convex Hull Data Description
Chapter 6. Towards Experienced Anomaly Detection
with Reinforcement Learning
Anomaly
Detection
Dynamicity
Fig. 1.4 Key contents of the thesis
1.3
Thesis Outline and Contributions
In this chapter, the introduction of the related contents of general anomaly detection has been elaborated. From the next chapter (Chapter 2), detailed related works and state-of-the-art anomaly detection methods will be thoroughly surveyed. The contributions to the family of anomaly detection methods follow from Chapter 3 to Chapter 6 (see Fig.1.4).
• Chapter 2 presents a thorough review of anomaly detection strategies and techniques. For general anomaly detection, four major strategies are identified and five categories of specific techniques are summarised. On the other hand, two basic strategies and four types of techniques are elaborated for time series anomaly detection. This review builds a solid background for the methods proposed in this thesis.
• Chapter 3 proposes an anomaly detection method that relaxes Support Vector Data Description (SVDD) with additional information for better anomaly detection perfor-mance. More specifically, the method adopts linear programming method to implement SVDD and relaxes its anomaly detection boundary for network time series anomaly detection. The experiment results demonstrate that the method greatly enhances the overall accuracy of time series anomaly detection.
• Besides the desire for better accuracy, practical applications introduce additional requirements in the actual network anomaly detection process, e.g., the needs for analysing contextual information and classifying the anomalies for different responses. Consequently, Chapter 4 considers specific contextual information in network time series and suggests contextual SVDD in order to integrate the information in anomaly detection for time series anomaly classification.
• In Chapter 3 and Chapter 4, SVDD is the leading method to be utilised in time series anomaly detection with distinct improvements. However, considering the situation where the anomaly detection method is expected to not only identify the anomalies but also cluster or classify the anomalies into different categories such that differ-ent responses could be initiated accordingly, SVDD is not the best choice. Hence, Chapter 5 develops Convex Hull Data Description (CHDD) that succeeds in one-class classification and clustering at the same time.
• In both SVDD, CHDD and many other methods, there is a significant limitation that these methods require an inconvenient process of parameter tuning. As a result, in complex problems, a large amount of human labor is required for tuning the parameters, which is undesirable and has made many methods impractical. Moreover, in situations where the data patterns are dynamically evolving, the manual tuning of the parameters is impossible. To ease the problem, Chapter 6 recommends a framework for parameter-free sequential data anomaly detection based on Reinforcement Learning (RL). The framework not only supports parameter-free anomaly detection but also dynamically evolves the anomaly detection method to learn novel data patterns.
To summarise with the key contents, this thesis researches the problem of anomaly detection, especially time series anomaly detection, and advises a number of novel methods to promote anomaly detection from diverse facets. The proposed methods are expected to contribute positively to the family of anomaly detection and prompt more valuable im-provements for practical anomaly detection. In the next chapter, a comprehensive review of existing solutions for anomaly detection is provided. In addition to this, each primary chapter also makes some extra efforts to explain its contributions and most related works to make clear the contents in the chapter.
Related Work
In Chapter 1, an overview of the anomaly detection related concepts, e.g., outlier detection and novelty detection, is presented coupled with the research problems, challenges and aims of this thesis. In this chapter, a comprehensive review of existing anomaly detection strategies and methods is provided. Anomaly detection strategies are high-level and abstract methodologies that guide the process of anomaly detection, while anomaly detection methods concern the detailed techniques and tools that are employed for data analysis. This chapter starts with the introduction of anomaly detection strategies (Section 2.1) and elaborate various types of anomaly detection methods afterward (Section 2.2). Because time series anomaly detection is a key topic in this thesis, related methods for time series anomaly detection are surveyed separately in Section 2.3. Section 2.4 briefly discusses the outline of the remaining contents in this thesis.
2.1
Strategies for Anomaly Detection
According to different scenarios, distinct anomaly detection strategies exist. Generally, there
are four types of anomaly detection strategies: 1)rule-based anomaly detection; 2)case
-based anomaly detection; 3)expectation-based anomaly detection; and 4)property-based
anomaly detection. These four strategies correspond to distinct sets of anomaly detection methods and are applied under different scenarios. The rule-based strategy concentrates on identifying explicit/implicit rules to distinguish anomalies from normal data instances. The case-based strategy, on the other hand, tries to pinpoint a relevant case of the target case in order to analyse its abnormality. The expectation-based strategy generates an expected concept of the normality/abnormality which is utilised for anomaly detection, while the property-based anomaly detection investigates the latent properties among all the data and determines the abnormality based on the properties.
2.1.1
Rule-based Strategy
The rule-based strategy is generally applicable in a wide variety of domains. A typical instan-tiation of the rule-based strategy is a rule-based anomaly detection system that encompasses a set ofrules, a bunch of facts and an interpreter for applying the rules and facts. In a specific application, the corresponding facts are always determined. It is the rules that are to be learned in order to support accurate anomaly detection. On one hand, the rules are usually designed by human experts who possess strong knowledge of how to determine anomalies in the specific application. On the other hand, rules can be learned according to labeled datasets through classification methods, e.g., Decision Tree (DT) [220] and Support Vector Machine (SVM) [38]. The choices of how to design the rules vary in different application domains. However, the essential idea of the rule-based anomaly detection, i.e. applying discovered rules to identifying anomalies, is identical.
The rule-based strategy is the basic standpoint of many methods discussed in later sections. The generalised concept of “a rule” includes the underlying models in various classifiers, one-class classifiers and many other anomaly detectors. From a high standpoint of view, the rule-based strategy has two potential concerns that may hinder its practical applications:
• Complicated or novel data instances may escape the rule-based anomaly detection
system due to theinaccuracy or absence of the corresponding rules;
• Static rules in the rule-bases anomaly detection system may not adapt well to the
evolving data patterns.
As one shall see shortly, these concerns are not severe in other strategies and different methods do not share common solutions to the above problems. Therefore, methods that root on the rule-based strategy have to consider the potential problems independently. The robustness and the capability of incremental learning in different methods are two critical research topics that are attracting more and more attention.
An Example - Rule-based Reasoning System
In network systems, conventional rule-based reasoning systems [87] are pervasive in traffic control systems and intrusion detection systems. Consider a simple paradigm as in Fig.2.1, the rule-based reasoning system contains a set of rules and a set of facts that are both determined by expert experience. Also, an additional inference engine is responsible for anomaly detection based on the reasoning according to the rules and facts. Such rule-based reasoning systems are always efficient in detecting simple network problems and easily acceptable by most engineers.
Fig. 2.1 The rules and facts in a rule-based reasoning system
However, in traditional rule-based reasoning systems, rules are often built relying on expert knowledge. It is apparent that 1) the rules are impossible to exhaust such that new problems can circumvent the system easily; 2) with the growth of the number of rules, they are becoming increasingly hard to maintain; 3) the rules added by different experts may conflict with each other [232], which undermines the consistency of the entire system. These problems have promoted the innovations of the form of rules and the systems. Methods, such as DT, are designed to learn rules based on different models which refrain from certain aforementioned drawbacks.
2.1.2
Case-based Strategy
Distinct from the rule-based strategy which summarises a relatively concise knowledge for
anomaly detection, the case-based strategy seeks relativecasesof a target case to help with
anomaly identification. At a first glance, the concept of the case-based strategy is highly related to nearest neighbor based methods which determine the abnormality of a data instance based on the analysis of its nearest neighbors. However, the case-based strategy is more powerful in the applications where the target object is complicated and concluding the rules for anomaly detection is cumbersome. For instance, a user profile dataset is rather complex in the sense that it contains multiple types of data, e.g., image information, categorical information, numerical information and etc. As a result, summarising rules for anomaly detection becomes troublesome and ineffective. The case-based strategy is, therefore, more suitable that it focuses on the identification of similar cases of the target case and largely reduces the size of the relevant data for analysis. In many complex applications, e.g., network anomaly detection [213][214], identifying the close related cases is the very first step that greatly boosts the process of anomaly detection.
The case-based strategy has driven some practical methods that are widely in use. A detailed method that implements case-based strategy is the K-Nearest Neighbor (KNN) method [2] which has numerous applications. Another high-level instance is the signature-based anomaly/object detection methods that have been adopted in many real-life scenarios [137][169]. The details of the related methods will be elaborated in Section 2.2.
Although regarded as a promising resort in complicated applications, the case-based strategy is not without its drawbacks. There always exist two primary concerns that should be taken into consideration while utilising the case-based strategy:
• The case-based strategy involves computing the similarities between the target case and
all the other cases, which incurssignificant computational complexity, especially
when the number of cases is huge and the similarity measurement is relatively complex. • The case-based anomaly detection strategy greatly relies on the similarity measurement
between two cases. A good similarity measurement helps with the effective differentia-tion between normal and abnormal cases, while a bad similarity measurement largely degrades the performance. In many applications with complex data, such as graphs
and sequences,defining an effective measurement could be really challenging.
Despite the concerns, the case-based strategy does maintain nice properties that, as the number of cases keep increasing, the anomaly detection process gains more and more confidence in its decisions. It naturally supports streaming data and enhances its capability with the increment of the dataset.
An Example - Case-based Reasoning System
A case-based reasoning system [124] vividly implements the case-based anomaly detection strategy and largely avoids the limitations in the rule-based reasoning systems. The essential idea of a case-based reasoning system is to represent former problem-solving experience as cases which are stored in a centralised library. Confronted with a new problem, the system retrieves similar cases and summarises valuable information to solve the current problem. The novel experience with the proposed solution is to be confirmed and added to the library for future reference. 1) With the accumulation of informative cases, the system adaptively evolves according to the experience; 2) the solutions of the previous cases can be generalised to offer solutions to unseen problems; and 3) the whole system does not require extensive maintenance experience. To be more concrete, Fig.2.2 depicts the workflow of a typical case-based reasoning system. Four major steps are involved:
• Retrieval: This step retrieves relevant cases from the case library in order to solve a target problem. A comprehensive case could contain the description of a problem, its solutions and other related information, while a simple case could be a single data instance along with its label;
Fig. 2.2 The workflow of a case-based reasoning system
• Reuse: The reuse of the relevant cases is to summarise valuable information from previous solutions of relevant problems and determine the solution for the current problem;
• Revision: The solution is revised in this step according to the specifications of the current problem. It outputs a revised solution for testing;
• Retention: If the revised solution successfully solves the current problem, the case, i.e., the problem and its solution, is retained in the case library.
Within the four steps, the retrieval of the relevant cases is of high significance. It is also the step which consumes most computation resources and demands effective similarity measurements. The complexities of the steps of reuse and revision, however, vary under diverse scenarios. Overall the process of anomaly detection using the case-based reasoning system is greatly simplified due to the detached steps, which is suitable for different groups of experts to work on in an attempt to solve complex anomaly detection problems, e.g., network anomaly detection in which a case contains complex network information and network anomaly descriptions.
2.1.3
Expectation-based Strategy
The expectation-based strategy features in the utilisation of the expected concept of normality
to determine anomalies. In other words, whenever a data instance is beyondexpectation, it is
regarded as anomalous. Generally speaking, the expected concept of normality comes in two distinct forms:
• Data probability, which connects intensely to information theoretic methods that analyse the probability of the occurrence of a specific data instance;
• Data estimation, which has been widely implemented by regression and reconstruction methods to measure the error between the actual data and the estimated data.
In data probability analysis, distributions of normal data are analysed and formulated to assign the probability of a data instance being anomalous. However, in data estimation, the expected data values are calculated directly from normal data regardless of their probabilities. These two forms can also be unified to supply probabilistic estimation of the concept of normality. The choice of these forms depends heavily on the applications. As a concrete example, in time series prediction for anomaly detection, a probabilistic estimation of a future value presents not only the expected value but also the variance so that providing the confidence for the prediction. On the other hand, in multimodal data anomaly detection, estimating the mean of the dataset is not profitable but measuring the mixed probabilistic distribution can be much more helpful.
Although different in form, data probability analysis and data estimation share the same principle that they extract knowledge from the given dataset and obtain the distances between expectations and realities. The distances are further analysed through a thresholding process to determine the eventual anomalies. This expectation-based strategy is straightforward to understand and extensively applied in applications where the data show stable patterns. For instance, in problems such as online time series anomaly detection, expectation-based anomaly detection is always the very first strategy to be considered, especially when the time series demonstrates strong patterns, e.g., periodic patterns, that are beneficial for prediction. However, the expectation-based strategy is not without its drawbacks. The two most prominent problems concerning the employment of the strategy are:
• The performance of the methods in data probability analysis and data estimation always
rely on the model used for fitting the training dataset. An unbefitting model will consume extra computational power and result in poor performance.
• Expectation-based anomaly detection typically asks for a thresholding process to
determine the eventual anomalies. Nevertheless, the selection of the threshold is
nontrivial and application-specific, which causes potential troubles for accurate anomaly detection.
An Example - Expectation-based Anomaly Detection System
Generally, an expectation-based anomaly detection system consists of four components as shown in Fig.2.3. 1) The training dataset contains only the original data instances with no label. It is responsible for training the selected model which is expected to generalise and fit the testing dataset. 2) The testing dataset has the identical format of the training dataset and is exploited to examine the validity of the learned model. 3) The data estimation or probability analysis model is the core component of the system. During the training phase,
Fig. 2.3 The components of an expectation-based anomaly detection system
the model takes the training dataset as input and tunes the model parameters to fit the dataset as closely as possible, e.g., likelihood maximisation and error minimisation, while in the testing phase the model takes the testing dataset as input and outputs anomaly scores of the data instances, e.g., reconstruction errors/residuals and data probabilities. 4) The anomaly scores are examined by a thresholding component for the ultimate decisions of anomaly detection. Usually, the threshold is assigned as a byproduct of the trained model. Nonetheless, in many applications where no label is provided for the determination of anomalous data, obtaining a practical threshold can be troublesome and always desires online adjustment.
To illustrate the concrete examples of data estimation and probability analysis, consider firstly the Replicator Neural Network (RNN) [94], i.e., a fully connected neural network whose inputs and outputs are the same and the size of the hidden layer is smaller than that of the input and output layers. The neural network is trained such that its outputs mimic the inputs as closely as possible, i.e., reconstructing the inputs. During the testing phase, the reconstruction errors/residuals between the inputs and outputs are calculated with a chosen measurement to reflect the distances between the tested data and their corresponding expectations. On the other hand, consider the Gaussian Mixture Model (GMM) [14] which exploits multiple Gaussian distributions to fit a given dataset during the training phase and outputs the probability of a data instance belonging to the mixed distribution during the testing phase. GMM essentially interprets the expectation of data using the data probabilities derived from the learned distribution. The probabilities, therefore, constitute anomaly scores for ultimate anomaly detection.
2.1.4
Property-based Strategy
Besides the aforementioned strategies, a relatively novel anomaly detection strategy which is
based on the latentpropertiesin data instances attracts increasing attention in recent years.
This property-based strategy assumes that there always exist static or stable properties in the system that generates the target dataset. With the identification of the properties, they
Fig. 2.4 The basic idea of a feature correlation anomaly detection method
can be employed as the criterion to differentiate normal data instances and abnormal ones, i.e., abnormal data instances will not exhibit certain properties indicating that they are not generated by the underlying system. Armed with the assumption, a number of methods have been proposed to mine the latent properties. Two representative examples are 1) feature correlation, which explicitly finds the stable internal relationship among data features; and 2) data compression, which implicitly measures the normal amount of information hidden in the data. Therefore, as long as a data instance violates the stable internal relationship or the normal amount of information, it is pinpointed as anomalous.
Feature correlation and data compression are only two inchoate methods that await further investigation. There are many other techniques that have been well developed, such as Principal Component Analysis (PCA) [102], Kernel Principal Component Analysis (KPCA) [202] and etc. All these methods recognise certain properties of the dataset and leverage these properties for the purpose of anomaly detection. If the properties are accurately identified, the methods always exhibit extraordinary performance. Unfortunately, two practical issues have made the applications of the methods difficult:
• Given a random dataset,pinpointing the best property to extract is a troublesome
task. Typically, no preference of methods can be made without examining their actual
performances.
• Determining the violation of a certain property can be tricky. For instance, in feature correlation, the change of the relations among the features can be hard to measure due to the varied intensity and existence of the relations.
An Example - Feature Correlation Analysis
Consider the example in Fig.2.4 where feature correlation is employed as the key property to identify anomalies [81][211][103]. The circles are features and the link between two circles represents the intense correlation between the features. The triangle and connected links indicate the relation among several features.
On the left part of Fig.2.4, a stable set of feature correlations is recognised from the training dataset as a benchmark graph to define normality. Whenever the normal set of feature correlations is largely violated in a data instance, e.g., the right part of Fig.2.4 where the correlations among features A, B and C are corrupted, it is highly suspicious that the data instance is anomalous. This workflow is intuitionistic and features in the way that 1) it achieves feature selection through the process because the features which have no relation to others are not helpful for anomaly detection and can be ignored; 2) the analysis of the feature correlations reveals the internal relationship among the features, which supports the better understanding of the data and benefits the application. For instance, with the solid feature correlations found, missing feature values can be estimated through a predictive model using their related features. Therefore, feature correlation analysis is attractive in applications that require anomaly detection with numerous irrelevant features and missing feature values.
2.1.5
Summary
In this section, four diverse strategies, i.e., rule-based, case-based, expectation-based and property-based strategies, are presented for the purpose of anomaly detection. All these strategies have their individual policies for anomaly detection and possess disparate advan-tages and disadvanadvan-tages. In distinct applications, the most suitable strategy varies. For general datasets with no evident feature, the rule-based strategy is generally applicable and currently implemented in many industrial systems. The case-based strategy, however, works more efficiently in complex systems where the target datasets of anomaly detection carry various types of features each of which is complicated to analyse. On the other hand, the expectation-based strategy is made straightforward when dealing with sequential datasets and datasets with stable patterns. When it comes to systems that generate data with certain properties, e.g., high-dimensional data with internal feature correlation, the property-based strategy is more advisable. Besides all these strategies, it is believed that more strategies are possible in the area of anomaly detection that further exploration should be consistently made in order to discover strategies with beneficial attributes.
In Section 2.2, the representative techniques for anomaly detection are classified into several categories according to the detailed technical features. It is worth noting that a specific technique could implement various strategies. In other words, strategies are relatively high-level tactics that may overlap with each other in achieving anomaly detection.
2.2
Techniques for Anomaly Detection
Under the umbrella of anomaly detection, the solutions [90] are typically categorised into
three aspects according to the type of the input (Section 1.1.3): 1) supervisedanomaly
detection, 2)unsupervisedanomaly detection and 3)semi-supervisedanomaly detection.
As mentioned earlier, supervised anomaly detection has access to both normal and abnormal data. Therefore, the essence of a supervised anomaly detection problem is a classification problem that endeavors in distinguishing abnormality from normality. On the other hand, unsupervised anomaly detection gains no access to the exact labels of the given dataset. It achieves anomaly detection through identifying the shared patterns among the data instances and observing the outliers. Hence, the task of unsupervised anomaly detection is intensely
related tooutlier detection. In addition, Semi-supervised anomaly detection accepts normal
or abnormal dataset and determines the concept of normality or abnormality for anomaly detection. Consequently, semi-supervised anomaly detection is more prone to solving the
task ofnovelty detection.
With a detailed examination, it is obvious that the methods for unsupervised/semi-supervised anomaly detection are universally applicable in anomaly detection problems because 1) supervised anomaly detection can be easily divided into two semi-supervised anomaly detection problems, which model the concept of normality and abnormality, respec-tively; 2) by assuming that a sampled portion of the given dataset is normal or abnormal then examining the remaining data, unsupervised anomaly detection is converted to semi-supervised anomaly detection with some computational expenses. Inversely, semi-semi-supervised anomaly detection is solvable through unsupervised anomaly detection with the aggrega-tion of labeled and unlabeled data. As a result, this secaggrega-tion focuses mainly on the review of unsupervised/semi-supervised anomaly detection methods, e.g., one-class classification methods, and does not make a clear distinction between the methods for outlier detection and novelty detection. The specific methods for supervised anomaly detection, i.e., classification-based anomaly detection, can be found in other related surveys [101][3][29]. Moreover, due to the fact that multi-dimensional datasets are more pervasive in applications, this section targets methods with the capability to cope with the high-dimensional datasets and omits the conventional statistical data analysis methods, e.g., 3-sigma [168], boxplot rule [96] and etc.
For the rest of this section, five categories of anomaly detection methods are detailed. Firstly, the underlying assumptions of these methods are described. Detailed methods are then elaborated with their corresponding advantages and disadvantages, which lead to the improvements upon various facets of the methods, such as robustness, effectiveness and etc. Possible research topics and directions are briefly discussed.
2.2.1
Distance-based Methods
Investigating the distances among data instances has been one of the primary approaches to reveal outliers or novelties in anomaly detection. Although the broad spectrum of distance-based anomaly detection methods always vary in the ways they measure the distance and how they calculate the anomaly score, they all share the same following assumption:
Assumption:Normal data instances are close to their neighbors, while anoma-lies are far away from their neighbors.
Within the assumption, 1) the definition of the distance between two data instances and 2)
the determination of the term“close”, i.e., the ways to assign anomaly score, according to
the measurement are essential to anomaly detection.
The Definition of the Distance
Over the years, researchers have proposed numerous methods of distance measurement [49]. Typical measurements include Euclidean distance, i.e.,
DEuclidean= v u u t d
∑
i=1 ∥xi−yi∥2, and Mahalanobis distance [148], i.e.,DMahalanobis=
q
(x−y)TΣ−1(x−y),
wherexand y are twod-dimensional column vector data instances; xi and yi are the i-th
elements ofxandy, respectively.T denotes the transpose of the column vector. Σis a matrix
that governs the distance measurement.
Although Euclidean distance and Mahalanobis distance are widely applicable in most cases, there are situations where data features are not numerical, which requires novel distance measurement methods. For instance, categorical data ask for different distance measurement methods, such as simple matching, that are more suitable. Interested users are recommended to refer to [19] or [231] for a detailed list of the measurements for numerical, categorical and mixed data. Besides numerical data, categorical data and the mixture of these two, other data types, e.g., image, graph, sequence and etc., may demand more complex distance measurements. Investigations have been conducted individually in corresponding domains [42][114][173].
The Determination of the Anomaly Score
With an appropriate definition of the distance, the distance-based anomaly detection methods leverage the distance information to assign anomaly score for each data instance under examination. A key distinction of these methods is their determination of the anomaly
score. One may use the longest distance to theK nearest neighbors of a data instance as
the anomaly score, utilise the mean or median of the distances to all the other data as the anomaly score, turn the numerical scores into probabilistic scores, or analyse and summarise all the distances and simply output binary anomaly score for each data instance. Methods,
such as [2],directlyemploy the information of distances to assign anomaly scores, while
[98] and many other distance-based clustering methods apply the information to firstly form
clusters andindirectlypoint out anomalies afterward. An informative survey about the direct
and indirect usage of the distance information for anomaly detection is presented in [29]. The direct and indirect utilisations of the information of data distances help categorise distance-based anomaly detection methods into two classes. However, a more helpful taxonomy would be dividing the methods according to the general computational expense used in calculating the distances:
1. Measure the distance from a data instance to all the other data instances. Due to the vast number of distance calculations, this always consumes considerable com-putational resources. Typical examples of this kind involve nearest neighbor-based methods, such as [2][145];
2. Measure the distance from a data instance to a concise set of targets or data instances. The size of the concise set is normally several orders of magnitude smaller than that of the original dataset, which enormously reduces the computational expense. A very intuitive example is the K-means clustering method [98].
Example -k-th Nearest Neighbor Anomaly Detection
A traditional distance-based anomaly detection method is to use the distance from a point to itsk-th nearest neighbor. For instance, in [188], the definition of an outlier is given based on
the distance to thek-th nearest neighbor:
Dkn Outlier: “Given an input data set with N points, parameters n and k, a point p is a Dknoutlier if there are no more than n−1other points p′such that Dk(p′)>Dk(p).”1