Crack Growth Rate and Fracture
Toughness Tests on Irradiated
Cast Stainless Steels
ANL‐12/56
Crack Growth Rate and Fracture
Toughness Tests on Irradiated
Cast Stainless Steels
Y. Chen, B. Alexandreanu, and K. Natesan
Nuclear Engineering Division
Argonne National Laboratory
A. S. Rao, NRC Project Manager
Abstract
Cast austenitic stainless steels are used in the cooling system of light water reactors for
components with complex shapes, such as pump casings, valve bodies, and coolant piping. In the present study, crack growth rate and fracture toughness JR curve tests were performed on irradiated cast stainless steels in low-corrosion-potential environments (low-dissolved-oxygen high-purity water or simulated pressurized water reactor environment) at 320°C. Both as-received and thermally aged materials were included to investigate the combined effect of thermal aging and irradiation embrittlement on the fracture behavior of cast stainless steels. The samples were irradiated to approximately 0.08 dpa at the Halden reactor. Good resistance to corrosion fatigue and stress corrosion cracking was observed for all samples. Thermal aging had little effect on the crack growth behavior at this dose level. Cleavage-like fracture was the dominant cracking morphology during the crack growth rate tests, and the ferrite phase was deformed to a lesser extent compared with the surrounding austenite phase. The fracture toughness results showed a dominant effect of neutron irradiation, and the fracture resistances were decreased considerably for all cast specimens regardless of their thermal aging conditions. The reduction in fracture toughness was more significant in the unaged than thermally aged materials. Nonetheless, the fracture toughness values of thermally aged specimens were about 30% lower than their unaged counterparts, suggesting a combined effect of thermal aging and neutron irradiation in cast stainless steel.
Contents
Abstract... iii
Figures... vii
Tables... xi
Executive Summary ... xiii
Acknowledgments... xv
Acronyms and Abbreviations ... xvii
1 Introduction... 1
2 Experimental ... 5
2.1 Materials and Specimens ... 5
2.2 Irradiation... 7
2.3 Test Facility ... 9
2.4 Crack Growth Rate and Fracture Toughness JR Curve Tests... 10
2.4.1 Crack Growth Rate Test... 10
2.4.2 Fracture Toughness JR Curve Test ... 12
2.4.3 Fractographic Examination... 14
3 Results... 15
3.1 CF-3 Cast Stainless Steel... 15
3.1.1 Unaged CF-3 Cast Stainless Steel... 15
3.1.2 Thermally Aged CF-3 SS... 32 3.2 CF-8 Stainless Steel ... 42 3.2.1 Unaged CF-8 SS ... 42 3.2.2 Thermally Aged CF-8 SS... 52 3.3 CF-8M Stainless Steel... 61 3.3.1 Unaged CF-8M ... 61
3.3.2 Thermally Aged CF-8M CASS ... 71
4 Discussion... 82
4.1 Cyclic Crack Growth Rates ... 83
4.2 Constant-load Crack Growth Rates ... 87
4.3 Fracture Toughness... 88
5 Summary ... 91
Figures
1. Metallurgical images of the unaged and thermally aged CASS materials... 6
2. Schematic of 1/4T-CT specimen used in this study (red lines represent electrical leads). ... 7
3. Irradiation capsule of low-dose Halden irradiation. ... 8
4. Recirculation water loop for Cell 1 of the IML (items in red are safety significant components) ... 10
5. Schematic for inducing environmentally assisted cracking in test environment... 12
6. Crack-length-vs.-time plot for specimen A-1 (0.08-dpa unaged CF-3 with 24% ferrite): test periods (a) a-e, (b) f-j, (c) k-m, and (d) 1... 17
7. Cyclic CGRs of Specimen A-1. ... 18
8. Fracture surface of specimen A-1 tested in PWR water. ... . 20
9. Fracture surface of specimen A-1 along the sample central line. ... 21
10. Cleavage fracture in specimen A-1: (a) pre-cracking, and (b) end of the CGR test. Crack propagation from bottom to top. ... 22
11. Fracture surface of specimen A-1 showing that delta ferrite deformed to a lesser extent than austenite. Crack propagation from bottom to top. ... 23
12. Crack-length-vs.-time plot for specimen A-2 (0.08-dpa unaged CF-3 with 24% ferrite) tested in low-DO high-purity water environment: test periods (a) a-e, (b) f-j, (c) k-o, (d) p-s, and (e) 1-2. ... 25
13. Cyclic CGRs of Specimen A-2. ... 27
14. The J-R curve for specimen A-2... 28
15. Fracture surface of Specimen A-2 tested in low-DO high-purity water... . 29
16. Fracture surface of specimen A-2 along the sample central line. ... 30
17. Cleavage steps at the beginning of CGR test of Specimen A-2. Crack propagation from bottom to top... 31
18. Fracture surface of specimen A-2 showing that ferrite deformed to a lesser extent than austenite. Crack propagation from bottom to top... 31
19. Ductile dimple morphology in the JR test region of specimen A-2. Crack propagation from bottom to top... 32 20. Crack-length-vs.-time plot for specimen B-1 (0.08-dpa aged CF-3 with 24% ferrite)
23. The J-R curve for specimen B-1. ... 38
24. Fracture surface of specimen B-1 tested in PWR water. ... . 39
25. Fracture surface of Specimen B-1 along the sample central line... 40
26. Cleavage steps in the pre-cracking region of specimen B-1. Crack propagation from bottom to top. ... 41
27. Delta ferrite at dendrite cores in specimen B-1. Crack propagation from bottom to top... 41
28. Fracture surface of specimen B-1 showing that delta ferrite is surrounded by heavily deformed austenite phase. Crack propagation from bottom to top. ... 42
29. Crack-length-vs.-time plot for specimen E-1 (0.08-dpa unaged CF-8 with 23% ferrite): test periods (a) a-d, (b) e-f, (c) g-j, (d) k-o, and (e) p-2. ... 44
30. Cyclic CGRs of Specimen E-1. ... 46
31. The JR curve of specimen E-1. ... 47
32. Fracture surface of specimen E-1 tested in low-DO high-purity water. ... . 48
33. Fracture surface of specimen E-1 along the sample central line. ... 49
34. Cleavage cracking at the beginning of the CGR test of specimen E-1. Crack propagation from bottom to top... 50
35. Cyclic CGR test region of specimen E-1. Crack propagation from bottom to top... 50
36. Smooth fracture surface at the end of the CGR test in specimen E-1. Crack propagation from bottom to top... 51
37. Ductile dimple fracture in the J-R test region of specimen E-1. Crack propagation from bottom to top... 51
38. Crack-length-vs.-time plot for specimen F-1 (0.08-dpa aged CF-8 with 23% ferrite): test periods (a) a-f, (b) g-j, (c) k-m, and (d) 1. ... 53
39. Cyclic CGRs of Specimen F-1... 54
40. SCC CGRs of unaged and aged CF-8 CASS with 23% ferrite irradiated to 0.08 dpa. .. 55
41. The J-R curve of specimen F-1... 55
42. Fracture surface of specimen F-1 tested in low-DO high-purity water. ... . 57
43. Fracture surface of specimen F-1 along the sample central line... 58
44. Fracture surface of the CGR region in specimen F-1. Crack propagation from bottom to top... 59
45. Cleavage steps in austenite grain around ferrite phase in the CGR test region of specimen F-1. Crack propagation from bottom to top. ... 60
46. Dimple fracture in the JR test region of specimen F-1. Crack propagation from bottom to top. ... 60
47. Crack-length-vs.-time plot for specimen I-1 (0.08-dpa unaged CF-8M with 28%
ferrite): test periods (a) a-f, (b) g-k, (c) l-o, (d) q-r, (e) s-v, (f) w-z, (g) aa-ac, and (h) 1. 63
48. Cyclic CGRs of specimen I-1. ... 66
49. The JR curve of specimen I-1. ... 67
50. Fracture surface of specimen I-1 tested in low-DO high-purity water. ... . 68
51. Fracture surface of specimen I-1 along the sample central line... 69
52. Precracking region in the CGR test of specimen I-1. Crack propagation from bottom to top... 70
53. Fracture surface at the end of CGR test of specimen I-1. Crack propagation from bottom to top. ... 70
54. Heavily deformed microstructure in the JR test region of specimen I-1. ... 71
55. Crack-length-vs.-time plot for specimen J-1 (0.08-dpa aged CF-8M with 28% ferrite): test periods (a) a-g, (b) h-n, (c) o-r, (d) s-u, (e) 1, and (f) 2. ... 73
56. Cyclic CGRs of specimen J-1. ... 75
57. SCC CGRs of unaged and aged CF-8M CASS, irradiated to 0.08 dpa... 75
58. The JR curve of specimen J-1... 76
59. Fracture surface of specimen J-1 tested in low-DO high-purity water... . 78
60. Fracture surface of specimen J-1 along the sample central line. ... 79
61. Precracking region of specimen J-1. Crack propagation from bottom to top... 80
62. Ferrite microstructure at the end of CGR test of specimen J-1. Crack propagation from bottom to top... 80
63. Cleavage fracture at the end of CGR test of specimen J-1. Crack propagation from bottom to top. ... 81
64. Fracture along ferrite at dendrite core in the JR test region of specimen J-1. Crack propagation from bottom to top... 81
65. Best-fit curves of cyclic CGRs at 0.08-dpa dose: (a) unaged and aged CF-3, (b) unaged and aged CF-8, and (c) unaged and aged CF-8M. ... 85
66. Fitting coefficient A for the corrosion fatigue superposition model... 86
67. Constant-load CGRs of the low-dose CASS with more than 23% ferrite in low-DO high-purity and PWR water environments... 88 68. Fracture toughness values of unirradiated and irradiated CASS in unaged and aged
Tables
1. Chemical compositions of the cast stainless steels examined in this study... 5 2. Thermal aging conditions for the cast stainless steels in this study... 5 3. Test matrix of low-dose CASS specimens irradiated at the Halden reactor... 15 4. Crack growth rates of specimen A-1 (0.08-dpa unaged CF-3 sample with 24%
ferrite) in PWR water. ... 16 5. Crack growth rates of specimen A-2 (0.08-dpa unaged CF-3 with 24% ferrite) in
low-DO high-purity water environment... 24 6. CGR test of specimen B-1 (0.08-dpa aged CF-3 with 24% ferrite) in PWR water... 33 7. CGR test of specimen E-1 (0.08-dpa unaged CF-8 with 23% ferrite) in low-DO
high-purity water. ... 43 8. Crack growth rates of specimen F-1 (0.08-dpa aged CF-8 with 23% ferrite) in a
low-DO high-purity water environment... 52 9. Crack growth rates of specimen I-1 (0.08-dpa unaged CF-8M with 28% ferrite) in
a low-DO high-purity water environment. ... 62 10. Crack growth rates of specimen J-1 (0.08-dpa aged CF-8M with 28% ferrite) in a
low-DO high-purity water environment... 72 11. CGR and JR curve test results at 320°C for 0.08-dpa CASS specimens with high
Executive Summary
Cast austenitic stainless steel (CASS) is used in the cooling system of light water reactors for components with complex shapes, such as pump casings, valve bodies, coolant piping, control rod guide tube spacers, etc. In contrast to a fully austenitic microstructure of wrought stainless steel (SS), CASS consists of a ferrite-austenite duplex microstructure. A certain amount of delta ferrite phase is intentionally designed into CASS and SS weld metals to engineer against hot cracking. However, the ferrite phase is vulnerable to thermal aging embrittlement after long-term exposure to reactor coolant. In addition, neutron irradiation can decrease the fracture resistance of CASS significantly. It is suspected that a combined effect of thermal aging and irradiation embrittlement could reduce the fracture resistance even further to a level neither of these degradation mechanisms can impart alone. While the thermal aging embrittlement of CASS has been studied extensively, there are no data available at present with regard to the combined effect of thermal aging and irradiation embrittlement. A test program has been initiated to investigate the joint effect of thermal aging and irradiation damage on the cracking susceptibility and fracture resistance of CASS.
Crack growth rate (CGR) and fracture toughness JR curve tests were conducted on three grades of CASS (CF-3, CF-8 and CF-8M) containing high levels of delta ferrite (>23%). These samples were irradiated at the Halden reactor to a low dose of 0.08 displacements per atom (dpa) or 5.56 x 10¹⁹ n/cm2 (E > 1MeV). Both as-received and thermally aged specimens were included to determine the combined effect of thermal aging and irradiation embrittlement. The CGR tests were conducted in a low dissolved oxygen (DO) high purity water environment or a pressurized water reactor (PWR) environment at 320°C. Following the CGR tests, the fracture toughness JR curve tests were performed on the same samples in the test environments.
Cyclic CGRs and constant-load CGRs were measured to evaluate the corrosion fatigue and stress corrosion cracking (SCC) of the CASS specimens. In the cyclic CGR tests, environmental
enhanced cracking was more difficult to establish in these CASS specimens than in wrought SSs. In SCC CGR tests, only moderate CGRs, in the range of 10-11 m/s, were recorded in the CASS specimens regardless of their thermal aging history. In general, the CASS materials showed good resistance to both corrosion fatigue and SCC at the 0.08 dpa dose level. Transgranular cleavage-like cracking was the dominant fracture mode during the CGR tests, and the ferrite phase was often deformed to a less extent compared with its surrounding austenite phase. This observation supports the hypothesis that the beneficial effect of ferrite for SCC resistance arises in part from the high plastic deformation stress of ferrite phase.
A previous study showed that the CGRs of thermally aged CASS were one order of magnitude higher than that of unaged materials at high DO concentrations (>1 ppm). In contrast, a similar cracking behavior between thermally aged and unaged materials was observed for irradiated specimens in the low-DO high-purity water and simulated PWR environments. The lack of
Neutron irradiation significantly affected on the fracture toughness of CASS. At 0.08 dpa, the fracture toughness values of unaged specimens were about one third of their initial unirradiated values. An additional 30% reduction in fracture toughness was also observed for thermally aged specimens after irradiation. This observation suggests an interaction between thermal aging and irradiation damage. When both conditions of thermal aging and irradiation damage are present, the combined effect is not a simple addition of both degradations. The interaction between thermal aging and irradiation damage can lead to different damage on CASS materials, reducing the fracture resistance to a higher extent than either one of them can achieve alone. Neutron irradiation appears to affect not only the kinetics of thermal aging embrittlement, but also the lower bound values of fracture toughness (i.e., the saturation state). For this reason, the effects of neutron irradiation should be considered when the degree of thermal aging embrittlement is being evaluated for CASS components.
The unirradiated CASS results presented in the current report were obtained from 1T-CT
specimens tested in air at 290°C. However, the irradiated CASS results were obtained from 0.25 T-CT specimens in low-corrosion-potential environments at 320°C. To facilitate a more direct comparison, the staff will test unirradiated CF-8 and CF-8M—unaged and aged—using 0.25T-CT specimens in low-corrosion-potential environments at 320°C. Once these tests are
Acknowledgments
The authors would like to thank Drs. O. K. Chopra and W. J. Shack for their invaluable contribution to this project. Our special thank go out to Ms. T. M. Karlsen, OECD Halden Reactor Project, Halden, Norway, for reactor irradiation experiments and sample transfer. L. A. Knoblich, E. E. Gruber, R. Clark, and E. J. Listwan of Argonne, Y. Yang of University of
Florida, and J. Pakarinen and Y. Huang of University of Wisconsion-Madison are acknowledged for their contributions to the experimental effort. We are also grateful to Drs. R. Tregoning and W. J. Shack for their careful reviews and comments on the manuscript. This work is sponsored by the Office of Nuclear Regulatory Research, U.S. Nuclear Regulatory Commission, under Job Code N6519; Program Manager: A. S. Rao.
Acronyms and Abbreviations
ASTM American Society for Testing and Materials BWR Boiling Water Reactor
CASS Cast Austenitic Stainless Steels CGR Crack Growth Rate
CT Compact Tension
DCPD Direct Current Potential Drop
DO Dissolved Oxygen
ECP Electrochemical Potential
HWC Hydrogen Water Chemistry
IASCC Irradiation-Assisted Stress Corrosion Cracking IGSCC Intergranular Stress Corrosion Cracking IML Irradiated materials Laboratory
LVDT Linear Voltage Displacement Transducer LWR Light Water Reactor
NWC Normal Water Chemistry
PPU Periodical Partial Unloading
PWR Pressurized Water Reactor
SCC Stress Corrosion Cracking SEM Scanning Electron Microscopy
Units of Measure
°C degrees centigrade cm centimeter
dpa displacement per atom hr hour
J joule m meter mm millimeter MPa megapascal ppb part per billion ppm part per million
psig pound per square inch gauge s second
1 Introduction
Stainless steel is an important class of engineering materials used in light water reactors (LWRs). While the main structure of reactor core internals is constructed from wrought stainless steels (SSs), components with complex shapes, such as pump casings, valve bodies, coolant piping, elbows, and control rod guide tube spacers, are often made of cast austenitic stainless steels (CASS).1 The CF grades of CASS whose compositions are similar to those of 300-series
austenitic SSs are the most widely used corrosion-resistant CASS. The CF-3 and CF-8 grades contain nominal 19% Cr and 9% Ni and are the cast equivalents of Types 304L and 304 SSs, respectively. Meanwhile, the CF-3M and CF-8M grades are the molybdenum-containing cast versions of 316L and 316 SSs, respectively. Like their wrought equivalents, the CF grades of CASS possess excellent corrosion resistance and mechanical properties,2 and thus are ideal for
LWR applications in aqueous environments. The strength and ductility of CF grades are
comparable to those of wrought SSs. At room temperature, the yield and tensile strengths of CF-3 and CF-8 grades are greater than 200 MPa and 480 MPa,3 respectively, similar to those of
solution-annealed SSs. A good combination of strength and ductility also gives rise to excellent fracture toughness. Stable tearing occurs in CASS samples well above their yield strength before final fracture. Chopra and Sather 4 showed that the fracture toughness of CF-3 and CF-8 CASS
varies from ~200 kJ/m2 to over 1000 kJ/m2 at room temperature; these values are comparable to those of wrought SSs reported by Mills.5
In contrast to the fully austenitic microstructure of wrought SSs, CASS consists of a ferrite-austenite duplex microstructure. It is common that a certain amount of ferrite is present along with austenite () in the solidification microstructure such as CASS or weld metals. The precise fractions of ferrite and austenite phases depend on the chemical composition and casting thermal history. Experimental methods, such as quantitative metallography and ferromagnetic
measurement, can be used to determine the ferrite content in CASS or weld metals.6,7 Empirical
models have also been developed to predict and control phase content with alloy composition. Based on the phase-stabilizing effects of Cr and Ni in Fe-Cr-Ni systems, several constitution diagrams have been established to estimate phase content.8,9,10 The contributions of minor
alloying elements are incorporated with Cr and Ni equivalent numbers and computed with empirical equations. The applicable range of composition, incorporated alloying elements, and weighing factors vary in these models, and thus the predicted phase contents differ among them to some extent.11 For steel castings of CF grades, use of the Scheofer diagram, which is a
modified version of the Schaeffler diagram8, is recommended by the American Society for
Testing and Materials (ASTM) for estimating ferrite content.12
The ferrite phase is critical for the mechanical properties and corrosion resistance of CASS and weld metals. Since hardening mechanisms by thermal-mechanical treatments cannot be easily implemented in castings, the strength of CASS mainly relies on the ferrite-austenite duplex microstructure. Beck et al. 13showed that the tensile and yield strengths of CASS increase with
corrosion cracking (SCC).15 In susceptible environments, CASS tends to be more resistant to
SCC than the same grade of wrought SS. This beneficial effect of ferrite was clearly demonstrated by Hughes et al.16 in boiling water reactor (BWR) environments. Using slow
strain rate tests, they showed that CF-3, CF-3A, and CF-8 have an exceptional resistance to intergranular SCC (IGSCC) in high-purity (HP) water containing 6-8 ppm dissolved oxygen (DO).
While the presence of ferrite in CASS is mostly beneficial, ferrite phase can also exert a detrimental effect on the fracture resistance of CASS under certain conditions. Exposed to temperatures of 300-500°C, ferrite phase is vulnerable to a low-temperature thermal aging phenomenon known as “475°C embrittlement”.17,18 The consequences of the thermal aging embrittlement are an increased tensile strength and reduced ductility.19,20 The upper-shelf
impact energy is also reduced, and the ductile-to-brittle transition temperature shifts higher.20
Because of thermal aging embrittlement, the long-term performance of CASS materials at elevated service temperatures is of concern. The degradation of CASS components resulting from thermal aging embrittlement has been recognized as a potential issue for aging reactors.21
Several research programs have been conducted to assess Charpy impact properties and JR resistance curves of thermally aged CASS.22,23 It was found that thermal aging at 290-450°C up to 30,000 hr leads to a significant deterioration in the fracture properties of CASS. The lower bound of impact energy and fracture toughness (JIC) can be as low as 20 J/cm2 and 25 kJ/m2, respectively, at room temperature. The ductile-to-brittle transition temperature of CASS is also shifted to around 0°C for the thermally aged CASS. The extent of the thermal aging
embrittlement increases with ferrite content and is sensitive to ferrite morphology.22
The mechanism of thermal aging of duplex SSs has been studied extensively.17-20, 22-28 It is
widely accepted that embrittlement is caused by the instability of the ferrite phase under thermal aging. The main reasons of the hardening and loss of toughness are (1) the formation of Cr-rich
’ phase through spinodal decomposition and (2) the precipitation and growth of carbides and G-phase at ferrite-austenite G-phase boundaries. Obviously, these microstructural changes are
thermally activated and are fundamentally controlled by solid-state diffusion. Therefore, the thermal aging time for a given extent of degradation (e.g., an increase in hardness or decrease in toughness) follows an Arrhenius-type relationship.24
Besides thermal aging, neutron irradiation can also affect the microstructural evolution of CASS profoundly. Under fast neutron bombardment, lattice atoms in a crystalline material are
displaced from their original sites by cascade damage. An avalanche of lattice displacements gives rise to point defect supersaturation, which does not exist under thermal equilibrium.29,30
These point defects evolve at irradiation temperatures to form irradiation defects, giving rise to irradiation hardening and embrittlement. The irradiation embrittlement can generate further degradation in the ferrite phase, leading to an additional loss of fracture toughness. Furthermore, the presence of nonequilibrium point defects in irradiated microstructures can enhance the transportation of solutes in materials by radiation-enhanced diffusion.30 The elevated diffusivity
effect of irradiation embrittlement and thermal aging could not only produce a higher degree of embrittlement, but also affect the rate of degradation development.
While the thermal aging embrittlement of CASS has been studied extensively, very limited data exist in the open literature for neutron-irradiated CASS.5,31,32 Two tests conducted on thermally
aged and irradiated CF-8M showed a higher degree of embrittlement in the CASS material than wrought SSs.31 It is not clear however if the simultaneous exposure to irradiation and thermal
aging would reduce the fracture resistance to a lower level than either of the degradation mechanisms can impart alone. If so, the combined effect is not only important for internal components made of CASS, but also for SS weld metals that possess a similar austenite-ferrite duplex microstructure. While weld metals may contain less ferrite phase than that in CASS materials, a minimum ferrite content is usually specified for weld metals to engineer against hot cracking. Thus, weld metals may be subjected to the same type of degradation as CASS. A better understanding of the combined effect of thermal aging and irradiation would also be helpful to address issues concerning weld metals.
In the current study, several CF grades of CASS were irradiated to approximately 0.08 displacements per atom (dpa). Both as-received and thermally aged specimens are included. Fracture toughness JR curve tests were conducted on these samples to assess the extent of embrittlement resulting from neutron irradiation and thermal aging. Additionally, crack growth rate (CGR) tests were carried out prior to the fracture toughness tests in low electrochemical potential (ECP) environments to evaluate their SCC performance. At 0.08 dpa, significant irradiation embrittlement of ferritic materials is anticipated, but little effect either on
embrittlement or stress corrosion susceptibility of austenitic materials would be expected. Thus the current work is focused on the effects of thermal aging and irradiation on the ferrite phase. At higher irradiation levels, additional effect would occur due to embrittlement and increased SCC susceptibility of austenitic phase. Since elevated susceptibility to irradiation-assisted stress corrosion cracking (IASCC) is unlikely at this low dose level, the SCC CGR test was short in the present study. Still, the CGR tests could provide corrosion fatigue starter cracks for the
subsequent fracture toughness JR curve tests, so that any environmental contribution to the fracture behavior of CASS could be detected.
2 Experimental
2.1 Materials and Specimens
Three experimental heats of corrosion-resistant CASS (CF-3, CF-8, and CF-8M) were obtained from a previous ANL research program.4 The CASS heats are static cast slabs with dimensions
of 610 x 610 x 76 mm. A ferrite scope measurement on these heats showed that the CF-3 and CF-8 heats contained approximately 24% delta ferrite, and the CF-8M heat had 28% delta ferrite. Table 1 gives the compositions of these materials. Both as-received (or unaged) and thermally aged specimens were prepared from these heats. The thermal aging conditions are given in Table 2. Figure 1 shows metallurgical images of the CASS materials used in this study. The samples were polished with SiC papers up to 1200 grit. After a final finish with 1 μm diamond slurry, the polished surfaces were etched with ferric chloride. Both the unaged and thermally aged microstructures are similar, as shown in Fig. 1. Note that a slight decline in ferrite content was reported for all grades of CASS after thermal aging.4 For the aging conditions used in the current study (10,000 hr at 400°C), the decrease in ferrite content is insignificant. Thus, the average ferrite contents were considered unchanged after thermal aging.
Table 1. Chemical compositions of the cast stainless steels examined in this study. Composition (wt. %)
Cast Grade Ferrite content a Heat ID. Mn Si P S Mo Cr Ni N C CF-3 24% 69 0.63 1.13 0.015 0.005 0.34 20.18 8.59 0.028 0.023 CF-8 23% 68 0.64 1.07 0.021 0.014 0.31 20.46 8.08 0.062 0.063 CF-8M 28% 75 0.53 0.67 0.022 0.012 2.58 20.86 9.12 0.052 0.065
a. Measured with a ferrite scope, Ref. [4].
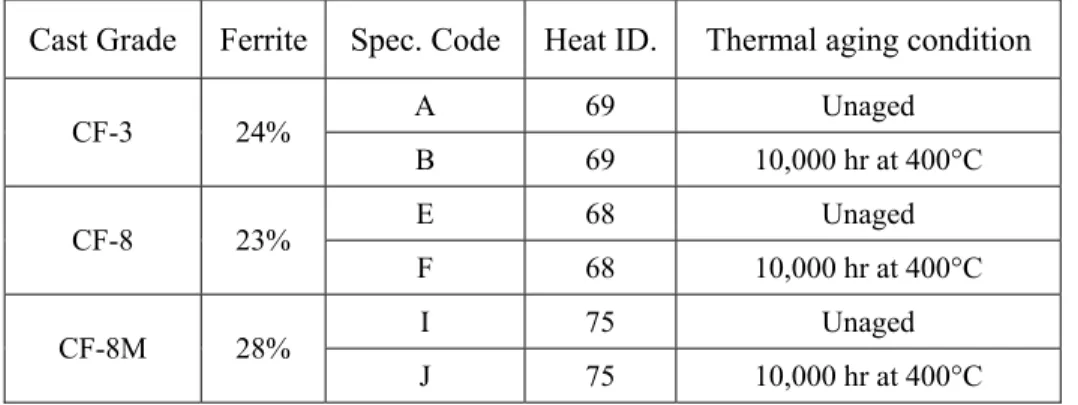
Table 2. Thermal aging conditions for the cast stainless steels in this study. Cast Grade Ferrite Spec. Code Heat ID. Thermal aging condition
A 69 Unaged CF-3 24% B 69 10,000 hr at 400°C E 68 Unaged CF-8 23% F 68 10,000 hr at 400°C I 75 Unaged CF-8M 28% J 75 10,000 hr at 400°C
CF-3, 24% unaged CF-3, 24% , aged
CF-8, 23% unaged CF-8, 23% aged
CF-8M, 28% unaged (from ref. [4] ) CF-8M, 28% aged Figure 1. Metallurgical images of the unaged and thermally aged CASS materials.
Constrained by irradiation space, sub-sized compact tension (CT) specimens were used in this study. The sample was about 6.5-mm thick (i.e., 1/4T-CT) and 14 mm high. The starter notch size was about 6 mm. To ensure an in-plane crack growth, side grooves approximately 5% of the thickness were machined on both sides of the sample. Figure 2 is a schematic of the sample used in this study. The red lines in the figure are electrical leads spot-welded on the specimen.
Figure 2. Schematic of 1/4T-CT specimen used in this study (red lines represent electrical leads).
2.2 Irradiation
All samples were irradiated in a helium-filled capsule in the Halden reactor, a boiling heavy water reactor in Norway. Figure 3 shows the assembly of the irradiation capsule. Some disk-shaped samples for transmission electron microscopy analyses were also included in a cylindrical container in the irradiation capsule (item 7 in Fig. 3). The irradiation temperature was ~315°C, and two sets of melting alloy temperature monitors (item 5) were installed in the irradiation assembly.
During the irradiation experiment, three fluence monitor wires (Fe, Ni and Al/Co alloy) were placed outside the irradiation capsule. After the irradiation, dosimetry was performed by the Halden researchers on these wires. Using the activation cross sections determined previously, they estimated the accumulated neutron fluence for the irradiation capsule. The obtained fast
4. End Guide S leeve 8. S pac er 3. Heat Transfer Body
7. TEM Specimens Contain
er 2. Outer Capsule 6. CT Spec imen s 1. End Plug 5. Mel ting Alloy Assembly
Figure 3. Irradiation capsule of
low-dose Halden irrad ia tion. 33
2.3 Test Facility
Two servo-hydraulic mechanical test systems located in the Irradiated Materials Laboratory (IML) at Argonne National Laboratory were used in this study. The IML is a radiological facility equipped with four air-atmosphere beta-gamma hot cells. The hot cells are maintained at a negative pressure with respect to the surroundings to maintain a proper radiological barrier. The two test systems are installed in separate hot cells. Each of the hot cells is equipped with its own loading frame, autoclave, load cell, linear voltage displacement transducer (LVDT), Instron control console, and data acquisition system.
In the current study, the tests were performed either in a simulated pressurized water reactor (PWR) environment or in a low-DO high-purity water environment. Both environments have low corrosion potentials, which are known to reduce the sensitivity of SSs to IASCC.34 The
simulated PWR water contained ~2 ppm lithium, ~1000 ppm boron, and ~2 ppm hydrogen. The conductivity was about 20 S/cm. The low-DO high-purity water contained less than 10 ppb dissolved oxygen and the conductivity was kept below 0.07 S/cm during the tests. The test environments were provided by two water recirculation loops, and a schematic diagram of loop #1 is shown in Fig. 4. Each loop consists of a storage tank, a high pressure pump, a regenerative heat exchanger, an autoclave, an ECP cell, a back-pressure regulator, two ion-exchange
cartridges, and several heaters. The pressure section of the loop extends from the high-pressure pump (item 13 in Fig. 4) through the back-high-pressure regulator (item 10 in Fig. 4). The rest of the loop is kept at low pressure. Over-pressurization of the high-pressure portion of the system is prevented by two rupture disks (items 3 and 15 in Fig. 4) located at the downstream of the high-pressure pump. The autoclaves are one-liter Type 316 stainless steel autoclaves and rated to 2900 psig for 350°C. The hot cell #1 loop is a PWR water system, and hydrogen is used as cover gas. A hydrogen leak detection/alarm unit (items 36 - 38 in Fig. 4) is installed. For the hot cell #2 loop, a low-corrosive-potential environment is simulated in high-purity water using a mixture of nitrogen with 4% hydrogen as cover gas. For both systems, water is circulated at a rate of 20-30 mL/min through the autoclaves. The water conductivity and pH can be monitored with inline sensors. During the tests, the temperature and pressure of the autoclaves were kept at ~320°C and ~1800 psig, respectively.
1. Autoclave 15. Rupture disk 29. Solenoid valve 2. Autoclave preheater 16. Pressure transducer 30. Excess flow valve 3. Rupture disk 17. High pressure gauge 31. Low-pressure regulator 4. ECP preheater 18. Conductivity sensor 32. Check valve
5. ECP cell 19. pH sensor 33. Vacuum & pressure gauge 6. Check valve 20. Solenoid valve 34. Pressure relief valve 7. Air Cooled Coil 21. Feedwater storage tank 35. Flash arrestor
8. Heat exchanger 22. Sparge tube 36. Hydrogen alarm control panel 9. Chilled block 23. Tank recirculation pump 37. Hydrogen leak sensors 10. Back-pressure regulator 24. Check valve 38. Hydrogen leak sensors 11. Ion exchange cartridge 25. Ion exchange cartridge V = Valve
12. Pressure relief valve 26. Cover gas supply cylinder T = Thermocouples 13. High-pressure pump 27. High-pressure regulator
14. Accumulator 28. Flash arrestor
Figure 4. Recirculation water loop for Cell 1 of the IML (items in red are safety significant components)
2.4 Crack Growth Rate and Fracture Toughness JR Curve Tests 2.4.1 Crack Growth Rate Test
All CGR tests in this study were performed on the 1/4T-CT samples described above. Crack extensions were monitored with the direct current potential drop (DCPD) method during the tests. With this method, four electrical leads were spot welded on the CT sample (red lines shown in Fig. 2). A constant current was passed through the sample, and the potential drop across the crack mouth was measured and related to the crack extension of the CT sample with a calibrated correlation curve.
The CGR tests were carried out in either a simulated PWR water environment or a low-DO high-purity water environment.
A typical CGR test is started with cyclic loading to pre-crack the sample in the test environment. A load ratio around 0.2-0.3, frequency of 1-2 Hz, and maximum stress intensity factor (Kmax) between 10 and 16 MPa m1/2 are used for pre-cracking. The objective of this step is to generate a sharp fatigue crack and to advance the crack tip passing beyond the area close to the machine notch. The properties at this area may have been altered by machining and do not represent the material’s intrinsic behavior.
The stress intensity factor K for a CT specimen is calculated by:
1/ 2 3/ 2 (2 / ) ( ) ( N ) (1 / ) P a W a K f B B W a W W (1)
where P is applied load; B is the specimen thickness; BN is the net specimen thickness (or
distance between the roots of the side grooves); a is crack length; and W is specimen width
(measured from the load line to the back edge of the specimen). The geometry factor [f(a/W)] for a CT specimen is:
2 3 4 ( ) 0.886 4.64a a 13.32 a 14.72 a 5.60 a f W W W W W (2)
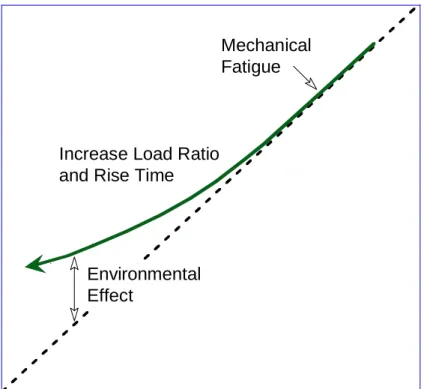
Once a fatigue crack is initiated, a series of test steps is carried out with gradually increased rise times and load ratios. The measured CGRs in these test steps include the contributions from both mechanical fatigue and corrosion fatigue. With the change in loading conditions, the contribution of mechanical fatigue is gradually reduced while the environmental effect is
enhanced. Figure 5 illustrates the principle of introducing environmentally assisted cracking in a test. The changes in test conditions should produce cyclic CGRs along the green line. The cyclic CGR test is transitioned to a SCC CGR test when a significant environmental enhancement is observed.
Because of the beneficial effects of ferrite and the reduced sensitivity to IASCC in low-corrosion potential environments, relatively low CGRs are expected at 0.08 dpa for the CASS specimens. To measure SCC CGRs at such low growth rates, a considerable amount of time is needed to collect data for adequate measurements. Since the focus of this study was on embrittlement (i.e., loss of facture toughness), a limited amount of time was spent on collecting SCC CGR data.
C
rac
k
G
row
th R
a
te
i
n
W
a
ter,
Lo
g Sc
al
e
Crack Growth Rate in Air, Log Scale
Environmental Effect
Mechanical Fatigue
Increase Load Ratio and Rise Time
Figure 5. Schematic for inducing environmentally assisted cracking in test environment.
2.4.2 Fracture Toughness JR Curve Test
After each SCC CGR test, a fracture toughness JR curve test was conducted on the same sample in the test environment. This test was performed with a constant stain rate of 0.43 m/s, and the load and sample extension were recorded continuously outside the autoclave. The load-line displacement at load points was determined by subtracting the extension of the load train, which had been measured prior to the test. During the test, the loading was interrupted periodically, and the specimen was held at a constant extension to measure crack length with the DCPD method. Before each DCPD measurement, the sample stress was allowed to relax at a constant displacement for 30 s.
The J-integral was calculated from the load (P) vs. load-line displacement (v) curve according to
ASTM Specification E 1820-8a.35 The J is the sum of the elastic and plastic components,
el pl
J J J (3)
At a hold point i corresponding to a crack length ai, and vi and Pi on the load vs. load-line
displacement curve, the elastic component Jel(i) is given by:
2 2 ( ) ( ) ( i ) (1 ) el i K J E (4)
where is Poisson’s ratio, and the stress intensity K(i) is calculated from Eqs. 1 and 2. The
plastic component Jpl(i) is given by:
( 1) ( ) ( 1) ( ) ( 1) ( ) ( 1) ( 1) ( 1) ( 1) 1 i pl i pl i i i pl i pl i i i N i A A a a J J b B b (5)
where b(i-1) is the remaining ligament at point i-1; Apl(i) is the area under the load vs. load-line
displacement curve; and BN is the net specimen thickness. In addition, (i)and (i)are factors that
account for the crack growth effects on J during the test and are expressed as:
( 1) ( 1) 2.0 0.522 i i b W (6) ( 1) ( 1) 1.0 0.76 i i b W (7)
The quantity Apl(i) - Apl(i-1) is the increment of the plastic area under the load vs. load-line
displacement curve between lines of constant plastic displacement at points i-1 and i. The plastic
area under the load vs. load-line displacement curve is given by
1
( ) ( 1) ( ) ( 1) i i pl i2 pl i pl i pl i P P v v A A (8)where the plastic components of the load-line displacement, vpl(i), are:
( ) ( ) ( ) pl i i i LL i
v v PC (9)
where v(i) is the total load-line displacement, and CLL(i) is the compliance required to give the current crack length ai, andcan be determined as follows:
2 3 ( ) ' 2 1.62 17.80( / ) 4.88( / ) 1.27( / ) [1 ( / ) ] i i i LL i e i a W a W a W C E B a W (10)
where Be is the specimen effective thickness given by B - (B - BN)2/B, and E=E/(1 - ). A JR curve is constructed by fitting the calculated J values and corresponding crack lengths to a power law relationship. The J value at the intersection of the power law curve and the 0.2-mm offset blunting line is reported. Note that a blunting line of four times flow stress (4f)is
In this study, the estimated flow stress of irradiated CASS is approximately 420-520 MPa. This relatively low strength allows a maximum J value of 280-360 kJ/m2 for a typical 1/4T-CT specimen. The maximum crack extension is limited below ~1.3 mm in most cases. Because of the low strength and high fracture toughness of CASS materials, the required crack tip constraint and upper limit of J integral are often invalid with the 1/4T-CT specimen. Thus, the J values determined from this study normally cannot be validated for JIC per ASTM E182-8a.
2.4.3 Fractographic Examination
After each CGR/JR test, the final crack size was marked by fatigue cycling in an air atmosphere at room temperature. The specimen was then fractured, and the fracture surface was examined by a scanning electron microscopy (SEM). Since the sample was highly radioactive, a two-step replication technique was developed for the fractographic examination. After cleaning the tested sample remotely using manipulators, we used a two-part synthetic compound to produce a negative replica of the fracture surface inside the hot cell. The negative replica was then
removed from the hot cell and transferred to a radiological fume hood for decontamination. The second step of casting was to apply a low-viscosity epoxy on the surface of the negative replica. The cast was kept at approximately 70°C for several days to harden the epoxy replica. The negative replica was then removed. The obtained epoxy replica was coated with a layer of gold before it was transferred for SEM examination.
The CGR test and JR test regions were identified on the SEM images and their fracture
morphologies were analyzed. The physical crack length was also measured on the images, and a 9/8 averaging technique was used to account for the uneven extensions at the crack front. With this technique, nine measurements were taken along the crack front spaced across the width of the sample at equal intervals. The two near-surface measurements were averaged, and the resultant value was averaged with the remaining seven measurements to obtain the average crack length. All crack extensions determined from the DCPD method were scaled proportionately to match the final SEM-measured crack length.
3 Results
Seven CASS specimens from three heats of CASS were tested in the current study. The test matrix is shown in Table 3. The specimens were unaged and thermally aged pairs and had been irradiated to an identical dose (~0.08 dpa) in the Halden reactor. The CF-3 specimens were tested in either low-DO high-purity water or PWR water, and all CF-8 and CF-8M specimens were tested in low-DO high-purity water.
Table 3. Test matrix of low-dose CASS specimens irradiated at the Halden reactor.
Sample ID. Heat ID. Materials Test Environment Facility CGR JR SEM
A-1 69 CF-3, 24% , unaged PWR Cell 1 √ - √
A-2 69 CF-3, 24% , unaged Low-DO high-purity Cell 2 √ √ √
B-1 69 CF-3, 24% , aged PWR Cell 1 √ √ √
E-1 68 CF-8, 23% , unaged Low-DO high-purity Cell 2 √ √ √
F-1 68 CF-8, 23% , aged Low-DO high-purity Cell 2 √ √ √
I-1 75 CF-8M, 28% , unaged Low-DO high-purity Cell 2 √ √ √
J-1 75 CF-8M, 28% , aged Low-DO high-purity Cell 2 √ √ √
3.1 CF-3 Cast Stainless Steel
3.1.1 Unaged CF-3 Cast Stainless Steel
3.1.1.1 Specimen A-1 tested in simulated PWR water
Crack growth rate test
Specimen A-1 was a CF-3 CASS sample (Heat 69) tested in the simulated PWR water
environment. The specimen had ~24% ferrite and was in the as-cast condition. The objective of this test was to compare the results with those from an identical test performed in high-purity water with low DO. Also, the CGR results of this sample were compared with those obtained from its thermally aged equivalent. The test conditions and results are summarized in Table 4, and a crack-length history plot is shown in Fig. 6. Note that the starting crack length was about 1 mm longer than a normal value for a 1/4T-CT specimen. This crack extension was due to an interruption of the test to correct a loose DCPD lead found during pre-cracking. The initial crack length (6.802 mm) reported in Table 4 was later determined with SEM images on the fracture surface.
The specimen was pre-cracked in the PWR environment with a triangular waveform at 1 Hz, a maximum stress intensity factor of ~24 MPa m1/2, and load ratio of 0.2. After about 200 m
after some additional crack extension. The cyclic CGR data obtained from this test are plotted against fatigue CGRs in air as shown in Fig. 7. The fatigue CGRs are estimated for cyclic test periods based on James and Jones37 with the load ratios and rise times. A corrosion fatigue
curve proposed by Shack and Kassner38 for unirradiated SSs in 0.2-ppm DO water at 290°C is
also included in the figure as a reference. Obviously, the corrosion fatigue response of this sample is lower than that of typical SSs, suggesting good IASCC resistance of CASS in PWR water.
After the cyclic CGR test, the specimen was subjected to a constant stress intensity factor of ~24 MPa m1/2 with periodic partial unloading (PPU) every 2 hours. The measured SCC CGR was about 4.8x10⁻¹¹ m/s, a factor of four lower than that of the NUREG-0313 curve,36 a SCC
disposition curve based on unirradiated SSs tested in high-DO environment. The SCC response of this sample will be discussed at the end of this section along with the other CGR data obtained from the same heat.
Table 4. Crack growth rates of specimen A-1 (0.08-dpa unaged CF-3 sample with 24% ferrite) in PWR water.a
Test Test Time, Test Temp., Load Ratio Rise Time, Return Time, Hold Time, Kmax, K,
CGR in
Env., CGR in Air, Crack Length, Period h °C s s s MPa m1/2 MPa m1/2 m/s m/s mm
Start 63.9 6.802 b a 64.8 319 0.21 0.43 0.43 0.07 24.3 19.2 1.58E-07 2.04E-07 7.009 b 66 319 0.31 0.41 0.41 0.09 23.8 16.4 1.17E-07 1.43E-07 7.218 c 68.6 319 0.41 0.78 0.78 0.22 23.1 13.6 3.21E-08 4.47E-08 7.340 d 72.3 319 0.41 1.54 1.54 0.46 21.9 12.8 9.77E-09 1.89E-08 7.395 e 87.6 319 0.46 2.96 1.48 1.04 20.3 11.0 2.89E-10 6.18E-09 7.403 f 91 319 0.41 3.08 1.54 0.92 22.2 13.1 9.46E-09 1.01E-08 7.462 g 94.1 320 0.41 7.69 1.54 2.31 22.4 13.2 5.67E-09 4.17E-09 7.503 h 103 320 0.46 22.6 3.76 7.42 22.6 12.2 1.51E-09 1.16E-09 7.535 i 114.3 320 0.46 45.1 3.76 14.9 22.7 12.3 7.63E-10 5.86E-10 7.558 j 118.7 319 0.41 15.3 3.83 4.66 23.0 13.6 4.61E-09 2.27E-09 7.602 k 127.9 319 0.41 46.0 3.83 14.0 23.0 13.7 1.25E-09 7.72E-10 7.632 l 150.3 318 0.40 114.9 9.19 35.1 23.0 13.7 3.90E-10 3.13E-10 7.655 m 168.7 319 0.40 385.6 9.25 114.4 23.9 14.3 3.56E-10 1.05E-10 7.673 1 209 318 0.40 12 12 7200 23.9 14.4 4.83E-11 5.75E-12 7.684 a Simulated PWR water with 2 ppm Li and 1000 ppm B. DO<10 ppb. Conductivity ~20 S/cm.
(a) 6.80 6.90 7.00 7.10 7.20 7.30 7.40 7.50 7.60 4 8 12 16 20 24 28 65 70 75 80 85 Cr ac k L ength ( mm) Kma x (M P a m 0. 5) Time (h) Specimen A-1 CF-3, unaged, 0.08 dpa PWR water, 320oC a b c d e Kmax Crack length (b) 7.35 7.40 7.45 7.50 7.55 7.60 7.65 4 8 12 16 20 24 28 85 90 95 100 105 110 115 120 C rac k L ength ( mm) Kma x (M P a m 0. 5) Time (h) Specimen A-1 CF-3, unaged, 0.08 dpa PWR water, 320oC f e g h i j Kmax Crack length (c) 7.60 7.65 7.70 7.75 4 8 12 16 20 24 28 Cr ac k L ength ( mm) Kma x (M P a m 0. 5) Specimen A-1 CF-3, unaged, 0.08 dpa PWR water, 320oC k l m Kmax Crack length
(d) 7.66 7.67 7.68 7.69 7.70 7.71 7.72 4 8 12 16 20 24 28 170 180 190 200 210 220 230 240 250 Cr ac k L ength ( mm) Kma x (M P a m 0. 5) Time (h) Specimen A-1 CF-3, unaged, 0.08 dpa PWR water, 320oC 1 K Crack length Figure 6. (Contd.) 10-11 10-10 10-9 10-8 10-7 10-11 10-10 10-9 10-8 10-7 CG R en v (m /s ) CGRair (m/s) Specimen A-1 CF-3, unaged, 0.08 dpa PWR water, 320oC
Test period with <10 m
extension are excluded. CF curve for 0.2 ppm DO
by Shack & Kassner
Fractographic examination
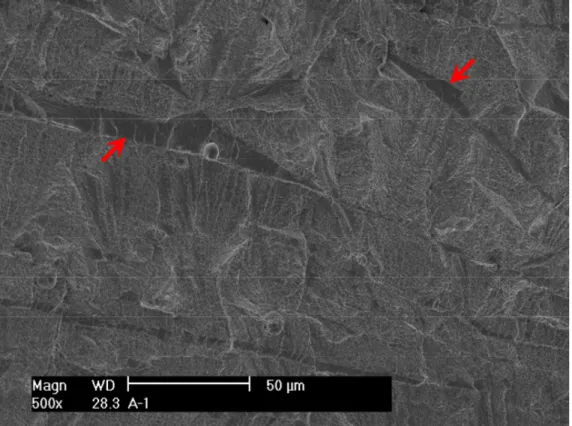
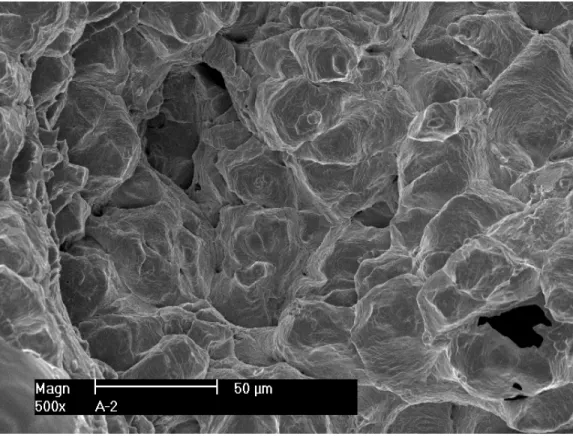
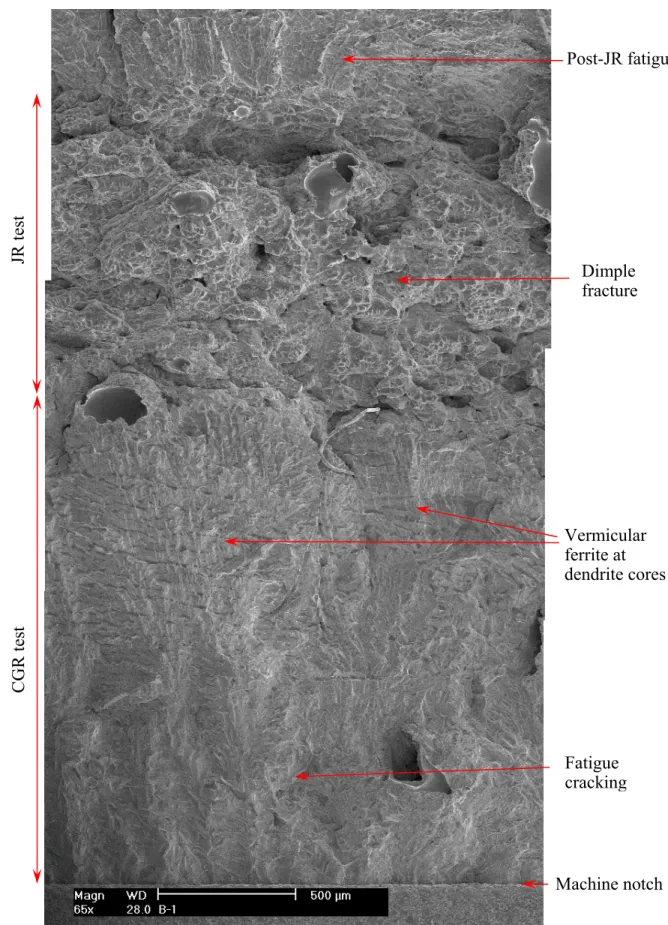
After the test, the specimen was pulled apart in an air atmosphere at room temperature, and the fracture surface was examined with SEM. Figure 8 shows the entire crack front of specimen A-1. The straight line in the middle of the picture corresponds to the restart of pre-cracking. Figure 9 is an enlarged view along the central section of the specimen. Transgranular cleavage fracture is the dominant morphology throughout the CGR region. Figure 10 shows the typical river pattern of cleavage cracking at the beginning and the end of the CGR test region. Vermicular ferrite at dendrite cores can also be seen in a few places on the fracture surface. As shown in Fig. 11, fewer slip ledges can be seen within ferrite, suggesting that the ferrite dendrite core might be deformed to a lesser extent than the surrounding austenite. Beyond the CGR test, the dominant fracture mode is ductile dimples resulting from microvoid coalescence.
Crack advance
Restar
t o
f pre-crac
king
E
nd of
C
G
R
Cl
eav
ag
e
Del
ta ferri
te
in
dendrit
es
Crack advance
Restar
t o
f pre-crac
king
E
nd of
C
G
R
Cl
eav
ag
e
Del
ta ferri
te
in
dendrit
es
Restart of pre-cracking Vermicular ferrite at dendrite core Dimple fracture
C
rac
k a
dvance
Figure 10. Cleavage fracture in specimen A-1: (a) pre-cracking, and (b) end of the CGR test. Crack propagation from bottom to top.
a
Figure 11. Fracture surface of specimen A-1 showing that delta ferrite deformed to a lesser extent than austenite. Crack propagation from bottom to top.
3.1.1.2 Specimen A-2 tested in low-DO high-purity water
Crack growth rate test
Specimen 2 was an unaged CF-3 CASS with ~24% ferrite (Heat 69), identical to specimen A-1. This sample was tested in high-purity water with low DO. The objective was to compare the results with those from specimen A-1, which was tested in PWR water. In addition, the fracture toughness of this specimen was compared with that of thermally aged CF-3 CASS. The CGR test conditions and results are summarized in Table 5, and a crack-length history plot is shown in Fig. 12.
Pre-cracking in this sample was started with a triangle waveform at 1 Hz. The applied maximum stress intensity factor and load ratio were ~17 MPa m1/2 and ~0.35, respectively. The initial cyclic CGRs were comparable to fatigue growth rates but were quickly diminished as the load ratio was increased to 0.5. After lowering the load ratio of 0.4 and increasing the frequency to 1 Hz, the high growth rate was re-established in test period g over a 100-m crack extension.
comparison between Figs. 7 and 13 shows that the cyclic CGRs of specimen A-1 is slightly lower than that of specimen A-2.
Table 5. Crack growth rates of specimen A-2 (0.08-dpa unaged CF-3 with 24% ferrite) in low-DO high-purity water environment.
Test Test Time, Test Temp., Load Ratio Rise Time, Return Time, Hold Time, Kmax, K, CGR in Env., CGR in Air, Crack Length,
Period h °C s s s MPa m1/2 MPa m1/2 m/s m/s mm
Start 14.9 5.899 aa 18.1 319 0.34 0.45 0.45 0.05 17.3 11.4 4.09E-08 4.04E-08 6.041 b 20 319 0.41 0.45 0.45 0.05 17.1 10.1 3.21E-08 2.96E-08 6.141 c 21.6 319 0.50 0.43 0.43 0.07 15.7 7.8 1.94E-09 1.43E-08 6.151 da 24.3 319 0.45 0.44 0.44 0.06 16.5 9.1 2.27E-08 2.16E-08 6.219 e 30.4 319 0.45 0.88 0.88 0.12 16.0 8.8 5.26E-09 9.85E-09 6.274 f 39.3 319 0.50 1.74 1.74 0.26 15.9 8.0 1.80E-09 3.82E-09 6.304 g 40.4 319 0.40 0.45 0.45 0.05 17.2 10.4 5.87E-08 3.21E-08 6.410 h 42.4 319 0.45 0.44 0.44 0.06 16.3 9.0 1.25E-08 2.13E-08 6.453 i 44.6 319 0.45 0.88 0.88 0.12 16.6 9.2 1.29E-08 1.14E-08 6.497 j 49.0 319 0.45 1.75 1.75 0.25 16.8 9.2 9.20E-09 5.84E-09 6.564 k 62.2 319 0.45 4.38 4.38 0.62 17.0 9.4 3.07E-09 2.45E-09 6.627 l 74.2 319 0.46 8.73 4.37 1.27 17.2 9.4 2.37E-09 1.23E-09 6.686 m 88.4 319 0.45 26.2 4.37 3.79 17.2 9.5 7.77E-10 4.25E-10 6.719 n 110.6 319 0.44 52.5 10.5 7.52 17.2 9.7 6.45E-10 2.24E-10 6.756 o 135.7 319 0.43 105.0 10.5 15.0 17.0 9.7 3.77E-10 1.13E-10 6.780 p 184.3 319 0.43 262.6 10.5 37.4 17.3 9.8 8.72E-11 4.69E-11 6.795 q 232.7 319 0.43 525.9 10.5 74.1 17.6 10.0 1.29E-10 2.49E-11 6.815 r 278.6 320 0.43 876.3 10.5 123.7 17.6 10.1 1.73E-10 1.52E-11 6.840 s 326.7 319 0.48 865.9 10.4 134.1 17.6 9.2 1.27E-10 1.21E-11 6.860 1 423.9 319 0.50 12 12 7200 17.6 8.8 2.33E-11 1.27E-12 6.875 2-a 575.3 320 0.50 12 12 7200 19.6 9.8 4.89E-11 1.80E-12 6.907
2-b 687.3 321 1 - - - 19.8 - 4.94E-12 - 6.912
2-c 784 321 0.50 12 12 3600 19.8 9.9 4.26E-11 3.73E-12 6.924 a The CGR value was obtained from the later part of the test period.
(a) 5.90 6.00 6.10 6.20 6.30 4 8 12 16 20 24 28 32 14 16 18 20 22 24 26 28 30 Cr ac k L ength ( mm) Kma x (M P a m 0. 5) Time (h) Specimen A-2 CF-3, unaged, 0.08 dpa. Low-DO high-purity water, 320oC
a b c 4.1E-8 m/s d e 2.3E-8 m/s Kmax Crack length (b) 6.20 6.25 6.30 6.35 6.40 6.45 6.50 6.55 6.60 4 8 12 16 20 24 28 32 30 35 40 45 50 C rac k L ength ( mm) Kma x (M P a m 0. 5) Time (h) Specimen A-2 CF-3, unaged, 0.08 dpa. Low-DO high-purity water, 320oC
f g h i j Kmax Crack length (c) 6.55 6.60 6.65 6.70 6.75 6.80 6.85 6.90 4 8 12 16 20 24 28 32 Cr ac k L ength ( mm) Kma x (M P a m 0. 5) Specimen A-2 CF-3, unaged, 0.08 dpa. Low-DO high-purity water, 320oC
k l m n o Kmax Crack length
(d) 6.70 6.75 6.80 6.85 6.90 6.95 7.00 4 8 12 16 20 24 28 32 160 200 240 280 320 Cr ac k L ength ( mm) Kma x (M P a m 0. 5) Time (h) Specimen A-2 CF-3, unaged, 0.08 dpa. Low-DO high-purity water, 320oC
p q r s Kmax Crack length (e) 6.86 6.88 6.90 6.92 6.94 4 8 12 16 20 24 28 32 400 500 600 700 800 C rac k L ength ( mm) Kma x (M P a m 0. 5) Time (h) Specimen A-2 CF-3, unaged, 0.08 dpa. Low-DO high-purity water, 320oC
1 2-a 2-b 2-c Kmax Crack length Figure 12. (Contd.)
10-11 10-10 10-9 10-8 10-7 10-11 10-10 10-9 10-8 10-7
Test periods: a-f
Test periods: g-s CG R en v (m /s ) CGRair (m/s) Specimen A-2 CF-3, unaged, 0.08 dpa. Low-DO high-purity water
320oC
CF curve for 0.2 ppm DO by Shack & Kassner
Figure 13. Cyclic CGRs of Specimen A-2.
The first constant-load test period was conducted at 17.6 MPa m1/2 with PPU every 2 hr (test period 1). After nearly 100 hr, a CGR of 2.3x10⁻¹¹ m/s was measured over ~15-m crack
extension. The load was increased to 19.6 MPa m1/2 for the second constant-load test period. Again, PPU was applied every 2 hr. A CGR of 4.9x10⁻¹¹ m/s was obtained over 150 hr. After the PPU was removed in test period 2-b, the measured CGR decreased one order of magnitude.
Constrained by test time, only 5-m crack extension was accumulated for this test period. In test period 2-c, the PPU was re-introduced but with 1-hour interval. The measured CGR was nearly
identical to that obtained in test period 2-a. It appears that the hold time between PPU does not
affect the SCC response of CF-3 at this stress intensity level. Fracture toughness JR curve test
After the crack growth test, a fracture toughness JR curve test was conducted on this sample in the low-DO high-purity water environment. The sample was loaded at a constant extension rate of 0.43 m/s while the load and load-line displacement were recorded. During the test, loading was interrupted periodically to measure the crack extension by DCPD. The obtained J and crack extension data are plotted in Fig. 14. A power-law curve fitting of the data gives a relationship of J = 430a0.64. The estimated J value at the 0.2-mm offset line is about 204 kJ/m2. Note that
0 160 320 480 640 0.0 0.5 1.0 1.5 2.0 J ( k J/ m 2 ) Crack Extension (mm) Specimen A-2 CF-3, unaged, 0.08 dpa.
Low-DO high-purity water, 320oC
J= 430*a0.64
JQ=204 kJ/m2 Jmax
amax
Figure 14. The J-R curve for specimen A-2.
Fractographic examination
After the JR curve test, the sample was fatigued at room temperature in an air atmosphere to break the ligament. The fracture surface was than examined with the replication technique using SEM. Figure 15 shows the entire fracture surface of specimen A-2. Note that the round smooth areas on the picture are air bubbles trapped during replication, not the original morphology of the fracture surface. Both the CGR and post-JR fatigue regions are relatively flat, clearly contrasting with the heavily deformed JR region. The crack front of the CGR test is straight, indicating a well-controlled loading condition during the CGR test. A curved crack front due to a non-constant constraint can be seen for the JR test region.
Figure 16 shows an enlarged view of specimen A-2 along its central line. Similar to specimen A-1, which was tested in PWR water, transgranular cleavage fracture was also the dominant morphology during the CGR test. Figure 17 shows the cleavage cracking at the initial part of the CGR test, and cleavage steps resulting from brittle fracture can be seen in some places. An area of delta ferrite at the dendrite cores can be seen close to the end of the CGR test (Fig. 18). Similar to the specimen A-1 findings, less plastic deformation activities were observed in the ferrite phase. Beyond the CGR test, ductile dimples were the only fracture morphology on the fracture surface, as shown in Fig. 19.
D
elta fe
rr
ite
in
d
endr
it
es
Ai
r bub
bl
es
CGR
JR
Di
m
pl
es
D
elta fe
rr
ite
in
d
endr
it
es
Ai
r bub
bl
es
CGR
JR
Di
m
pl
es
Figure 15. Fracture surface o
f Specimen
Figure 16. Fracture surface of specimen A-2 along the sample central line. CGR test Cleavage fracture Vermicular ferrite in dendrite cores Dimple fracture
Crack advance
JR test Post-JR fatigue Machined notchFigure 17. Cleavage steps at the beginning of CGR test of Specimen A-2. Crack propagation from bottom to top.
Figure 19. Ductile dimple morphology in the JR test region of specimen A-2. Crack propagation from bottom to top.
3.1.2 Thermally Aged CF-3 SS
Crack growth rate test
Specimen B-1 was a 0.08-dpa thermally aged CF-3 CASS with ~24% ferrite. This sample was obtained from the same heat (Heat 69) as specimens A-1 and A-2. The thermal aging condition was 400°C and 10,000 hr. The objective was to compare the results with those of the unaged CF-3 at the same dose level. The CGR test conditions and results are summarized in Table 6, and a crack-length history plot is shown in Fig. 20.
The test was started with fatigue pre-cracking at a maximum stress intensity factor of
~18 MPa m1/2 and a load ratio of 0.3. A triangular waveform was used with a frequency of 1 Hz. Upon successful crack initiation, the maximum stress intensity factor was lowered to prepare for transitioning. In the following test periods, the load ratio and rise time were increased slowly to stimulate environmentally enhanced cracking. Despite the effort, the measured CGRs fell well below the fatigue growth rate line. A more aggressive loading condition was applied to re-activate the fatigue crack. Following that, repeated attempts (test periods e-j, k-q, and r-af) were
made to induce environmental enhanced cracking. However, no elevated CGRs could be maintained. It appears that cracking cannot be sustained with a load ratio higher than 0.4 and a stress intensity factor less than 19 MPa m1/2 in this sample. Environmentally enhanced cracking
was only observed after increasing the stress intensity factor to about 22 MPa m1/2. At this stress intensity, the measured CGR by the end of the cyclic test (period ao) was a factor of three higher
than the fatigue crack growth rate in air. Subsequently, the test was set at constant load with PPU every 2 hr in test period 1. A CGR of 2.8x10⁻¹¹ m/s was obtained at a stress intensity factor
of 22 MPa m1/2.
Table 6. CGR test of specimen B-1 (0.08-dpa aged CF-3 with 24% ferrite) in PWR water.a
Test Test Time, Test Temp., Load Ratio Rise Time, Return Time, Hold Time, Kmax, K,
CGR in
Env., CGR in Air, Crack Length,
Period h °C s s s MPa m1/2 MPa m1/2 m/s m/s mm
Start 0.52 6.019 a 3.0 319 0.27 0.38 0.38 0.12 17.6 12.8 7.88E-08 6.55E-08 6.250 b 6.7 320 0.39 0.35 0.35 0.15 17.0 10.4 4.11E-08 4.06E-08 6.442 c 10.5 320 0.50 0.64 0.64 0.36 15.8 7.9 2.75E-09 9.97E-09 6.460 d 20.1 320 0.45 1.32 1.32 0.68 15.9 8.8 3.63E-10 6.50E-09 6.466 e 23.3 320 0.27 0.37 0.37 0.13 17.9 13.1 5.89E-08 7.29E-08 6.698 f 25.4 320 0.27 0.36 0.36 0.14 17.1 12.4 4.86E-08 6.25E-08 6.822 g 27.8 320 0.38 0.34 0.34 0.16 16.8 10.4 2.77E-08 4.22E-08 6.905 h 32.2 320 0.38 0.66 0.66 0.34 16.3 10.1 8.33E-09 1.93E-08 6.950 i 44.2 319 0.44 3.20 3.20 1.80 16.2 9.2 2.63E-10 3.07E-09 6.955 j 47.5 320 0.38 1.32 1.32 0.68 16.2 10.0 7.00E-10 9.49E-09 6.958 k b 52.3 320 0.37 0.67 0.67 0.33 17.1 10.8 1.01E-08 2.32E-08 7.000 l 59.1 320 0.37 3.36 1.34 1.64 17.2 10.9 4.05E-09 4.80E-09 7.048 m 69 320 0.37 6.71 1.34 3.29 17.4 11.0 2.24E-09 2.48E-09 7.092 n 82.8 320 0.42 13.0 3.25 6.99 17.3 10.1 3.18E-10 1.01E-09 7.102 o 95.2 320 0.36 13.4 3.35 6.60 17.3 11.0 4.09E-11 1.23E-09 7.104 p 105 320 0.36 6.73 3.37 3.27 17.5 11.2 1.01E-10 2.59E-09 7.107 q 116.8 320 0.36 13.6 3.40 6.41 17.8 11.5 9.16E-11 1.40E-09 7.107 r 124.2 320 0.36 1.36 1.36 0.64 18.0 11.5 3.85E-09 1.43E-08 7.142 s 130.6 320 0.36 3.39 1.36 1.61 18.1 11.6 2.66E-09 5.86E-09 7.171 t 142.5 320 0.36 6.77 1.35 3.23 18.2 11.7 1.21E-09 3.00E-09 7.201 u 145.9 319 0.35 13.5 3.38 6.46 18.1 11.7 9.45E-11 1.49E-09 7.202 v 164.7 319 0.35 13.6 3.40 6.40 18.3 11.9 1.23E-10 1.56E-09 7.207 w 170 319 0.35 10.2 3.40 4.80 18.4 11.9 1.53E-10 2.09E-09 7.208 x 188.7 319 0.35 10.2 3.42 4.75 18.9 12.3 1.39E-09 2.28E-09 7.251 y 199 319 0.35 20.5 3.42 9.51 18.9 12.3 7.57E-10 1.15E-09 7.265 z 238 319 0.35 41.0 3.41 19.0 19.1 12.3 2.14E-10 5.88E-10 7.287 aa 284.5 319 0.36 81.8 8.18 38.2 19.3 12.4 2.61E-10 3.00E-10 7.318 ab 356.3 319 0.35 204.4 8.18 95.6 19.2 12.4 4.36E-11 1.20E-10 7.325 ac 442.2 318 0.35 413.0 8.26 187.0 19.9 12.9 2.88E-11 6.65E-11 7.331 ad 501.5 319 0.35 693.0 8.32 307.0 20.2 13.2 1.41E-11 4.26E-11 7.334 ae 527.8 318 0.46 78.0 7.80 42.0 19.9 10.8 5.94E-12 2.23E-10 7.336 af 574.5 318 0.45 39.4 7.88 20.6 20.6 11.3 2.11E-10 4.98E-10 7.356 ag 644.4 318 0.45 78.8 7.88 41.2 20.6 11.2 negligible 2.48E-10 7.355 ah 648 318 0.29 3.97 3.97 1.03 22.5 15.9 2.93E-08 1.30E-08 7.477 ai 650 318 0.34 11.7 3.89 3.32 22.3 14.7 7.43E-09 3.61E-09 7.509 aj 653.2 318 0.41 22.6 3.76 7.43 21.5 12.8 2.97E-09 1.27E-09 7.532 ak 671.3 318 0.39 45.8 9.16 14.2 22.6 13.8 1.02E-09 7.91E-10 7.577
(a) 6.00 6.10 6.20 6.30 6.40 6.50 6.60 6.70 4 8 12 16 20 24 28 0 4 8 12 16 20 24 Cr ac k L ength ( mm) Kma x (M P a m 0. 5) Time (h) Specimen B-1 CF-3, aged 10,000 hrs @ 400°C, 0.08 dpa PWR water, 320oC a b c d e Compliance
test Crack length
Kmax (b) 6.70 6.75 6.80 6.85 6.90 6.95 7.00 7.05 7.10 4 8 12 16 20 24 28 24 28 32 36 40 44 48 52 C rac k L ength ( mm) Kma x (M P a m 0. 5) Time (h) Specimen B-1 CF-3, aged 10,000 hrs @ 400°C, 0.08 dpa PWR water, 320oC f h g i j k Crack length Kmax (c) 6.95 7.00 7.05 7.10 7.15 7.20 7.25 4 8 12 16 20 24 28 60 80 100 120 140 Cr ac k L ength ( mm) Kma x (M P a m 0. 5) Time (h) Specimen B-1 CF-3, aged 10,000 hrs @ 400°C, 0.08 dpa PWR water, 320oC l m n o p q r s t u Crack length Kmax
Figure 20. Crack-length-vs.-time plot for specimen B-1 (0.08-dpa aged CF-3 with 24% ferrite) in PWR water: test periods (a) a-e, (b) f-k, (c) l-t, (d) v-y, (e) z-ac, (f) ad-ag, (h) ah-al, and (g) am-1.
(d) 7.15 7.20 7.25 7.30 4 8 12 16 20 24 28 150 160 170 180 190 200 Cr ac k L ength ( mm) Kma x (M P a m 0. 5) Time (h) Specimen B-1 CF-3, aged 10,000 hrs @ 400°C, 0.08 dpa PWR water, 320oC v w x y Crack length Kmax (e) 7.26 7.28 7.30 7.32 7.34 7.36 7.38 4 8 12 16 20 24 28 200 250 300 350 400 450 C rac k L ength ( mm) Kma x (M P a m 0. 5) Time (h) Specimen B-1 CF-3, aged 10,000 hrs @ 400°C, 0.08 dpa PWR water, 320oC z aa ab ac Crack length Kmax (f) 7.32 7.34 7.36 7.38 7.40 4 8 12 16 20 24 28 Cr ac k L ength ( mm) Kma x (M P a m 0. 5) Specimen B-1 CF-3, aged 10,000 hrs @ 400°C, 0.08 dpa PWR water, 320oC af ag ae ad Crack length Kmax
(g) 7.35 7.40 7.45 7.50 7.55 7.60 7.65 4 8 12 16 20 24 28 650 660 670 680 690 Cr ac k L ength ( mm) Kma x (M P a m 0. 5) Time (h) Specimen B-1 CF-3, aged 10,000 hrs @ 400°C, 0.08 dpa PWR water, 320oC ah ai aj ak al Crack length K max (h) 7.60 7.62 7.64 7.66 7.68 7.70 7.72 4 8 12 16 20 24 28 700 750 800 850 C rac k L ength ( mm) Kma x (M P a m 0. 5) Time (h) Specimen B-1 CF-3, aged 10,000 hrs @ 400°C, 0.08 dpa PWR water, 320oC am an ao 1 Crack length Kmax Figure 20. (Contd.)
The cyclic CGRs with a significant crack extension (defined as >10 m) from this sample are plotted in Fig. 21 along with the corrosion fatigue curve for unirradiated SSs. No elevated corrosion fatigue response can be seen for this material despite its thermal aging condition. Comparing Figs. 7 and 21, we found the corrosion fatigue behaviors of unaged and aged CF-3 to be similar in PWR water. It seems that a combination of irradiation damage and thermal aging does not increase cracking susceptibility of CF-3 at 0.08 dpa, as would be expected.
All SCC CGRs obtained from specimens A-1, A-2, and B-1 are shown in Fig. 22. They are all well below the NUREG-0313 curve, as expected at this dose and ECP level. The SCC CGRs of the unaged CF-3 (specimens A-1 and A-2) are similar for the low-DO high-purity water and PWR water environments. The thermally aged specimen (B-1) has a slightly lower CGR than that of unaged CF-3. However, given the large scatter of the SCC CGR data, this difference is considered insignificant.
10-11 10-10 10-9 10-8 10-7 10-11 10-10 10-9 10-8 10-7
Test periods: a-d
Test periods: e-j
Test periods: k-q
Test periods: r-af Test periods: ah-ao
CG R en v (m /s ) CGRair (m/s) Specimen B-1 CF-3, aged, 0.08 dpa PWR water, 320oC CF curve for 0.2 ppm DO by Shack & Kassner
Test periods with <10 m
extension are excluded.
Figure 21. Cyclic CGRs of specimen B-1.
10-11
10-10
10-9
Unaged CF-3, A-1, PPU 2 hrs, PWR water
Unaged CF-3, A-2, PPU 2 hrs, Low-DO water Unaged CF-3, A-2, PPU 1 hrs, Low-DO water Unaged CF-3, A-2, w/o PPU, Low-DO water
Aged CF-3, B-1, PPU 2 hrs, PWR water
CG R ( m /s ) NUREG-0313 Curve
Low-DO high-purity or PWR water, ~320oC, ~0.08 dpa