Washington University in St. Louis
Washington University Open Scholarship
Engineering and Applied Science Theses &Dissertations McKelvey School of Engineering
Winter 12-15-2017
System Characterizations and Optimized
Reconstruction Methods for Novel X-ray Imaging
Huifeng Guan
Washington University in St. Louis
Follow this and additional works at:https://openscholarship.wustl.edu/eng_etds
Part of theBiomedical Engineering and Bioengineering Commons, and theOther Physics Commons
This Dissertation is brought to you for free and open access by the McKelvey School of Engineering at Washington University Open Scholarship. It has been accepted for inclusion in Engineering and Applied Science Theses & Dissertations by an authorized administrator of Washington University Open
Recommended Citation
Guan, Huifeng, "System Characterizations and Optimized Reconstruction Methods for Novel X-ray Imaging" (2017).Engineering and Applied Science Theses & Dissertations. 283.
Washington University in St. Louis School of Engineering and Applied Science
Department of Biomedical Engineering
Dissertation Examination Committee: Mark Anastasio, Chair
Hua Li Deshan Yang Tiezhi Zhang Quing Zhu
System Characterizations and Optimized Reconstruction Methods for Novel X-ray Imaging Modalities
by Huifeng Guan
A dissertation presented to The Graduate School of Washington University in
partial fulfillment of the requirements for the degree
of Doctor of Philosophy Dec 2017
copyright by
Huifeng Guan
Contents
List of Tables . . . v List of Figures . . . vi Acknowledgments . . . x Abstract . . . xii 1 Introduction . . . 11.1 Background and Motivation . . . 2
1.2 Overview of the Dissertation . . . 6
2 Investigation of the boundary enhancement in propagation-based X-ray phase contrast tomosynthesis . . . 8
2.1 INTRODUCTION . . . 9
2.2 BACKGROUND . . . 10
2.2.1 PB XPC imaging model . . . 10
2.2.2 Data function . . . 12
2.2.3 Interpretation of boundary-enhanced image . . . 13
2.2.4 Fourier slice interpretation of tomographic depth resolution . . . 14
2.3 MATERIALS and METHODS . . . 15
2.3.1 Reconstruction algorithm . . . 15 2.3.2 Simulation Studies . . . 17 2.3.3 Experimental Studies . . . 19 2.4 RESULTS . . . 22 2.4.1 Simulation Studies . . . 22 2.4.2 Experimental Studies . . . 26
2.5 CONCLUSION AND DISCUSSION . . . 28
3 A subspace-based resolution enhancing image reconstruction method for few-view differential phase-contrast tomography . . . 31
3.1 Introduction . . . 32
3.2 Background . . . 35
3.2.1 D-XPCT imaging model in semi-discrete form . . . 35
3.3 Motivation for subspace-based image reconstruction . . . 39
3.3.1 Revisiting the FBP algorithm . . . 39
3.3.2 The recovery of the object’s high-frequency contents . . . 42
3.4 Subspace-based image reconstruction method . . . 44
3.4.1 General forms of the discrete imaging model . . . 44
3.4.2 Proposed iterative reconstruction method . . . 45
3.5 Results . . . 47
3.5.1 Computer-simulation studies . . . 47
3.5.2 Experimental studies . . . 53
3.6 Conclusion . . . 58
4 A total-projection-length constrained method for stabilized quantitative projection-based dual-energy material decomposition . . . 60
4.1 Introduction . . . 61
4.2 Methods . . . 64
4.2.1 Calibration method . . . 64
4.2.2 Decomposition method . . . 65
4.2.3 The total-projection-length constraint . . . 67
4.3 Descriptions of numerical simulations . . . 68
4.4 Simulation study results . . . 70
4.4.1 The effect of total-projection-length constraint . . . 70
4.4.2 The water-bath implementation of total-projection-length constraint . 72 4.4.3 The scout-scan implementation of total-projection-length constraint . 74 4.5 Conclusions and Discussions . . . 77
5 Image reconstruction algorithms for tetrahedron beam computed tomog-raphy using CUDA-enabled GPUs . . . 80
5.1 Introduction . . . 81
5.1.1 Descriptions of TBCT imaging system . . . 81
5.1.2 TBCT reconstruction algorithms . . . 84
5.2 Background . . . 87
5.2.1 Discrete imaging model for TBCT . . . 87
5.2.2 PWLS-TV iterative image reconstruction . . . 88
5.2.3 Ordered subsets acceleration strategy . . . 90
5.2.4 Simultaneous algebraic reconstruction technique . . . 92
5.3 GPU-accelerated TBCT reconstruction algorithms . . . 96
5.3.1 Measurement geometry . . . 96
5.3.2 Implementation of the FDK algorithm . . . 97
5.3.3 Implementation of the forward / backprojection operator . . . 103
5.3.4 Multi-GPU implementation of the reconstruction algorithms . . . 116
5.4 Computer simulation studies . . . 121
5.4.2 Hardware specifications . . . 122
5.4.3 Computational accuracy for full-view datasets . . . 122
5.4.4 Computational accuracy for few-view datasets . . . 126
5.4.5 Computational efficiency for GPU implementation . . . 128
5.5 Experimental studies . . . 132
5.6 Conclusion . . . 135
6 Summary . . . 137
Appendix A The derivation of the high-frequency subspace . . . 139
Appendix B Conversion of linear attenuation coefficient to the combination of two basis materials . . . 142
References . . . 144
List of Tables
3.1 Quantitative evaluation of the reconstructed images in MSE and SSIM . . . 58
5.1 The flowchart of the standard FISTA-TV algorithm . . . 89
5.2 The flowchart of the OS-SART-FISTA-TV algorithm . . . 95
5.3 The flowchart of the FDK algorithm(on kernel) . . . 102
5.4 The flowchart of the algorithm for ray-driven forward operator (on kernel) . 108
5.5 The flowchart of the algorithm for voxel-wise backprojection operator (on kernel)111
List of Figures
2.1 A schematic of the PB XPC imaging geometry is shown in which the object
is fixed in a reference coordinate system (x, y, z). The source (not shown) and
detector rotate about they-axis. . . 11
2.2 A parallel-beam projection along a directionθ in spatial domain corresponds
to a plane acquired along θ in the frequency domain. This figure illustrates
the reduced spatial resolution in the z-direction of reconstructed tomosynthesis
images. . . 13
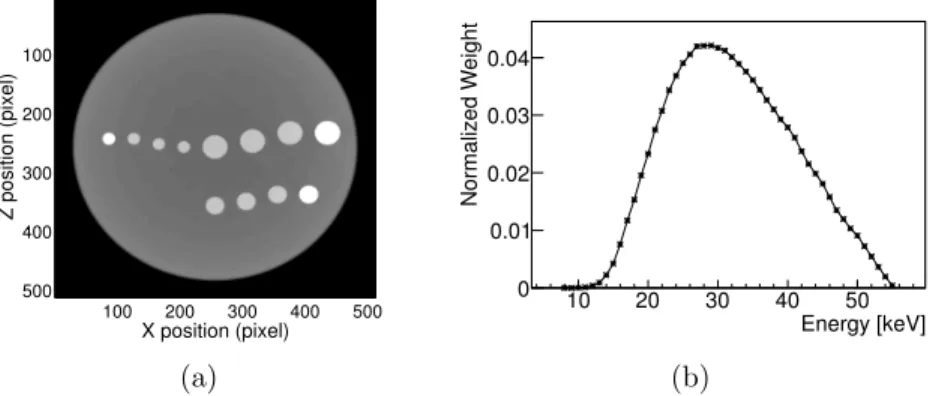
2.3 The phantom and the spectrum employed in the computer simulation. (a)
A central slice through the numerical soft tissue phantom employed in the tomosynthesis simulations is shown in the left panel (viewed from above along
the positive y-axis). The larger enclosing sphere is 4mm in diameter and is
composed of healthy breast tissue. Diameters of internal spheres range from
80µmto 160µmand are composed of adipose tissue (grey) and calcium sulfate
(white). (b) The right panel shows the polychromatic x-ray spectrum assumed
in the tomosynthesis simulations. The y-axis gives the normalized weight for
each energy bin. . . 17
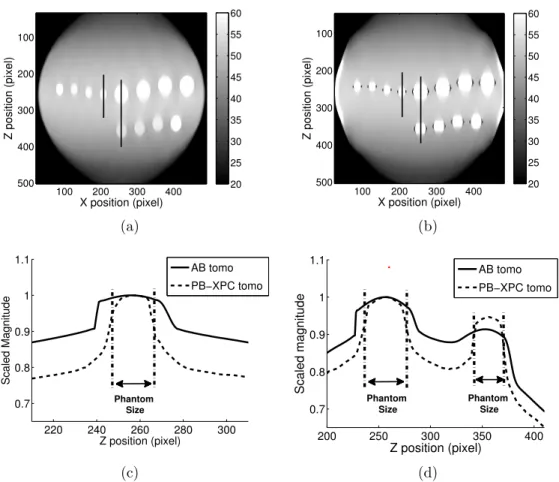
2.4 The reconstructed horizontal slices (in-depth images) are shown for AB (a)
and PB-XPC (b) tomosynthesis scans of the numerical phantom displayed in
figure 2.3(a). The grayscale window represents attenuation coefficient (m−1).
Two vertical lines in the top panels are extracted, and the corresponding scaled profiles are shown and compared in the bottom panels: (c) for the profile at
x=210, and (d) for the profile at x=256. . . 21
2.5 An overhead view of the numerical phantom is shown to indicate two depth
positions (z=256,z=354) where the corresponding in-plane images (x-yplane)
are to be extracted for the investigation of depth position determination (see
figure 2.6 and 2.7). . . 23
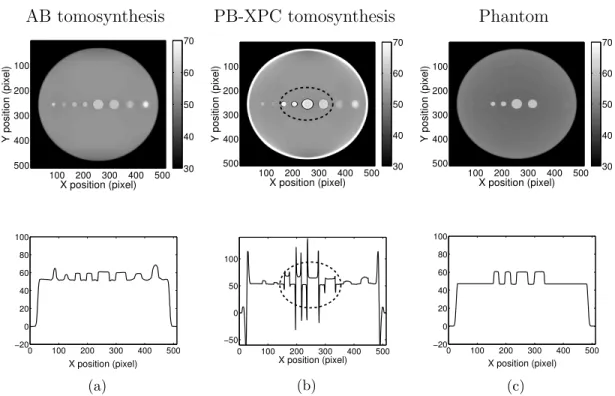
2.6 The comparisons of reconstructed in-plane images at depth position z=256
(top row) and associated profiles (bottom row) are shown here. (a) The line
profiles from AB tomosynthesis result show similar signals from all internal spheres. (b) The PB-XPC tomosynthesis result reveals edge-enhancement for some of the internal spheres. (c) The true in-plane phantom structure shows that only the edge-enhanced spheres in (b) are actually located at that
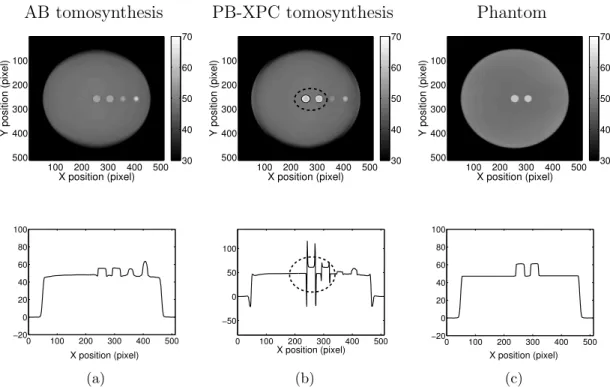
2.7 A comparison of reconstructed in-plane images at an off-center depth
posi-tion z=354 (top row) and associated profiles (bottom row) is presented. The
interpretation is similar to that in figure 2.6. . . 25
2.8 One typical projection image of an ex-vivo mouse lung sample acquired with
different propagation distances. (a) R1=R2=13cm for the AB tomosynthesis
scan; (b)R1=R2=74cm for the PB-XPC tomosynthesis scan. Due to the high
phase-contrast sensitivity during acquisition, the PB-XPC projection presents
more features of weakly absorbing microstructure than the AB projection. . 28
2.9 A comparison of reconstructed in-plane images for an ex-vivo mouse lung is
shown. The grayscale window represents attenuation coefficient (m−1). The
top and bottom rows correspond to in-plane slices located at z=4.2mm and
z=4.3mm, respectively, of the reconstructed 3D volume from AB
tomosyn-thesis (a,d), PB-XPC tomosyntomosyn-thesis (b,e), and full-view CT (c,f) data sets. Two airways are seen in the tomosynthesis results and their line profiles are delineated as the arrows indicate. For each row, edge-enhancement in the PB-XPC reconstructions is able to provide a method to identify structures
that are truly located at the particular z-position, which is verified by the
corresponding CT result. . . 29
3.1 (a) The null-space functions of the finite-view Radon transform are contained
exclusively outside a disk Ω in the Fourier domain, shown as the gray region. (b) If a to-be-imaged object has all the frequency contents confined to Ω without overlapping the null-space region, it means the object could be reliably
reconstructed. . . 38
3.2 The illustration of the reconstruction over the support r and with a virtual
maskW. FBP algorithm ensures that the reconstruction of ROI within r0 is
not affected by the masked region. . . 41
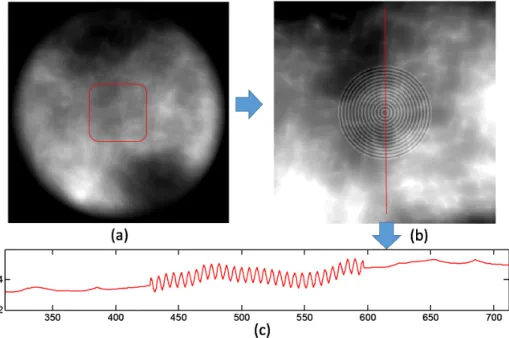
3.3 (a) The complete phantom. (b) A zoomed-in region of the phantom with
adjusted gray-value window. The dashed circle indicates the designated ROI where the capability of reconstructing high-frequency structures is expected.
(c) The extracted profile of the phantom across the center. . . 48
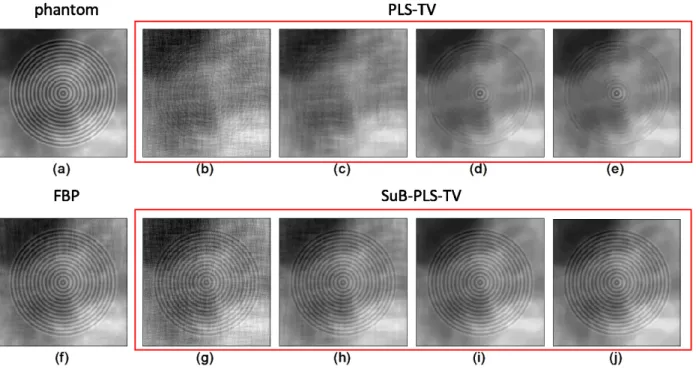
3.4 The comparison of reconstructed images inside the designated ROI. (a)
Phan-tom; (b)-(e) The PLS-TV method with increasing TV regularization parame-ter values; (f) FBP method; (g)-(j) The proposed SuB-PLS-TV method with
progressively increasing TV regularization parameter values. . . 50
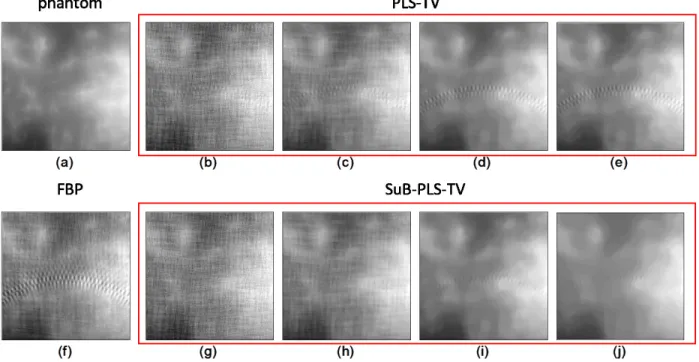
3.5 The comparison of reconstructed images outside the designated ROI. (a)
Phantom; (b)-(e) The PLS-TV reconstruction results with increasing TV reg-ularization parameter values; (f) FBP method; (g)-(j) The proposed SuB-PLS-TV reconstruction results with progressively increasing TV
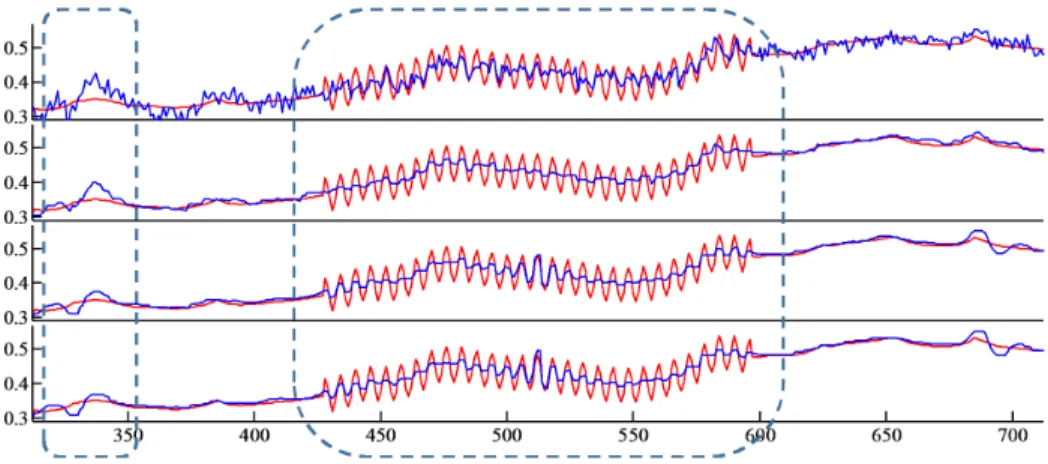
3.6 The profiles extracted from the conventional PLS-TV reconstructed images with increasing regularization parameter values (blue) and the corresponding
ground truth (red). . . 52
3.7 The profiles extracted from the SuB-PLS-TV reconstructed images with
in-creasing regularization parameter values (blue) and the corresponding ground
truth (red). . . 52
3.8 (a) The reference image of the object produced by use of the FBP algorithm
and the complete data. (b) A zoomed-in region of the designated ROI. . . . 54
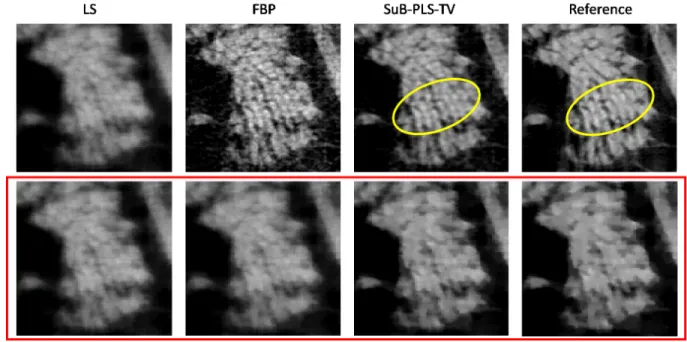
3.9 The comparison of the reconstructed ROI 2 by use of FBP, PLS-TV and
SuB-PLS-TV methods. . . 54
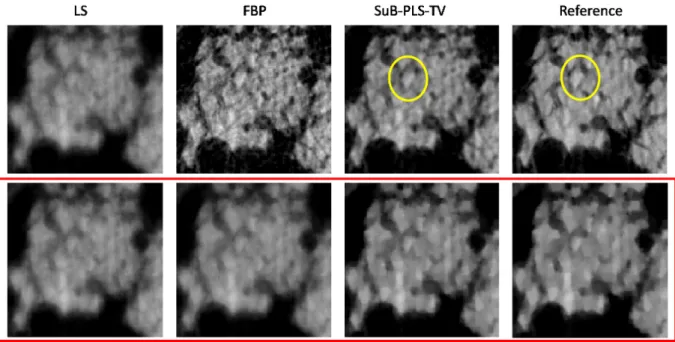
3.10 The comparison of the reconstructed ROI 3 by use of FBP, PLS-TV and
SuB-PLS-TV methods. . . 56
3.11 The comparison of the reconstructed ROI 4 by use of FBP, PLS-TV and
SuB-PLS-TV methods. . . 56
3.12 The comparison of the reconstructed region5 outside the designated ROI by
use of FBP, PLS-TV and SuB-PLS-TV methods. . . 57
4.1 (a) The numerical breast phantom. (b) A schematic view of the arrangement
of calibration phantoms. (c) The two spectra employed in the numerical studies. 69
4.2 The decomposition results obtained by use of the conventional method (1%
noise) . . . 70
4.3 The decomposition results obtained by use of total-projection-length
con-strained method (1% noise) . . . 71
4.4 The decomposition results obtained by use of total-projection-length
con-strained method (10% noise) . . . 72
4.5 The total-projection-length constrained decomposition results using
“water-bath” method (1% noise) . . . 74
4.6 (a) The 3D numerical breast phantom. (b) The acquisition geometry of the
scout scan. (c) A typical simulated projection image. . . 75
4.7 (a) The central vertical slice of the reconstructed image from 30-view data
set. (b) The total-projection-length along the X-ray beam direction extracted
from the reconstructed image. . . 75
4.8 The total-projection-length constrained decomposition results using
“scout-scan” method (5% noise) . . . 76
5.1 Diagram of TBCT geometry. . . 82
5.2 Side view of TBCT. . . 82
5.3 (a) A possible configuration of dual-source, dual-detector TBCT system mounted
on a regular LINAC gantry. (b) Dimensions of a commercial LINAC with
kV-CBCT installed. . . 84
5.5 The illustrations of backprojection processes for CBCT (left) and TBCT
(right). . . 98
5.6 Reconstruction performance of the TBCT-FDK previously reported. (left) the
central vertical plane of the phantom; (right) the corresponding reconstructed image; (right) the profile comparison along the central vertical line. . . 100
5.7 Reconstruction performance of the TBCT-FDK developed by the author.
Each column corresponds to different weight strategy for handling “data re-dundancy” issue. . . 100
5.8 The schemtatics for (a)voxel-driven backprojection, (b) ray-driven (Siddon’s
method) projection, (c) ray-driven (interpolation method) projection, (d) distance-driven forward/backprojection. . . 105
5.9 A 2D illustration of Siddon’s ray-tracing strategy in which intersections of the
ray with lines are considered. . . 107
5.10 An illustration of the “shadow formation” which is used to determine the
range of pixels for backprojection with respect to a given voxel. . . 110
5.11 A prediction can be made to exclude those sources not involved in the back-projections for a specific voxel. . . 112 5.12 An illustration of the pixel-wise implementation of the backprojection. A
similar ray-tracing process is conducted to update all the voxels along the ray. 114 5.13 A schematic of 4-GPU implementation for OS-SART-FISTA-TV algorithm. . 118
5.14 Four different TBCT system designs with Ns =1,2,8 and 64, respectively. . . 123
5.15 The central vertical slices of the reconstructed images for full-view dataset
Nv = 360 . . . 124
5.16 The central vertical slices of the reconstructed images for few-view dataset
Nv =360, 180, 90 and 45. . . 127
5.17 single-GPU FDK reconstruction times. N = 5123;M = 10242×360. . . 129
5.18 single-GPU forward and backprojection times (per iteration) . . . 130
5.19 Multi-GPU reconstruction times for iterative algorithm (per iteration). N =
5123; M = 10242 ×360. . . 131
5.20 Multi-GPU reconstruction times for iterative algorithm (per iteration). N =
2563; M = 5122×360. . . 131
5.21 Relative error as a function of iteration numbers for OS-SART-FISTA-TV algorithm . . . 132 5.22 A picture of the bench-top TBCT system. . . 133 5.23 A diagram of the bench-top TBCT system illustrating the geometry and
elec-trical connection. . . 133
Acknowledgments
Foremost, I would like to express my sincere gratitude to my advisor Prof. Mark A. Anas-tasio, for his advice, encouragement and mentorship throughout all these years. I am deeply impressed by his immense knowledge, insightful thoughts and high research standard from which I gained great benefits during my research experience. Dr. Anastasio is always enthu-siastic, energetic and open to discussion with his students. It has been my great honor to work under his supervision, learning to be a serious imaging scientist, as well as the impor-tance of an open and curious mind, a positive attitude, and great self-discipline in scientific endeavors.
Besides my advisor, I would like to thank all the other members of my thesis committee: Dr. Hua Li, Dr. Deshan Yang, Dr. Tiezhi Zhang and Dr. Quing Zhu, for their insightful comments and helpful discussions. Many thanks go to our collaborator Prof. Alessandro Olivo in UCL and his team who contributed a lot of nice experimental data sets.
I would also like to thank some former senior labmates who have graduated or completed their research roles in Anastasio’s group, Dr. Qiaofeng Xu, Dr. Alfred Garson, Dr. Kun Wang and Dr. Chao Huang, who trained and guided me early in my research life. Their ingenuity and hard work have been a constant inspiration and encouragement to me. I have
also received generous help and enormous support from my current labmates, Thommas Matthews, Yang Lou, Yujia Chen, Joe Poudel, and Weimin Zhou. This dissertation would not have been possible without their supports.
Last but not the least, I owe special thanks to my family for their unconditional love, trust and encouragement, which have made this dissertation possible and the whole process rewarding.
Huifeng Guan
Washington University in Saint Louis Dec 2017
ABSTRACT OF THE DISSERTATION
System Characterizations and Optimized Reconstruction Methods for Novel X-ray Imaging Modalities
by Huifeng Guan
Doctor of Philosophy in Biomedical Engineering Washington University in St. Louis, Dec 2017 Research Advisor: Professor Mark A. Anastasio
In the past decade there have been many new emerging X-ray based imaging
technolo-gies developed for different diagnostic purposes or imaging tasks. However, there exist
one or more specific problems that prevent them from being effectively or efficiently em-ployed. In this dissertation, four different novel X-ray based imaging technologies are dis-cussed, including propagation-based phase-contrast (PB-XPC) tomosynthesis, differential X-ray phase-contrast tomography (D-XPCT), projection-based dual-energy computed ra-diography (DECR), and tetrahedron beam computed tomography (TBCT). System charac-teristics are analyzed or optimized reconstruction methods are proposed for these imaging modalities. In the first part, we investigated the unique properties of propagation-based phase-contrast imaging technique when combined with the X-ray tomosynthesis. Fourier slice theorem implies that the high frequency components collected in the tomosynthesis data can be more reliably reconstructed. It is observed that the fringes or boundary en-hancement introduced by the phase-contrast effects can serve as an accurate indicator of the
true depth position in the tomosynthesis in-plane image. In the second part, we derived a sub-space framework to reconstruct images from few-view D-XPCT data set. By introducing a proper mask, the high frequency contents of the image can be theoretically preserved in a certain region of interest. A two-step reconstruction strategy is developed to mitigate the risk of subtle structures being oversmoothed when the commonly used total-variation regu-larization is employed in the conventional iterative framework. In the thirt part, we proposed a practical method to improve the quantitative accuracy of the projection-based dual-energy material decomposition. It is demonstrated that applying a total-projection-length con-straint along with the dual-energy measurements can achieve a stabilized numerical solution of the decomposition problem, thus overcoming the disadvantages of the conventional ap-proach that was extremely sensitive to noise corruption. In the final part, we described the modified filtered backprojection and iterative image reconstruction algorithms specifically developed for TBCT. Special parallelization strategies are designed to facilitate the use of GPU computing, showing demonstrated capability of producing high quality reconstructed volumetric images with a super fast computational speed. For all the investigations men-tioned above, both simulation and experimental studies have been conducted to demonstrate the feasibility and effectiveness of the proposed methodologies.
Chapter 1
Introduction
In the past decade there have been many new emerging X-ray based imaging
technolo-gies developed for different diagnostic purposes or imaging tasks. However, there exist
one or more specific problems that prevent them from being effectively or efficiently em-ployed. In this dissertation, four different novel X-ray based imaging technologies are dis-cussed, including propagation-based phase-contrast (PB-XPC) tomosynthesis, differential X-ray phase-contrast tomography (D-XPCT), projection-based dual-energy computed ra-diography (DECR), and tetrahedron beam computed tomography (TBCT). System charac-teristics are analyzed or optimized reconstruction methods are proposed for these imaging modalities. The goal and purpose of this dissertation is to investigate the advantages of these technologies or to improve the current imaging performance by developing new methodologies or strategies, promoting wider uses of these technologies in clinical or biological applications. We will briefly review these imaging modalities and their specific problems in this chapter.
1.1
Background and Motivation
Although conventional absorption-based (AB) tomosynthesis techniques have been exten-sively studied and implemented for numerous imaging applications [114, 157, 61], only a small number of studies have explored migrating X-ray phase-contrast (XPC) techniques to tomosynthesis and its potential advantages. X-ray phase-contrast imaging (XPCI) has proved to hold promise for a variety of biomedical applications [106, 92, 195]. Propagation-based XPC (PB-XPC) imaging, also known as in-line XPC imaging, is the simplest form to implement on the benchtop. To date, relatively few publications have specifically focused on propagation-based X-ray phase-contrast tomosynthesis [190, 151]. While previous studies [66, 167] showed PB-XPC tomosynthesis is able to produce boundary-enhanced in-plane im-ages that better reveal tissue interfaces than conventional AB tomosynthesis, there remains a lack of reported experiments and analyses that discuss the resolving abilities of PB-XPC tomosynthesis in the depth direction. In this dissertation we will present numerical and experimental investigations that compare the ability of AB and PB-XPC tomosynthesis to distinguish between in-plane and out-of-plane structures. The results reveal that, in PB-XPC tomosynthesis, the phase-contrast-induced fringes can help discriminate in-plane structures from out-of-plane structures, thus providing better depth-position characterization than AB tomosynthesis.
Besides the propagation-based XPC imaging, there are a few other implementations of XPCI techniques that are generally referred to as differential phase-contrast imaging (D-XPCI) methods. They typically yield estimates of the one-dimensional (1D) derivative of the pro-jected real-valued component of the refractive index distribution of an object. In this work, a tomographic implementation of differential XPCI is considered, referred to as differential X-ray phase-contrast tomography (D-XPCT). The goal of D-XPCT is to produce an estimate
of the real-valued component of the refractive index distribution, which describes the spa-tially variant refractive properties of an object. When the data are acquired at a sufficiently large number of tomographic views [145], image reconstruction in D-XPCT can be read-ily accomplished by use of a modified filtered backprojection (FBP) algorithm[47, 69, 127]. However, in current implementations of D-XPCT, it may not be desirable to acquire data at a large number of tomographic view angles. This is because D-XPCT methods are cur-rently limited by relatively long data-acquisition times and radiation exposures, which has
hindered the widespread application of the method to in vivo applications. Since current
implementations typically utilize a ’step-and-shoot’ data-acquisition protocol, one way to mitigate this problem is to acquire tomographic measurements at a reduced number of view angles. The associated image reconstruction problem is generally referred to as a ’few-view’ image reconstruction problem [140, 15]. Modern few-view image reconstruction methods are optimization-based and typically utilize an iterative method to find a finite-dimensional estimate of the object function that approximately minimizes an objective function subject to constraints. Because few-view image reconstruction corresponds to an ill-conditioned in-verse problem, a regularized solution must be computed; however the design of an effective regularization strategy is influenced by many factors, including the characteristics of the re-fractive index distribution to be estimated. It remains challenging to design a regularization strategy that faithfully preserves fine object features in the reconstructed image when only few-view tomographic data are utilized. In this work, a new method for few-view image reconstruction in D-XPCT is proposed and investigated. A distinctive feature of the method is that the sought-after object function is decomposed into two components that reside in distinct subspaces. In this way, the higher-frequency components and lower-frequency com-ponents of the object function are separated and reconstructed respectively, recovering a resolution-enhanced region of interest (ROI) from few-view measurements.
Dual-energy computed radiography (DECR)[24, 121] is a planar imaging technique in which two (or two sets of) projections using two different incident beam spectra are acquired of the same object. X-ray attenuation for the range of energies employed in diagnostic radiography consists of contributions from photoelectric absorption and Compton scatter-ing. The probabilities for the two types of interactions are relatively independent of energy and material composition. Two X-ray projections of an object, one acquired with a high energy beam and the other with a low energy beam, will have differences in detected in-tensities between the two radiographs which depend on the composition of the object. For an object composed of two materials, these intensity changes can be exploited to form two basis material images[5, 23]. This procedure is often referred to as material decomposi-tion. The decomposed information can facilitate material segmentation or identification of an abnormality[131, 159]. Though projection-based decomposition is essentially free of the beam hardening problem[131], DECR seeks the solution of a highly nonlinear and ill-posed inverse problem which is quite sensitive to noise[11, 22]. This is because the exact dual-energy imaging model should incorporate a polychromatic X-ray source spectrum that introduces transcendental functions. This limitation has prevented its widespread implementation in medical imaging applications. To mitigate this problem, we propose to introduce a constraint of total projection length, which can effectively stabilize the conventional projection-based material decomposition. We also develop two feasible “water-bath” and “scout-scan” ideas that can be used to practically implement the desired constraint. Numerical studies show that our method is capable of accurate two-material decomposition and shows robustness against data noise.
Tetrahedron beam computed tomography (TBCT) is a novel volumetric imaging system with a modified geometrical design compared to the commonly used cone-beam computed tomography (CBCT)[178]. In TBCT, a linear array of sources are stacked vertically, forming
a series of quasi-fan beams directed towards a linear CT detector array that is positioned orthogonally to the source array. During the scan, the X-ray source sequentially operates
along the z-direction and the corresponding projection images are continuously recorded at
every angular position. While the gantry rotates around the object, the collected data can be used for volumetric image reconstruction. TBCT holds great promise of mitigating scatters. The source collimator is adjusted to make sure that all fan beams are well aligned with the the central row of the detector, so most scattered photons are deflected out of the fan beam paths and therefore go undetected. TBCT also features flexible geometrical settings and can be further modified to incorporate dual-source arrays and dual-detector arrays to increase FOV and to facilitate imaging guided radiation therapy (IGRT)[83]. Though a few preliminary image reconstruction results came along with the invention of TBCT, however, a careful investigation of the reconstruction algorithms specific to the TBCT geometries has not been found. In this dissertation, we derived a reliable analytical reconstruction method from the conventional FDK algorithm by introducing a proper weighting function in the TBCT image domain. An advanced optimization-based iterative algorithm is also developed that features fast convergence rate and robustness against data noise and data incompleteness. In order to efficiently exploit the parallelism in GPU computing, the reconstruction algorithms were further optimized with special computational strategies. The reconstructed results from numerical and experimental data sets have demonstrated the good performances of the proposed reconstruction algorithms in terms of both the image quality and computational efficiency.
1.2
Overview of the Dissertation
In the following chapters, the dissertation will discuss four topics regarding the system characterization or optimized reconstruction methods for the novel X-ray imaging modalities that have been introduced above.
Chapter 2 investigates the unique properties of propagation-based phase-contrast imaging technique when combined with the X-ray tomosynthesis. The Fourier slice theorem implies that the high frequency components collected in the tomosynthesis data can be more reliably reconstructed. It is revealed that the fringes or boundary enhancement introduced by the phase-contrast effects can behave as an accurate indicator of the true depth position in the tomosynthesis in-plane image.
Chapter 3 derives a sub-space framework to reconstruct images from a few-view differential phase-contrast tomography (DPCT) data set. By introducing a proper mask and designing a novel two-step reconstruction strategy, the high frequency information of the image can be largely preserved in a certain region of interest. It mitigates the concerns that subtle structures might be oversmoothed when the commonly used total-variation regularization is incorporated in the conventional iterative framework.
Chapter 4 proposes a practical method to improve the quantitative accuracy of the projection-based dual-energy material decomposition. It is discovered in this work that applying a total-projection-length constraint along with the dual-energy measurements can achieve a stabilized numerical solution of the decomposition problem, thus overcoming the disadvan-tages of the conventional approach that was extremely sensitive to noise corruption.
Chapter 5 describes the modified filtered backprojection and iterative image reconstruction algorithms specifically developed for tetrahedron beam computed tomography (TBCT). Spe-cial parallelization strategies are designed to facilitate the use of GPU computing, showing demonstrated capability of producing high quality reconstructed volumetric images with a super fast computational speed.
Chapter 2
Investigation of the boundary
enhancement in propagation-based
X-ray phase contrast tomosynthesis
Propagation-based X-ray phase-contrast (PB XPC) tomosynthesis combines the concepts of tomosynthesis and XPC imaging to realize the advantages of both for biological imaging applications. Tomosynthesis permits reductions in acquisition times compared with full-view tomography, while XPC imaging provides the opportunity to resolve weakly absorbing structures. In this Note, an investigation of the depth resolving properties of PB XPC tomosynthesis is conducted. The results demonstrate that in-plane structures display strong boundary-enhancement while out-of-plane structures do not. This effect can facilitate the identification of in-plane structures in PB XPC tomosynthesis that could normally not be distinguished from out-of-plane structures in absorption-based tomosynthesis.
2.1
INTRODUCTION
X-ray phase-contrast (XPC) imaging holds promise for a variety of biomedical applications [106, 92, 195].There exist several implementations of XPC imaging that include crystal-based diffraction enhanced imaging approach[38], grating-based method that uses a Talbot inter-ferometry [163] and a more recently developed coded aperture variety [120]. Propagation-based XPC (PB XPC) imaging, also known as in-line XPC imaging, is the simplest form to implement on the benchtop. It requires only a microfocus X-ray source, a high resolu-tion detector, and an appropriately defined imaging geometry [166, 170, 62]. In practice, these requirements lead to longer imaging times than typically encountered in conventional absorption-based (AB) radiography. This can be problematic in tomographic implementa-tions of PB XPC imaging, which can result in imaging times of several hours or longer. While volumetric XPC imaging can potentially benefit a variety of pre-clinical and clinical appli-cations [198, 21], long imaging times currently prevent its widespread use. One approach to circumvent lengthy scan durations is to apply tomosynthesis methods [43, 44] that seek to reconstruct volumetric images from a relatively small number of projections spanning a
limited angular range (<180◦). Such images have anisotropic spatial resolution properties;
the resolution is generally high in a particular transverse plane and poor in the direction perpendicular to that plane [132]. In this work, this direction will be referred to as the depth direction.
Although conventional AB tomosynthesis techniques have been extensively studied and im-plemented for numerous imaging applications [114, 157, 61], only a small number of studies have explored phase-contrast tomosynthesis and its potential advantages for various modal-ities that include diffraction enhanced, grating-based interferometric and edge illumination XPC imaging [101, 79, 191, 136, 152]. To date, relatively few publications have specifically
focused on propagation-based imaging methods [190, 151]. While previous studies [66, 167] showed PB-XPC tomosynthesis is able to produce boundary-enhanced in-plane images that better reveal tissue interfaces than conventional AB tomosynthesis, there remains a lack of reported experiments and analyses that discuss the resolving abilities of PB XPC tomosyn-thesis in the depth direction. In this Note, numerical and experimental investigations are presented that compare the ability of AB and PB-XPC tomosynthesis to distinguish between in-plane and out-of-plane structures. The results reveal that, in PB-XPC tomosynthesis, the phase-contrast-induced fringes can help discriminate in-plane structures from out-of-plane structures, thus providing better depth-position characterization than AB tomosynthesis.
2.2
BACKGROUND
2.2.1
PB XPC imaging model
A PB-XPC tomographic imaging geometry is depicted in figure 2.1. A reference coordinate system (x, y, z) is related to a rotating coordinate system (xr, y, zr) by xr = xcosθ +zsinθ
and zr =zcosθ−xsinθ, where the tomographic view angleθ is measured with respect to the
positive x-axis. The y-axis defines the axis of tomographic scanning (isocenter). An X-ray
source is located atzr =−R1; for simplicity, we assume for now that this is a monochromatic
point source with wavelength λ.
The object can be characterized by its complex-valued refractive index distribution
Figure 2.1: A schematic of the PB XPC imaging geometry is shown in which the object is
fixed in a reference coordinate system (x, y, z). The source (not shown) and detector rotate
about they-axis.
where r = (x, y, z). The projected attenuation coefficient µp(xr, y, θ) and the total phase
shift φp(xr, y, θ) are respectively defined as
µp(xr, y, θ) = 2k Z dzrβ(r) (2.2) and φp(xr, y, θ) =−k Z dzrδ(r), (2.3)
where k= 2π/λ. The integrals are computed along the X-ray beam path, which is
approxi-mately the zr-direction when paraxial conditions are assumed, as are throughout this work.
The total attenuation experienced by the wavefield as it traverses the object is defined as
Assuming the phase varies moderately over a small distance and the near field approximation holds, the measured intensity approximately satisfies [170]
Id(xr, y, θ) =I0(xr, y, θ){A2(xr, y, θ)− 2λR2
πM ∇
2
xr,y[A2(xr, y, θ)φp(xr, y, θ)]}, (2.5)
whereM = (R1+R2)/R1 and∇2xr,y is the 2D Laplacian operator acting on the (xr, y) plane.
The quantity I0(xr, y, θ) represents the wavefield intensity on the plane zr = 0, i.e., the
wavefield intensity incident on the object.
2.2.2
Data function
Consider the data function
gxpc(xr, y, θ)≡ −log{
Id(xr, y, θ)
I0(xr, y, θ)
}, (2.6)
which can formed from the known quantitiesId(xr, y, θ) andI0(xr, y, θ). Under the assump-tions required to establish equation (2.5) and additionally assuming weak absorption, this data function approximately satisfies [26]
gxpc(xr, y, θ) =µp(xr, y, θ) + 2λR2
πM ∇
2
xr,yφp(xr, y, θ). (2.7)
In the special case when R2 = 0, equation (2.7) yields a data function for conventional AB
tomosynthesis given by
Figure 2.2: A parallel-beam projection along a directionθ in spatial domain corresponds to
a plane acquired along θ in the frequency domain. This figure illustrates the reduced spatial
resolution in the z-direction of reconstructed tomosynthesis images. and therefore equation (2.7) can be expressed as
gxpc(xr, y, θ) =gabs(xr, y, θ) + 2λR2
πM ∇
2
xr,yφp(xr, y, θ). (2.9)
2.2.3
Interpretation of boundary-enhanced image
Given the assumed paraxial conditions, it has been demonstrated that the application of the
Feldkamp-Davis-Kress inversion formulaR−1 to the PB XPC data function yields [26]
f(r)≡ R−1{g xpc}= 2kβ(r) + R2 M∇ 2 xyzδ(r), (2.10) where ∇2
xyz denotes the 3D Laplacian operator. Equation (2.10) defines the object function
for boundary-enhanced PB XPC tomography (XPCT). The second term in equation 2.10 explains why this implementation of PB-XPCT produces boundary-enhanced images [164,
2.2.4
Fourier slice interpretation of tomographic depth resolution
The well-known Fourier slice theorem states that a parallel-beam projection along a direction
θ in space corresponds to a plane acquired along θ in the frequency domain. Let (kx, ky, kz)
denote the spatial frequency coordinates that are conjugate to (x, y, z). Figure 2.2 illustrates
the Fourier slice theorem and displays the (kx, kz) plane with a shaded region corresponding
to the frequency component information contained in the measured data from a generic
to-mosynthesis scan covering the angular range±θ [132]. This figure can be utilized to explain
why tomosynthesis produces limited depth resolution: the acquired information along the
kz-direction in region A is incomplete due to the limited angular range of the scan, especially
at low frequencies near the origin. It also illustrates why depth resolution in tomosynthe-sis depends on object size; namely, small objects typically possess better resolution in the
depth-direction than do larger objects [132, 3]. This is because for higher frequencies of kx
(corresponding to smaller feature sizes), there exists an increasing coverage inkz (region B).
The result above is a characteristic of tomosynthesis methods in general. A similar analysis can be applied to interpreting the specific frequency domain characteristics of PB-XPC tomosynthesis signals. According to the PB-XPC imaging model described in equation (2.9), for a certain angle view, the Fourier transform of a PB-XPC projection satisfies
F(gxpc(xr, y)) = F(gabs(xr, y)) + λR2π2(k2xr +k
2
y)F(φp(xr, y)), (2.11)
whereF represents the 2D Fourier transform operator acting on the (xr,y) plane;kxr andky
are the frequency variables conjugate toxr andy. Due to the factor (k2xr+k
2
y), the frequency
components of the second term on the right-hand side of equation (2.11) will be amplified, with increasing amplification for increasing frequency. However, the frequency components
contained in the first term (attenuation term) will be unaltered. This indicates that the
PB-XPC tomosynthesis data function gxpc contains enhanced high-frequency components
as compared to the conventional AB tomosynthesis data function gabs. The interpretation
of figure 2.2 indicates that there is a wider coverage of kz in high-frequency data space,
which implies PB-XPC tomosynthesis is able to preserve a significant amount of information
content in kz, allowing for improved ability of depth position characterization. This analysis
can be extended readily to the polychromatic case, where the general conclusions remain unaltered. Computer-simulations and experimental studies that are based on a benchtop polychromatic X-ray source are described next.
2.3
MATERIALS and METHODS
2.3.1
Reconstruction algorithm
There are several reconstruction methods available for conventional tomosynthesis that can be applied to reconstruct boundary-enhanced images in PB-XPC tomosynthesis [53]. The most frequently employed reconstruction algorithm is commonly referred to as shift and add (SAA) [86]. However, SAA is essentially an unfiltered backprojection algorithm and will result in image blurring. Filtered backprojection (FBP) algorithms [90, 104] also have an inherent deficiency as they are based on the analytical inverse of the Radon transform, with the assumption that the complete data space has been densely sampled.
Iterative reconstruction algorithms have proven to be well suited to the tomosynthesis prob-lem [168, 193]. Iterative algorithms are flexible in regard to the measurement geometry and
can mitigate data incompleteness. In this work, the vectorgM×1 denotes the measured
pro-jection data that have been lexicographically ordered. The vector fN×1 is used to represent
the 3D discrete object using voxels. The value of N corresponds to the number of voxels
used to represent f. The relationship between the acquired data g and the discrete objectf
can be described as
g=Hf, (2.12)
where H is an M ×N system matrix that can be interpreted as a discrete operator
repre-senting a cone-beam projection transformation.
In this work, the estimates off were determined by solving the following total-variation (TV)
regularized least square optimization problem [143, 175]:
ˆf = argmin
f {kg−Hfk
2
2+ 2ζkfkT V}, (2.13)
where k · kT V denotes the discrete TV (semi)-norm that can remove noise from the
sought-after solution and ζ is a regularization parameter that balances the denoising effect and
how well the solution fits the data. Equation (2.13) states that the sought-after solution
ˆf corresponds to the vector f that minimizes the value of the penalized least-squares cost
function enclosed by the brackets.
A modified version of the fast iterative shrinkage/thresholding algorithm (FISTA) was em-ployed to solve equation (2.13). The basic FISTA structure includes a gradient-based image update to obtain an intermediate solution and then a proximal map problem solved by fast gradient projection (FGP) algorithm. A detailed description of the standard FISTA in the 2D case can be found elsewhere [13]. We developed an advanced algorithm that extended the FGP algorithm to the 3D case and incorporated the concept of ordered subsets (OS) with
X position (pixel) Z position (pixel) 100 200 300 400 500 100 200 300 400 500 (a) Energy [keV] 10 20 30 40 50 N o rm a liz e d W e ig h t 0 0.01 0.02 0.03 0.04 (b)
Figure 2.3: The phantom and the spectrum employed in the computer simulation. (a) A central slice through the numerical soft tissue phantom employed in the tomosynthesis
sim-ulations is shown in the left panel (viewed from above along the positivey-axis). The larger
enclosing sphere is 4mm in diameter and is composed of healthy breast tissue. Diameters
of internal spheres range from 80µm to 160µm and are composed of adipose tissue (grey)
and calcium sulfate (white). (b) The right panel shows the polychromatic x-ray spectrum
assumed in the tomosynthesis simulations. The y-axis gives the normalized weight for each
energy bin.
SART (Simultaneous Algebraic Iterative Reconstructive Technique) to dramatically increase the convergence speed [172, 173].
2.3.2
Simulation Studies
Phantom design: Figure 2.3(a) shows a central slice of the numerical phantom employed to
investigate the depth resolution properties of PB-XPC tomosynthesis. An x-z slice through
the phantom is displayed. Eight spheres were placed in a row along the x-direction with
the z-coordinate of their center positions slightly offset from one another. Four additional
spheres were located in a row off-center from the axis of rotation with a similar arrangement of their central locations. These spherical volumes were assigned realistic tissue properties (large sphere: breast tissue; internal spheres: adipose and calcium sulfate) to mimic healthy soft tissue and calcifications. The refractive index values were analytically calculated [179]
based on their respective element composition1 and atomic scattering factors2. Three sizes
of internal sphere were employed (diameters: 80µm, 120µm and 160µm) and the diameter
of the phantom was 4mm. To avoid numerical difficulties in applying the Laplacian operator
in the imaging model (equation (2.10)), a 3D Gaussian blurring kernel (FWHM=10µm)
was applied to the numerical phantom model, which ensured that the boundaries between different tissues were differentiable.
Imaging system: The geometry of the simulated tomosynthesis imaging system is illustrated
in figure 2.1. The source and flat-panel detector simultaneously rotate in full isocentric
motion with a specified angular step (2◦) and scan range (±20◦). The input energy spectrum
of the simulated X-ray beam (figure 2.3(b)) was provided by an on-line toolbox that modeled
a polychromatic source with a solid tungsten anode operated at 55 kVp 3. The simulated
polychromatic projections were calculated as the weighted sum of the detected intensity associated with each energy component of the spectrum. The X-ray detector was modeled
with 8-micron pixel pitch in a 1024×1024 pixel2 flat panel array. The source-to-isocenter
distanceR1 was set to be 50cm.
Simulated data: According to the paraxial Fresnel diffraction theory, both AB and PB-XPC
tomosynthesis measurement data were numerically generated by convolving the X-ray wave
function right through the object (atz=R1) with the Fresnel-Kirchhoff kernel [129]. Different
propagation distancesR2=0 cm andR2=50 cm were chosen for AB and PB-XPC scenarios,
respectively. As depicted in figure 2.1, the projection at θ=0 corresponded to the incident
beam traveling in the +z direction. Realistic blurring factors were considered (e.g. the finite
source spot size, and the limited detector resolving power) by applying an additional 2D 1http://physics.nist.gov/PhysRefData/XrayMassCoef/tab2.html
2http://physics.nist.gov/PhysRefData/FFast/html/form.html
Gaussian blurring kernel (FWHM=40 µm) to the simulated intensity data. For simplicity, 1% (with respect to the noiseless pixel value) uncorrelated Gaussian noise was added to the projection data. This noise model is consistent with the experimental studies described below, in which a large number of photons were detected.
Image reconstruction: The iterative algorithm described in Section 2.3.1 was employed to
reconstruct AB and PB-XPC tomosynthesis images from the simulated measurements. The
voxel size of the reconstructed images was 8 µm3. The regularization parameter ζ was
empirically set at 0.5 for all studies. By convention, reconstructed x-y slices are referred
to as in-plane images throughout this paper; reconstructed x-z slices are correspondingly
referred to as in-depth images.
2.3.3
Experimental Studies
Imaging system: Experimental AB and PB-XPC projection data were acquired. The imaging
system employed in the experimental studies contained a Kevex PSX10-65W microfocus source with a tungsten anode (Thermofisher) and a super-cooled Si-based CCD camera with
15 micron pixel pitch, 36 cm2 detection area (Quad-RO, Princeton Instruments). A detailed
description of the imaging system can be found elsewhere [51]. In contrast to the system configuration employed in the simulations in which the source/detector rotates about a fixed object, the experimental system is configured with a fixed source/detector and rotating object. Both configurations represent complete isocentric motion and are in all respects equivalent except for the frame of reference. The data for the experimental component of
Data acquisition: The object in the experimental study was a formalin-fixed mouse lung
placed in a 1 cm3 centrifuge tube. As that in the PB-XPC simulations, the sample was
positioned midway between the source and detector, indicating that R1=R2. The relative
amount of phase-contrast effects present in projection images was modified by selecting
short (13 cm) and long (74 cm) propagation distances (i.e. R2 in equation 2.7) to record
“AB-like” and XPC projection data, respectively. It should be noted that we employed a
cone beam geometry and maintained a constant geometric magnification factor (M = 2)
for both AB and XPC cases so that effective pixel size (= 15µm/M) would be constant
and not affect comparison of AB and XPC results. The Pb shielding for our X-ray source
results in a minimum R1 of 13cm. Accordingly, we utilized R2 =13 cm to acquire
“AB-like” images that had the same geometric magnification (M = 2). The exposure times were
0.7 s and 80 s, respectively. The imaging dose was not held constant but this does not affect our conclusions in any way. The experimental tomosynthesis data sets contained 21
equally spaced projections where the sample was rotated from −20◦ to +20◦. A complete
CT data set was also acquired (R2=13cm, 100 projections with an angular step of 2◦)
to generate a reference image for comparison. All images were reconstructed by use of
the iterative algorithm with a voxel size of 30 µm3. The reconstructed AB and PB-XPC
tomosynthesis images were analyzed to compare and contrast their respective depth-position-characterization features.
X position (pixel) Z position (pixel) 100 200 300 400 100 200 300 400 500 20 25 30 35 40 45 50 55 60 (a) X position (pixel) Z position (pixel) 100 200 300 400 100 200 300 400 500 20 25 30 35 40 45 50 55 60 (b) 220 240 260 280 300 0.7 0.8 0.9 1 1.1 Z position (pixel) Scaled Magnitude AB tomo PB−XPC tomo Phantom Size (c) 200 250 300 350 400 0.7 0.8 0.9 1 1.1 Z position (pixel) Scaled magnitude AB tomo PB−XPC tomo Phantom Size Phantom Size (d)
Figure 2.4: The reconstructed horizontal slices (in-depth images) are shown for AB (a) and PB-XPC (b) tomosynthesis scans of the numerical phantom displayed in figure 2.3(a). The
grayscale window represents attenuation coefficient (m−1). Two vertical lines in the top
panels are extracted, and the corresponding scaled profiles are shown and compared in the
2.4
RESULTS
2.4.1
Simulation Studies
In-depth images (x-z plane, y=256) reconstructed from the simulated AB and PB-XPC
tomosynthesis data are shown in figure 2.4(a) and 2.4(b), respectively. In both figures, the
reconstructed objects are no longer sphere-like but are distorted along the z-direction. To
better compare the results, profiles alongz-direction atx=210 andx=256 were extracted and
plotted in figure 2.4(c) and 2.4(d). Each profile was normalized to its maximum magnitude. The horizontal double-arrow lines indicate the true size of the phantom’s internal spheres in this plane. This comparison shows the PB-XPC tomosynthesis profile more accurately represents the structure of the phantom than does the AB tomosynthesis profile. In addition, the PB-XPC profiles presents a higher signal-background contrast, and ultimately performs better than AB tomosynthesis in terms of reproducing the size of the spherical objects inside the phantom. Similar findings were observed (not shown) in the profiles of other spheres corresponding to calcifications. It is also notable that both profiles are more closely aligned with the true structure of the smaller sphere than the larger sphere, as predicted through the Fourier slice interpretation discussed in Section 2.2.4.
Another feature to note in the reconstructed PB-XPC images is the spatial distribution of the edge-enhanced features displayed in figure 2.4(b). It is observed that the fringes in
the in-depth XPC image are prominent near the true z-position of the spherical inclusions
and are not present away from this position. In this simple computer-simulation where the object inclusions are modeled as uniform spheres, the center of masses of the blurred spheres in the AB image could also be employed to estimate the locations of their centers. However, in the more general situation where the inclusions do not possess symmetry, this
X position (pixel) Z position (pixel) 100 200 300 400 500 100 200 300 400 500 30 35 40 45 50 55 60 65 70
Figure 2.5: An overhead view of the numerical phantom is shown to indicate two depth
positions (z=256, z=354) where the corresponding in-plane images (x-y plane) are to be
extracted for the investigation of depth position determination (see figure 2.6 and 2.7).
would not always be the case. These observations suggest that the edge-enhanced features in PB-XPC tomosynthesis can potentially allow for improved depth-position determination of reconstructed in-plane structures compared to that from AB tomosynthesis.
In order to investigate this further, reconstructed in-plane images (x-y plane) from two
different z-positions were extracted for comparison between AB and PB-XPC results. As
shown in figure 2.5, one slice was selected from a depth position corresponding to the middle
of the phantom (i.e. the isocenter, z=256solid line) and the other slice was chosen from an
off-center plane (z=354,dashed line).
In figure 2.6, the top row shows the reconstructed in-plane images (corresponding to the
beam direction θ=0) at the central depth position (z=256); the associated line profiles for
y=256 are shown in the bottom row. For the AB tomosynthesis result (left column), all eight
of the spheres appear in this reconstructed slice and it is not possible to determine which
spheres are actually located at thisz-position. Some criteria, like the magnitude or the visual
size of the reconstructed object, might be misleading when used to determine the presence of
AB tomosynthesis PB-XPC tomosynthesis Phantom X position (pixel) Y position (pixel) 100 200 300 400 500 100 200 300 400 500 30 40 50 60 70 X position (pixel) Y position (pixel) 100 200 300 400 500 100 200 300 400 500 30 40 50 60 70 X position (pixel) Y position (pixel) 100 200 300 400 500 100 200 300 400 500 30 40 50 60 70 0 100 200 300 400 500 −20 0 20 40 60 80 100 X position (pixel) (a) 0 100 200 300 400 500 −50 0 50 100 X position (pixel) (b) 0 100 200 300 400 500 −20 0 20 40 60 80 100 X position (pixel) (c)
Figure 2.6: The comparisons of reconstructed in-plane images at depth position z=256
(top row) and associated profiles (bottom row) are shown here. (a) The line profiles from
AB tomosynthesis result show similar signals from all internal spheres. (b) The PB-XPC tomosynthesis result reveals edge-enhancement for some of the internal spheres. (c) The true in-plane phantom structure shows that only the edge-enhanced spheres in (b) are actually
AB tomosynthesis PB-XPC tomosynthesis Phantom X position (pixel) Y position (pixel) 100 200 300 400 500 100 200 300 400 500 30 40 50 60 70 X position (pixel) Y position (pixel) 100 200 300 400 500 100 200 300 400 500 30 40 50 60 70 X position (pixel) Y position (pixel) 100 200 300 400 500 100 200 300 400 500 30 40 50 60 70 0 100 200 300 400 500 −20 0 20 40 60 80 100 X position (pixel) (a) 0 100 200 300 400 500 −50 0 50 100 X position (pixel) (b) 0 100 200 300 400 500 −20 0 20 40 60 80 100 X position (pixel) (c)
Figure 2.7: A comparison of reconstructed in-plane images at an off-center depth position
z=354 (top row) and associated profiles (bottom row) is presented. The interpretation is
reconstructed image, however, only four of them exhibit fringes (enclosed in ellipse) while the others do not. Based on the previous observation, it is reasonable to suspect that these
four spheres are truly located at this z-position, and the other image features are stretched
artifacts from spheres located outside this particular plane. The corresponding slice of the
numerical phantom (right column) verifies this interpretation and demonstrates that only
the structures with fringes in the XPC reconstructed image are located in this plane. The
reader should note the different y-axis range of panel (b) compared to panels (a) and (c),
which was expanded to display the full extent of edge-enhanced features.
In figure 2.7, a similar comparison is displayed for the reconstructed in-plane image located
at an off-center x-y plane (z=384). There are four spheres appearing in the resulting slice,
but again, the AB tomosynthesis reconstruction (left column) does not provide enough
in-formation to distinguish the structures truly located at this plane. Through the presence of edge-enhanced features, the PB-XPC tomosynthesis image allows for estimation of which
spheres are veritably present (enclosed in ellipse). This can be verified by examining the
cor-responding plane of the numerical phantom (right column). These results again demonstrate
that boundary-enhancement in PB-XPC tomosynthesis provides capabilities to discriminate between in-plane structures and out-of-plane contamination. In addition, this capability proves to persist for depth positions away from the center of rotation.
2.4.2
Experimental Studies
An additional investigation of depth position characterization in PB-XPC tomosynthesis was conducted through imaging experiments. An extracted mouse lung was imaged with both AB and PC-XPC tomosynthesis configurations as well as with conventional CT. Figure 2.8 shows
a typical projection acquired from the two tomosynthesis setups. The PB-XPC projection
(right panel) contains regions that exhibit significant intensity variation with a speckled
appearance [84, 150] while the AB projection (left panel) does not. Two diverging airways
and numerous smaller structures can be identified from the reconstructed in-plane images
displayed in figure 2.9. Results for AB tomosynthesis (left column), PB-XPC tomosynthesis
(middle column) and conventional x-ray CT (right column) are presented along with profiles
for selected lines across each of the large airways (arrow indicators). The top and bottom
rows in figure 2.9 correspond to reconstructed slices at two different z-positions of 4.2mm
and 4.3mm (Depth 1 and Depth 2). The physical dimensions of ROIs are 3.5×3.5mm2, and
the width of the large airway is 250 µm.
Through examination of the AB tomosynthesis result at Depth 1 in figure 2.9(a), it is dif-ficult to conclude if either airway is actually located at this depth position. However, XPC imaging methods proved itself able to fulfill this objective, because the left airway branch in the PB-XPC tomosynthesis result shown in figure 2.9(b) exhibits strong edge-enhancement
along the tissue-air boundary (enclosed in ellipse) while the right airway does not. This
edge-enhancement is readily observed in the extracted profiles. The full-view CT result in figure 2.9(c) serves as the reference and confirms that only the left branch is located in the corresponding plane.
The bottom row of figure 2.9 corresponds to a second plane located a distance of 100 µm in
the positivez-direction from the slice at Depth 1. At Depth 2, the AB tomosynthesis image
in figure 2.9(d) shows little difference between the appearances of the two airways; while the PB-XPC tomosynthesis image in figure 2.9(e) displays strong edge-enhancement at the boundaries of the airway on the right. In this in-plane, the XPC result successfully identifies
the right airway as the real structures but not the left one, which proves to be consistent with the corresponding slice of CT result in figure 2.9(f).
200 400 600 800 100 200 300 400 500 600
(a) AB tomosynthesis scan
200 400 600 800 100 200 300 400 500 600 (b) PB-XPC tomosynthesis scan
Figure 2.8: One typical projection image of an ex-vivo mouse lung sample acquired with
different propagation distances. (a) R1=R2=13cm for the AB tomosynthesis scan; (b)
R1=R2=74cm for the PB-XPC tomosynthesis scan. Due to the high phase-contrast
sensitiv-ity during acquisition, the PB-XPC projection presents more features of weakly absorbing microstructure than the AB projection.
2.5
CONCLUSION AND DISCUSSION
Conventional AB tomosynthesis has previously been applied in both research studies and diagnostic breast/chest imaging applications. Although tomosynthesis methods are able to add a third dimension of information to that provided by conventional 2D radiographs, dis-cerning real structures from those contaminated from other depth positions remains one of the challenges in interpreting the images. PB-XPC tomosynthesis combines desirable aspects of XPC imaging and tomosynthesis. It can provide volumetric information describ-ing weakly absorbdescrib-ing structures and reduce imagdescrib-ing times and doses as compared to XPC CT. The results presented here demonstrate that PB-XPC tomosynthesis can also provide
AB tomosynthesis PB-XPC tomosynthesis CT result (a) (b) −50 0 50 100 150 200 250 300 (c) (d) (e) −50 0 50 100 150 200 250 300 (f)
Figure 2.9: A comparison of reconstructed in-plane images for an ex-vivo mouse lung is
shown. The grayscale window represents attenuation coefficient (m−1). The top and bottom
rows correspond to in-plane slices located at z=4.2mm and z=4.3mm, respectively, of the
reconstructed 3D volume from AB tomosynthesis (a,d), PB-XPC tomosynthesis (b,e), and full-view CT (c,f) data sets. Two airways are seen in the tomosynthesis results and their line profiles are delineated as the arrows indicate. For each row, edge-enhancement in the PB-XPC reconstructions is able to provide a method to identify structures that are truly
improved depth position characterization compared with conventional AB tomosynthesis. More specifically, the simulation results and experiment studies show that structures truly located in a specific plane may display strong boundary-enhancement in PB-XPC tomosyn-thesis reconstructions while out-of-plane structures do not. This effect can facilitate the identification of in-plane structures.
As demonstrated in our studies, the presence of boundary-enhancement in PB-XPC to-mosynthesis is shown to be a signature of the true presence of in-plane structures; however, one should note that the lack of such evidence is not necessarily an absolute indicator of an out-of-plane artifact. Our results show the prominent fringes employed for depth
po-sition characterization come from the tissue boundaries associated with high kx or high
ky frequencies, therefore edge-enhancement do not cover the entire perimeter of the object
(e.g. those boundaries mainly alongx-direction); there could be in-plane structures without
edge-enhancement that also correspond to truly existing objects. The spatial distribution of fringes depends on the scan angular range of tomosynthesis acquisition. In addition, al-though boundary-enhancement is useful for depth position determination, the detection of fringes is essentially a binary decision task that is not always straightforward to accomplish, especially for those cases where the edge-enhancement is not significant and/or the images contain a high noise level. A few studies related to edge detection have been reported in the previous research [87, 182]. Finally, alternative tomosynthesis scanning configurations exist with different relative motion between source, object and detector. It is uncertain if the results presented here for complete isocentric motion can be translated directly to other scanning setups. A natural next step in the course of this work is to further investigate these issues as well as other factors affecting PB-XPC sensitivity such as lateral coherence and propagation distance.
Chapter 3
A subspace-based resolution
enhancing image reconstruction
method for few-view differential
phase-contrast tomography
It is well-known that properly designed image reconstruction methods can facilitate reduc-tions in imaging doses and data-acquisition times in tomographic imaging. The ability to do so is particularly important for emerging modalities such as differential X-ray phase-contrast tomography (D-XPCT)[127], which are currently limited by these factors. An im-portant application of D-XPCT is high-resolution imaging of biomedical samples. However, reconstructing high-resolution images from few-view tomographic measurements remains a challenging task due to the high-frequency information loss caused by data incompleteness. In this work, a subspace-based (SuB) reconstruction strategy is proposed and investigated for use in few-view D-XPCT image reconstruction. By adopting a two-step approach, the proposed method can simultaneously recover high-frequency details within a certain region
of interest (ROI) while suppressing noise and/or artifacts globally.The proposed method is investigated by use of few-view experimental data acquired by edge-illumination D-XPCT scanner.
3.1
Introduction
X-ray phase-contrast imaging (XPCI) methods continue to be actively developed and investi-gated for characterizing soft tissue or biological samples that present limited X-ray absorption contrast[38, 128, 92, 103, 9, 60, 20]. A variety of XPCI methods have been proposed, which include propagation-based imaging[170, 62], crystal analyzer-based imaging[30, 165], grating-based imaging grating-based on the Talbot or Talbot-Lau effect[163, 128] and edge-illumination imaging[65, 64, 32]. Conventional implementations of the crystal analyzer-, grating-, and edge-illumination-based methods are generally referred to as differential XPCI methods, since they typically yield estimates of the one-dimensional (1D) derivative of the projected real-valued component of the refractive index distribution of an object. In this work, a tomo-graphic implementation of differential XPCI is considered, referred to as differential X-ray phase-contrast tomography (D-XPCT). The goal of D-XPCT is to produce an estimate of the real-valued component of the refractive index distribution, which describes the spatially variant refractive properties of an object.
It will be assumed that the tomographic data function, from which an estimate of the re-fractive index distribution is reconstructed, corresponds to 1D derivative with respect to the detector row coordinate of the two-dimensional (2D) Radon transform of the refractive index distribution. This tomographic data function can be established by application of a phase-retrieval method [128, 165, 34, 117, 42] to the measured intensity data. When the data
function is know at a sufficiently large number of tomographic views [145], image reconstruc-tion in D-XPCT can be readily accomplished by use of a modified filtered backprojecreconstruc-tion (FBP) algorithm[47, 69, 127].
However, in current implementations of D-XPCT, it may not be desirable to acquire data at a large number of tomographic view angles. This is because D-XPCT methods are cur-rently limited by relatively long data-acquisition times and radiation exposures, which has
hindered the widespread application of the method to in vivo applications. Since current
implementations typically utilize a ’step-and-shoot’ data-acquisition protocol, as opposed to the continuously rotating X-ray source and detector pair utilized in a clinical CT scanner, one way to mitigate this problem is to acquire tomographic measurements at a reduced number of view angles. The associated image reconstruction problem is generally referred to as a ’few-view’ image reconstruction problem [140, 15]. It might be worth mentioning that recently a phase CT has been developed with a lab source using continuous rotation in a few minutes, but the limitation in that case is the approximation in the phase retrieval.
There exists a vast literature related to few-view image reconstruction [140, 192, 187, 141, 184]. Modern few-view image reconstruction methods are optimization-based and typically utilize an iterative method to find a finite-dimensional estimate of the object function that approximately minimizes an objective function subject to constraints. In the case of D-XPCT, the object function corresponds to the refractive index distribution. While existing few-view reconstruction methods can be adapted for use in D-XPCT [175, 85, 116, 115], there remains a need for improved methods for reconstructing high-resolution D-XPCT images from few-view measurements. Because few-view image reconstruction corresponds to an ill-conditioned inverse problem, a regularized solution must be computed; however the design of