CESPRI
Centro di Ricerca sui Processi di Innovazione e Internazionalizzazione
Università Commerciale “Luigi Bocconi”
Via R. Sarfatti, 25 – 20136 Milano
Tel. 02 58363395/7 – fax 02 58363399
http://www.cespri.it
Mario Calderini*, Giuseppe Scellato**
I
NTELLECTUAL
P
ROPERTY
R
IGHTS AS
S
TRATEGIC
A
SSETS
:
THE
C
ASE OF
E
UROPEAN
P
ATENT
O
PPOSITION
IN THE
T
ELECOMMUNICATION
I
NDUSTRY
WP n. 158
July 2004
Stampato in proprio da:
Università Commerciale Luigi Bocconi – CESPRI Via Sarfatti, 25 20136 Milano Anno: 2004
_________________
* Politecnico di Torino, e-mail: mario.calderini@polito.it tel. +39 011 5647235
** Politecnico di Torino and Università degli Studi di Torino, e-mail:giuseppe.scellato@polito.it tel. +39 011 5647205
I
NTELLECTUAL
P
ROPERTY
R
IGHTS AS
S
TRATEGIC
A
SSETS
:
THE
C
ASE OF
E
UROPEAN
P
ATENT
O
PPOSITION
IN THE
T
ELECOMMUNICATION
I
NDUSTRY
Mario Calderini, Giuseppe Scellato
Abstract
The paper empirically investigates the phenomenon of patent litigation through the analysis of the all population of European patents’ opposition cases in the telecommunication industry. We recover the complete legal history of each dispute and the patent portfolios of the firms involved. We suggest that in an industry characterised by strong technological complementarities the distribution of patent rights may induce situations of mutual hold-up among innovators. The risk of retaliation through counter-suits represents a credible threat that can eventually favour the instauration of collusive behaviours. Our results confirm this hypothesis, since the occurrence of patent oppositions among large incumbents is significantly lower than industry average.
JEL CLASSIFICATION: K41,O34
1. Introduction
Recent years have been characterised by a renewed attention to the intellectual property rights systems from both scholars and policy makers. In the two past decades very significant changes in U.S. patent law and policy have occurred, strengthening the rights of inventors and broadening the areas in which patents can be received. Moreover, the U.S. government has instituted a new unified Court of Appeals for the Federal Circuit to hear appeals on patent cases from all district courts. Such policy innovations concerning
Acknowledgements. Preliminary versions of this paper were presented at the CESPRI seminar series in January 2004, at the Institute of Innovation seminar series at University of Manchester and at the International Schumpeter Society 2004. We gratefully acknowledge the usefull suggestions from all participants. This research has been financially supported by Fondazione Giovanni Agnelli. We wish to thank Director Marco Demarie for such support. Finally , we wish to acknowledge constant support by European Patent Office in data gathering.
intellectual property rights ha ve been partially adopted also in Europe. In particular, the issues involved in the design of the future community patent are a clear signal of the economic relevance of an efficient property rights system1.
Despite this policy activity, the recent scientific debate on intellectual property rights has been quite controversial. The economic analysis of the patent system has been traditionally based on the stream of literature on cost and benefits of temporary monopoly power (Nordhaus, 1972) in which the policy maker problem was to effectively adjust the terms of patent protection, namely length and breadth, in order to optimally balance static welfare losses and dynamic welfare gains. According to this stream of literature the theoretical analysis was essentially carried out through patent race models in which the firms involved are maximising the expected revenues from future monopolistic power2.
However, the latter approach has been somehow questioned by a series of recent paper which have highlighted the emergence - both in the U.S. and European economies - of a actual patent paradox. Hall and Ziedonis (2001) and Cohen et al. (2000) present very large surveys of private R&D divisions, which strongly support the hypothesis that modern companies judge patents a poor tool to protect innovation. In fact, when asked to rank different methodologies suitable for protecting innovative products and processes, R&D managers usually indicate patents after other channels like industrial secrecy, lead time or the use of complementary assets3.
1
The main innovations relate to the treatment of legal suits. Presently for European patents it is possible to file a centralised opposition only with nine months after the granting date. After this deadline the legal proceedings for patent infringement move to the civil courts of each country in which protection has been asked. The community patent will introduce a unified and centralised court of appeal.
2
It is important to remark that this classic economic issue has not been abandoned , and it has produced a still active scientific debate. For some excellent works see Denicolò (1996), Wright (1999).
3
The phenomenon has been analysed also for the European context: Shankerman (1999) estimates by means of patent renewal data that the value protection provided by EU patents on average does not exceed 20% of the R&D expenditure sustained by the company for the development of the innovative product.
The paradox emerges when this latter evidence is set against the background of constant increases in the filings of new patents. New yearly patent application in the United States by domestic inventors have increased from around 60,000 in the mid 1980s to more 150,000 in the late 1990s. Some authors have tried to explain this increase in patent filing as an effect of the reforms of the U.S. patent system that strengthened the power of patent holder, but they obtained poor results (Kortum and Lerner, 1998).
A second hypothesis, that has attracted the attention of numerous scholars, asserts that patent portfolio are built and managed as real bargaining chips among both horizontal competitors and upstream and downstream companies. The extensive interviews presented in Cohen et al. (2000)4 suggest that firms patent for reason that go beyond product commercialisation or technology licensing. The most prominent motives include the prevention of rivals from imitating through patenting around, the specific use of patents in negotiations and the prevention of suits.
The use of the patent system with objectives that are diverging from the ones it was originally designed for, can potentially result in net social welfare loss and in lower innovation rates. In this perspective, the original approach to the patent system has to be complemented with the investigation of the dynamic effect produced by this kind of strategic firm- level interactions.
Purely strategic patenting can be detrimental to social welfare to the extent that companies build large patent portfo lios exclusively for the purpose of blocking entrants also on marginal technologies that eventually are not developed and marketed.
This situation was originally addressed by Gilbert and Newberry (1982) in their work on preemptive patenting and persistence of monopoly. The authors cite the famous case of SCM Corp. that sought more than $500 million to Xerox Corp. for having maintained a patent thicket in which some inventions were used while others were neither used or licesed to others. With preemptive activity a firm may sustain its monopoly power by spending resources on the development of new technologies, creating sleeping patents and then deny society the use of these technologies. According to this view of intellectual property rights, patent portfolios become valuable assets for the companies to the extent that they can use them to favour collusive anticompetitive agreements. The collusive equilibrium can be sustained by a mechanisms similar to the one s highlighted by the literature on multi- market contact among firms. Stretching the analogy from a multi- market contest to a multi-technology contest, it can be argued that there is a credible threat of retaliation from attacking a company endowed with a large and differentiated patent portfolio. This issue will be further explored and clarified in section three.
The previous hypotheses raise relevant questions about the use of patent portfolios as tools to allow the emergence of collusive behaviours among large incumbent firms under the threat of reciprocal infringement suits. Some famous litigation cases in the U.S. have clearly highlighted the enormous costs of the legal proceedings for patent litigation, stressing the plausibility of an effective strategic threat.
Previous empirical studies have investigated the phenomenon of patent litigation focussing on the determinants of suit filings (Lanjouw and Shankerman, 2001; Harhoff and Reitzig, 2004), the presence of predatory litigations through preliminary injunctions (Lanjouw and Lerner, 1997) or the factors influencing patent suit duration (Somaya,
4 The paper is based on the Carnegie Mellon Survey that involved 1478 R&D labs belonging to U.S. manufacturing companies.
2003). A growing theoretical literature is also addressing the new firm- level strategic interactions based on specific tools such as patent cross- licensing (Anton and Yao, 2002), patent thicket (Bessen, 2003), patent pools (Lerner and Tirole, 2000) and patent-based standard agreements (Shapiro, 2003).
From the latter researches it clearly emerge how the strategic management of property rights is a strongly sector- specific phenomenon. In particular, industries characterised by complex product - where a single marketed technology requires numerous strictly complementary patents - are expected to be far more heavily affected by strategic patenting. Firms active in complex product industries are exposed to elevated risk of mutual hold-up stemming from the reciprocal ownership of relevant and complementary property rights.
Even thought the theoretical literature on the strategic use of IPR is receiving important contributions, there is still a lack of comprehe nsive evidence of a real implementation by firms of such strategies. This is clearly due to the fact that strategic patenting is an hidden action. The purpose of this work is to try to shed light on the phenomenon through the observation of a publicly observable event - namely the decision to file an opposition to a rival company patent - that can potentially reveal some information about the underlying firm strategies.
Our specific contribution is based on the examination of the full population of oppositions to patents filed at the European Patent Office occurred during the years 1980-2002, in the telecommunication industry.
This industry involves complex technologies and has been subject to high rates of technological change during the two past decades. Two additional motive for selecting this industry relate to growing market concentration observed for technology producers and to the relevance of patent-based technological standards in recent years. In particular the emergence of the GSM communication protocol has gone through a troublesome history where a key role has been played by patent cross- licensing agreements (Bekkers et al. 2002).
Previous researches on opposition to European patents have involved the biotech and pharmaceutical sector (Harhoff and Reitzig 2004) and were substantially focused on the specific characteristics of each patent subject to opposition. In that case, the main objective of the analysis was the investigation of possible correlations between measures of patent quality and the opposition event. Our innovation with respect to these empirical analysis is based on the use of information about the characteristics of the companies involved in the litigation. Furthermore, we have been able to track the complete history of each legal case in order to observe the presence of patterns correlating firms’ characteristics and the length and final outcomes of the trials.
The statistical evidence about the trend in patent opposition in the telecommunication industry confirms the fundamental hypothesis about the existence of economic rationales behind the decision to suit litigations. In fact, the time profile of the number of oppositions follows a path independent from the constant parabolic increase observed for patent filings and grants.
In particular, in the telecommunication industry there has been, during the last 5 years, a relative reduction in the incidence of opposed patents. This might be alternatively due to the presence of large standard agreements among equipment producers or to a collusive behaviour in a context of a more concentrated market.
Our evidence seems to support the second strategic hypothesis. In fact, the occurrence of oppositions involving two la rge companies is substantially lower than the case in
which there is a large company attacking a relatively smaller one. When considering the major patentees in the TLC patent classes the matrix of reciprocal opposition cases is nearly empty. Moreover, threat effect connected to the filing of an opposition in a field dominated by technological complementarities is well represented by the relatively high percentage of patents assigned to smaller or individual patentee that after surviving an opposition attempt are no longer renewed by their owner.
The paper is organised according to the following structure. In the next section we will briefly summarise the key legal and organisational features of the European patent system, stressing the main differences with the U.S. contest in order to allow a clearer interpretation of the following empirical evidence and methodology. Section three will be dedicated to the analysis of both the empirical and theoretical literature concerning the determinants and effect of patent litigation and patent opposition. In section four we will clarify our original interpretative model and highlight the research hypotheses. Section five contains a detailed description of the methodology implemented to analyse the patent oppositions and the statistical evidence. Finally, in section six we summarise and discuss our results, suggesting future research developments.
2. The European patent system and patent opposition.
The purpose of a patent system is to balance the interest of society in ensuring that the inventor publicly shares his knowledge in order to promote innovation, with the interest of the inventor in receiving protection for his ideas. The protective, informative and pro-competitive functions are reflected in the system structure, which offers a territorial protection and requires a full disclosure of the patented innovation.
The effectiveness of such objectives is clearly influenced by the overlapping of the geographical market of the firm and the geographical extension of patent protection. In the Paris Convention of 1883 was signed a first agreement among European Countries for mutual recognition of foreign patents. In 1973 the European Patent Convention designed a centralised process of patent filing within the borders of the European Economic Community according to which the centrally examined paper will be fully valid in all the member countries.
Even if there has been a number of subsequent treaties to harmonise the patent law among different countries (Patent Cooperation Treaty; Trips Agreements, 1994) the legal proceedings have yet to be taken at a country level5. Moreover, it is important to stress that such harmonisation procedure has not directly involved the methods for estimating the recovery of damages from patent infringements. As Reitzig et al. (2003) clearly state, different national jurisdictions provide for number of different methods for calculating damages6. Since august 2000 the European Commission is supporting the introduction of a community patent whose main innovation will be the institution of an autonomous post grant regime governed by community law. The centralised litigation
5 In case of cross-country suits the risk of “forum shopping” by the claimant is limited by the Brussels Convention of 1968 which grants international jurisdiction to the court of domicile of the defendant. 6 The methodologies can be summarised into three categories: patentee’s own damages, the infrigers’ profit, and the rule of a reasonable royalty. The application of different indemnification rules can substantially shift the firm level incentives to file a suit. In particular the lacking of an infringers’ profit rule can strongly favour larger companies towards smaller ones.
procedure will be carried out by a community intellectual property court with first instance and appeal chamber.
The dataset involved in this study is based on cases of patent opposition, that is a quite different procedure than patent litigation.
The opposition procedure gives the right to any third party to attack a granted patent during a nine months time window after the grant date. It is a centralised suit that –if successful- causes the revocation or amendment of the new patent in all the countries for which protection has been asked. If the parties are not satisfied after the first sentence, there is a centralised court of appeal and eventually the trial will move to national courts.
The opponent has to substantiate his opposition by presenting evidence that the patent is lacking patentability prerequisites such as novelty, inventive step and sufficient disclosure. The opposition commission at EPO is formed by three members including the original examiner who granted the patent. The main concept underlying the institution of the opposition system is the effective integration of competitors in the quality and nove lty control of granted patent s. In the U.S. system there is the possibility of a re-examination procedure of a patent, but in this case the third-party challenger is denied a meaningful role in the process while the patentholder maintains direct communications with the examiner. As a result, challengers face powerful incentives to forego re-examination procedure in favour of pure litigation trials, even if the latter are
more expensive and time –consuming7. Hall, Harhoff, Graham and Mowery (2003)
present an insightful comparative analysis of the institutional settings in Europe and U.S. for patent litigation.
Presently the relative efficiency of the European opposition systems is argued by different scholars. Graham et al. (2003) suggest that the adoption of the opposition model based on inter parties re-examination may substantially increase the quality of patent in the U.S.. Similar welfare improving effect are derived trough a theoretical model by Levin and Levin (2002).
Several legal characteristics of the opposition procedure turn out to be useful to detect possible strategic behaviours underlying the decision to file the suit.
First, we stress that the opposition is directed against a patent holder that has just been granted a new patent8. Rather often the new patentee is an entrant in the technology
domain where the opponent owns previously granted patents9. Moreover, the new
attacked patentee has already incurred the sunk costs associated to the R&D expenditures necessary for the development of the patent, but he has not yet used the patent.
Second, after the filing of the opposition, there is no longer a chance of negotiation among the parties. In fact, once an opposition is filed, the EPO commission can carry on the re examination even if the opposition is withdrawn. In this perspective, the filing of an opposition is a more irreversible decision when compared to a traditional legal suit
7
This incentive structure is reflected in the limited incidence of re-examination cases in the U.S. compared to the European opposition. Only 0.2% of USPTO granted patents are subject to re-examination against an average value of 8% of EPO patents subject to opposition.
8
This constitutes a major difference with respect to the standard situation of patent litigation among two firms that are already inside a certain technology market.
9
In principles any third party may file a patent opposition for reasons different from the pure
infringement on a previous property right. However, the cases in which the opponent company files a suit for reasons related to limited disclosure or obviousness of the attacked patent are very rare.
for patent infringements10. The latter features represent a major difference between the opposition system and the litigation process in the U.S.. The data presented in Somaya (2003) for the U.S. contest, highlight that most of patent suits are dismissed or settled right after the preliminary motions and only a very small fraction actually undergoes the trial.
The previous characteristics suggest that there is room for a strategic use of the patent opposition procedure in order to discourage new entrants and favour collusive behaviours among larger incumbents. A first simple intuitive effect is due to the increase in uncertainty following the filing of patent opposition. During the opposition period, the patent is valid and the patentee will necessitate capacity investments both to implement the technological innovation and to sustain the related R&D program. Such investment will have to be planned in a period during which the patentee bears the risk of seeing his patent eventually revoked. The net effect for smaller patent holders is an investment disincentive proportional to the perceived litigation costs in terms of time lag.
Since our dataset is based on opposition cases, one may argue that it is somehow biased and covering only partially the phenomenon of patent litigation. However, there are a number of reasons according to which companies should prefer a centralised procedure like the opposition rather than litigation. First, a litigation procedure repeated across more than fifteen European national civil courts can generate very high administrative costs11.
Second, in the case of litigation at national courts, the infringed company that is filing the suit will be subject to an higher degree of uncertainty about the final outcome of the trials. For example, in Italy the patent litigation is part of the ordinary civil proceedings and is usually handled by a single judge who is only legally trained and, unlike members of the EPO Board of Appeal, has no specific technical background. So, in the Italian contest the judge is normally obliged to appoint an expert to acquire the required technical knowledge. In this situation it is fundamental to stress that the expert’s opinion is not a proper means of evidence, but rather a means to evaluate and interpret the evidence that has already been taken in the proceeding. The expert cannot have exploration duties leading him to exceed the limit of the burden of the evidence which are exclusive right of the parties (EPOSCRIPT, 2001). Direct consequence of such procedure is a reduced investigation effort and higher uncertainty for the parties. In the case of Germany, a special Federal Patent Court has been created for the cases involving industrial property rights. However this court - composed by technically qualified judges which are usually selected among EPO patent examiners - has power only in the cases of nullity actions but not in the cases of infringements.
3. The economics of patent litigation.
Our research builds on the contributions of two close stream of literature. On one side, we develop and try to empirically identify the strategic behaviours predicted by the literature on management of IPR (Bessen, 2003. On the other side, we take into account
10
This provision of the opposition process may discourage its use by opponents seeking to force rivals to license their patents (Harhoff and Hall, 2002).
11 The cost of litigation for each national court is estimated to range between 100.000 and 500.000 Euro (Eposcript, 2001).
the results obtained by studies that have specifically focused on patent litigation (Lanjouw and Schankerman, 1997, 2001; Lerner, 1995; Somaya, 2003.
The prospective management of patent portfolios as bargaining chips has been first tackled by Grindley and Teece (1997) and Hall and Ziedonis (2001) in the semiconductor industry, while La njouw and Schankerman (1997, 2001) through a series of papers develop the idea that the probability for a specific patent to be subject to litigation can be analysed by means of the concepts commonly applied in the standard theory on legal suits. According to this latter stream of literature the probability of occurrence of a lega l dispute is linked to three dimensions: the size of the stake involved, the degree of uncertainty and the cost of the suit (Meurer, 1989).
The extension of these concepts into the area of intellectual property suggests the following statements.
First, the probability of opposition is expected to be positively correlated to the economic value of the patent. A large stream of literature has investigated methods to provide consistent measures of patent quality by referring essentially to the number of subsequent citation received (Haroff et al. 1999). Second, the probability that a patent will be subject to litigation is proportional to the degree of informational uncertainty concerning the technology covered by the patent. Higher uncertainty about the future revenues coming from commercial applications of the knowledge embedded in the patent is likely to induce substantial asymmetries in the private evaluation of a patent. In this perspective, in an high- uncertain context the owner of the patent is expected to be less favourable to licensing, given the limited ability to understand the buyer’s real estimate of the patent. According to this point patents in frontier technologies should be more subject to litigation.
The third determinant derived from the law literature refers to the legal costs of patent litigation. In principles, a company should provide financial resourses for litigation up to the point where such costs equal future expected revenues from patent ownership. Such revenues have to be calcula ted taking into account not only the standard uncertainty but also the risk of loosing the legal procedure.
Lanjouw and Schankerman (2001) carry out an empirical investigation to test the implications of patent litigation on R&D incentives and patent policy in the U.S. The study is based on 10000 patent suits and settlements during 1978-99. For each litigation case the authors draw a matching random set from the universe of patents, controlling for technology and year of application. The statistical analysis reveals that, when controlling for the rapid increase in patent filing during recent years, the incidence of patent suits has not been rising12.
By appling a probit model the authors are able to show that litigation is concentrated within firms and patents with specific characteristics. In particular, the probability that a patent is subject to a suit is much higher if it is owned by an individual or a small firm. This result is explained by the fact that patentees with a large portfolio of patents to trade, can manage to produce cooperative resolution among them. Whether this observation can be interpreted as a form of collusion among large innovators with a net negative effect on innovation is still an open issue. However, the reduced bargaining power of smaller patentees appear to be a net weakness point in enforcing their patent rights, that in turn can heavily affect the entry rate in high tech industries.
12 It is interesting to anticipate that this result is fully confirmed by our data on European patents in the telecommunication technologies.
The strategic use of patents by large companies as been analysed by Lanjouw and Lerner (2001) through the observation of a specific legal procedure: the preliminary injunctions. The owner of a patent can ask for a preliminary injunction preventing an accused infringer from using the patented innovation during the time that a case is being decided. Preliminary injunction can be strategically used by financially secure plaintiffs to go beyond the avoidance of "irreparable harm" and to extract even greater profit by raising the cost of legal disputes. The data proposed by the authors13 confirm this latter intuition, showing how larger corporate plaintiffs with high levels of cash flow and equivalents are significantly more likely to request preliminary injunctions. Crampes and Langinier (2002) stress how the detection of patent infringement cases can be a difficult and resource consuming process. This is due to the complexity of technologies involving thousands of different patents for a single product14. Again, the overall effect might be a strong disincentive for smaller entrant companies.
Somaya (2003) further investigate the possible strategic implications underlying the decision to file a legal suit and in particular to go to court instead of settling an agreement. The author examines two forms of asymmetric stakes: strategic stakes and mutual hold-up. In the case of strategic stakes, a firm with a patent monopoly can leverage specific strategic assets. The greater the value of a patent, the more difficult it becomes to craft a settlement suitable to both parties. Mutual hold-up occurs when firms depend upon one another for reciprocal access to patents in order to manufacture their products. This is common for companies that specialize in computer operating systems, where individual products consist of several different patented inventio ns, often owned by different firms. When faced with a patent lawsuit, an operating system manufacturer may protect itself by threatening its rival with a countersuit over another patent. To test these hypotheses, the author looks at patent and litigation data collected by the Federal Judicial Center and the US Patent and Trademark Office for suits filed between 1983-1993 in the computer and research medicines industries. Results from a statistical analysis of the data support the strategic stakes hypothesis. A high strategic stake increases the probability that a dispute will be decided in court. However, contrary to prior research, this occurred primarily in the computer industry and not in the pharmaceutical sector.
All the previously mentioned empirical analyses were based on U.S. patents. On the European side, Harhoff and Reitzig (2004) have produced a detailed analysis of patent opposition in the area of biotechnology and pharmaceuticals. They apply citation and classification analysis on a large sample of over 13000 European patents granted between 1979 and 1996, of which 8.6 percent resulted having been subject to opposition. For each patent they have been able to compute the number of backward citations15, the number of citations received, the number of IPC classes in which it has been registered, the name of the assignee and its total patent portfolio.
By applying different multivariate probit specifications they obtain some relevant results concerning the characteristics of the patents. First, high quality patent measured by citation analysis are more likely to be opposed. Second, the likelihood of opposition
13
The database consists of 250 patent suits and corresponding firm financial status. 14
Grindley and Teece (1997) report how Texas Instruments’ legal and engineering staff often spent a year to determine the extent of a suspected infringement.
15
In this specific research, the authors add new features to the traditional approach that was commonly based on a simple citation count. In fact, the citation are pre-classified into different categories according to the guidelines for examination issued by the World Intellectual Property Organization. In this way each citation can be weighted according to its relevance for the specific patent.
is positively correlated to the number of designated states, a proxy for the economic relevance of the patent.
The contributions deriving from the different empirical approaches can be jointly summarised according to the following points. First, there is evidence – at least for the U.S. – that the litigation procedure is influenced also by strategic determinants and not only by technologic al rationales. Second, smaller companies can suffer from the threat of litigation as a consequence of high monitoring and legal costs. Third, asymmetries both in the economic evaluation of a patent and in the width of private patent portfolios can play a major role in the decision to file a suit. Finally, the technological sectors where the possibility of mutual hold- up are higher – due to elevated sub-product complementarities – are exposed to risk of collusive and anticompetitive agreements between large incumbent companies.
4. Research hypotheses.
The strategic use of patent portfolios is a phenomenon whose empirical observation is quite subtle. However, here we claim that is possible to use a publicly observable event – the filing of oppositions – to infer about the underlying firm- level hidden strategies. Since each patent in principle provides an imperfect protection due to possible grant of close substitut e patent, a patent holder has a direct incentive in monitoring the patenting system and in claiming the revocation of new patents that are supposed to infringe his own property rights. However, in complex industries final goods are produced using numerous complementary inventions. This situation poses an additional relevant challenge to firms that have to choose their patent strategy while being often embedded in an thicket of cross- licensing agreements.
In such a contest, the development of large patent portfolios gives the firm a relative bargaining power by means of counter-suits reaction and hold-up on complementary patents. In this perspective, the most recent modelling approaches in the literature on patent opposition (Levin and Levin, 2002) can be interestingly coupled with the multi-market contact stream of literature (Bernheim and Whinston, 1990). The core concept of this theoretical literature is that multi- market contacts could influence oligopolistic cooperation by providing firms with a mechanism to check whether colluding is an optimal strategy under the threat of reciprocal strategic retaliations. The notion of multi-market contacts can be stretched to the concept of multi-technology contact. In this latter case the companies are not coupled through overlapping geographical markets, but through overlapping technologies. Two firms active in different technological fields, covered by imperfect patents, might sustain a reciprocal non aggressive strategy eventually leading to a persistent oligopolistic market structures. On the contrary, an entrant does not have enough contracting power to dissuade incumbents from opposing his patent.
Firms A and B have a certain number of patents covering technology domains 1 and 2. The decision for a firm A, that owns a previous patent on a specific technology, to file an opposition against a patent newly granted to firm B for technology 1 can be interpreted as being subject to the following condition.
(1) p Π1Μ + (1- p) Π1D – p [ PRET (Π2M – Π2D)] – C > Π1D (2) PRET = F (relative portfolio size)
where p represent the probability of success in the opposition procedure that will give to firm A the right to keep its monopolistic rent over technology 1 16. Π1D is the expected profit that firm A will get when allowing firm B to enter the technology market without filing an opposition. PRET represent s the probability of retaliation from the firm B the other technology by means of a counter suit. This probability is hypothesised to be a function of the patent portfolios stocks of the two firms. Different situations can occur with respect to the reciprocal patent portfolio endowments of the two companies.
If the patent stock of firm A is close to zero, there is not a second technological market in which the firm can suffer from a retaliation and the third term is ruled out in equation (1). In this case, the constraint on filing an opposition is strictly based on legal cost C. If the patent stocks of the two company are non negligible, but the firm A owns a much larger number of patents there is an higher expected likelihood for firm A to file an opposition. Finally, when the two patent portfolios are numerous and comparable, the risk of retaliation is maximum and the previous constraint is more likely to bind, favouring the instauration of ex-ante settlements. The previous reasoning would suggest the presence of a U-shaped distribution of opposition according to the relative size of patent portfo lios .
The reciprocal risk of receiving counter suits on complex technology should in general prevent large companies from filing suits among them. On the other side, very small companies endowed with only one patent are expected to file patent suits even against large innovators because they are not suffering a credible retaliation risk on a different segment of their property rights’ portfolio17. The previous synthetic analysis jointly interpreted with the considerations presented in section three can be summarised in the following statements:
HP1: Large incumbent companies are expected to show mutual opposition rates statistically lower than the ones jointly involving one small and one large patentee. HP2: Larger companies induce higher litigation costs in terms of longer suits.
16
Here we are considering an exogenous probability, independent from firm characteristics. In the empirical section of the paper we have investigate this feature finding that the outcomes of the legal proceedings are indeed independent from the characteristics of the opponent.
17
Somaya (2003) elaborates on the issue of mutual hold-up and patent strategy suggesting that simply having a large patent portfolio may not be an adequate defence against attempted patent enforcement by rivals. Some potential opponents may be focused on specific narrow technologies. In order to account for this specific effect we calculated, for each company involved in an opposition procedure, both the overall patent portfolio and the specific portfolio on four telecommunication patent classes (defined at a four-digit IPC level).
In order to test the two previous hypothesis we will split the overall sample of firms involved in at least one opposition – either as opponent or opposed – into two sub samples of large and small patent holders. The distribution of patent portfolios in the telecommunications sector is highly skewed, with a limited number of companies endowed with very large patent portfolios and a long thin tail of residual patentees. For this reason, we included in the sub sample of large innovators the top 5% of companies in terms of patent portfolio over the years 1980-2002.
HP3: The presence of overlapping geographical markets should influence the decision to file an opposition.
This aspect will be investigated trough the observation of both the natio nality of the companies involved in the opposition and the priority state of the opposed patents18. We expect the use of the opposition procedure on EU patents to be different between European companies and U.S. or Japanese companies.
HP4: Smaller companies after receiving an opposition are less likely to continue their innovative activity, since they will not be able to access complementary technological assets.
The possible disincentive effect will be measured through the analysis of subsequent patent renewals after the patent has survived the opposition procedure. The decision to let the patent lapse for non payment of renewal fees right after the opposition can be interpreted as a reduced value perceived by the opposed firms. About this latter specific issue, in previous research, Lerner (1995) showed that small young biotechnology firms try to avoid patenting in patent classes characterised by high litigation rates. The analysis will be carried out using a proper control sample of non opposed patents to account for sector specific patent renewal policies.
HP5: Participating a standard setting organisation can affect the rate of opposition among member companies.
Standard setting, a characteristic peculiar to the network industries and in particular to that of telecommunications, is an extremely fertile ground for strategic patenting behaviour. With respect to this latter point, it is worth mentioning the attempt to influence the standardisation processes in one’s own favour using the threat of a patent which is declared indispensable for the definition of the standard but that is not completely disclosed, as in the often cited case of Qualcomm against Ericsson in the process of defining the 3G standard. Another form of strategic behaviour is the refusal to licence a blocking patent or even the voluntary concealment of a fundamental patent in the structure of the standard in order to gain, ex-post, enormous market power thanks to the imposition of the standard. Finally, standard-setting organisations themselves can set up discriminatory strategic behaviour, for example excluding from the consortium whoever is unwilling to concede a free licence for their own patent, or even being the
18
The priority number of a patent indicates the first country in which patent protection has been asked. Companies typically make an initial application for a local patent and then extend it to other patent systems. We will make a broad distinction among patents initia lly applied in Europe, U.S. and Japan.
victims of hold-ups by the companies who reveal the existence of patents which are fundamental for the definition of a standard after that standard has been completely defined (Shapiro, 2003). On these basis, one should expect that the participation into a standard, which is essentially based on the licensing of a certain number of patents on
the FRAND19 license, strengthens the strategic relationships among participants
encouraging non aggressive behaviours also on patents not included in the standard agreement.
5. Dataset and summary statistics
Our empirical analysis is based on an original dataset of European patents’ data extracted and matched from four distinct patent databases provided by the European
Patent Office : EUREG, EPODOC, EPIDOS and INPADOC20. The core data are
represented by the population of all the patents in the area of telecommunications that have been subject to opposition during the period 1980-2002. The telecommunication technologies have been identified according to 4 specific International Patent Classification classes21.
For each opposed patent we have been able to extract the names of both the assignee company and opponent company. We performed a detailed screening in order to consolidate the name and the ownership structure of the companies through the years involved in the panel. The legal cases characterised by multiple opponents have been duplicated considering the additional patent data of each opponent22.
A set of additional characteristics has been associated to each opposed patent, including the number of forward citations received, the number of patent families and the number of claims. Moreover, for each assignee and opponent we have performed an analysis of patent portfolio at the moment of the opposition in order to obtain measures of size and specialisation in the specific technological field of the opposed patents23. The overall sample consists of 488 opposed patents and 285 companies and individual inventors, involved either as plaintiffs or as infringers.
A random matched sample has been drawn from the population of European patent granted in the four-digit IPC classes selected for the study. For each patent subject to opposition, we extracted a patent granted in the same patent class and in the same semester. For the matched patent we collected data about the patent-specific characteristics and we computed the patent stock portfolio of its assignee at the moment of the grant. The latter data have been used to control for time and industry specific factors that might affect the statistical evidence that will be presented in this section. Before moving to the detailed presentation of our empirical evidence, it is worth remarking that, given the nature of the available data, we are not testing a structural model for patent opposition, but rather presenting a collection of statistical evidence that is expected to give the reader insightful intuitions about the actual dynamics and implications of the patent opposition phenomenon.
In the two following tables we show the trend in the number of granted patent and opposed patent in the telecommunication industry from 1980 through 2002.
20 The INPADOC database has been explored through the commercial database Delphion [www.delphion.com].
21
The selection of the relevant classes has been driven by interviews with patent examiners at EPO. H04B: This subclass covers the transmission of information-carrying signals and includes monitoring and testing arrangements and the suppression and limitation of noise and interference; H04J: This subclass covers circuits or apparatus for combining or dividing signals for the purpose of transmitting them simultaneously or sequentially over the same transmission path; H04L: This subclass covers transmission of signals having been supplied in digital form; H04M: telephonic communication systems combined with other electrical systems .
22
Within the sample these cases have been rare, not exceeding 2% of all the oppositions. A particular case is that of a German legal company that represent an association of broadcasting companies (Interessengemeinschaft für Rundfunkschutzrechte Gmb H) .
Table 1– Total number of patent opposition in TLC classes.
Source: Our elaboration on EPO data.
Table 2– Total number of paten granted in TLC classes. granted patent in TLC classes
0 200 400 600 800 1000 1200 1400 1600 1980 1982 1984 1986 1988 1990 1992 1994 1996 1998 2000 2002
Source: Our elaboration on EPO data.
The time profile of patent grants in the four main patent classes representing the TLC industry shows a steadily increasing trend, while a much diverging trend can be appreciated for the absolute levels of patent oppositions. The ratios of opposed to granted patent shown in Table 3 are slightly smaller than the ones presented by Harhoff and Reitzig (2004), but they highlight the economic relevance of the analysed phenomenon24
24 The authors estimated an average value of 8%. The d ifference is likely to be related to the different role of patents for different industries. See Jaffe and Trajtenberg (2002) for an extensive discussion.
oppositions 0 10 20 30 40 50 60 1980 1982 1984 1986 1988 1990 1992 1994 1996 1998 2000 2002
Table 3– Incidence of opposition per 100 granted patents in TLC patent classes by time intervals.
Years Oppositions per 100 granted patents
1980-1986 5.21
1987-1991 6.55
1992-1996 4.44
1997-2002 2.58
Source: our elaboration on EPO data.
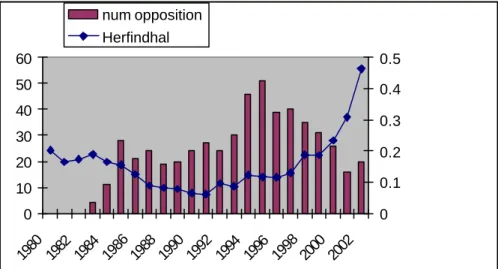
From the evidence presented in table 1 and 2 some interesting patterns emerge. First, it is clear how there is not a pure statistical relationship between the number of filed patents and number of oppositions. On the contrary, there must be some kind of underlying economic determinant that shifts over time the propensity to use this legal procedure in order to protect patents. There are two peaks in the incidence of oppositions respectively at the end of the 80s and around year 1996, while in more recent ye ars there has been a constant decreasing trend. The two peaks might be associated with the period immediately before the emergence of two crucial standards in mobile communications: GSM’s and UMTS’s ones. The increased technological uncertainty preceding the constitution of such standards might have plausibly strengthen the incentives to use legal tools to block rivals and defend own patent portfolios.
However, when observing the time trend of patenting (and oppositions) in the telecommunication industry, it is important to recall that this sector has undergone relevant shocks in the European countries linked to market liberalisation processes. Even if these policy interventions have directly affected service providers rather than technology producers it might be argued that the upsurge in oppositions in mid 90s is related to the industry liberalisation. We claim that - with specific reference to the phenomenon of patent opposition - this institution exerted only a second order effect. For each opposed patent included in the sample we have tracked the complete legal history after the filing of the opposition. A patent subject to opposition can be either fully upheld, revoked or amended. In the latter case a number of claims are removed from the patent. The aggregated statistics about the final outcomes of the centralised opposition procedures show that about 40% of opposed patents have been revoked, 25% have been amended, in 30% of the cases the opposition has been rejected by the court and in 5% of the case the opposition procedure is spontaneously withdrawn by the opponent company before the verdict of the EPO commission (Table 4).
In order to perform an initial analysis based on firm characteristics we selected among the overall companies involved in the opposition, a set of large innovators. This companies belong to the upper 5% in the distribution of patent portfolios in the TLC
patent classes25. Such sub sample of major innovators consists of 12 companies that represent 53% of all the opponent and 34% of all the opposed patent holder within our dataset.
Table 4– Final outcome of opposition procedure.
Opposition Full Sample Sample Excluding Major Innovators Major Innovators Patent Revoked 39,1% 40,6% 36,1% Patent Amended 23,7% 22,6% 25,1% Termination of Opposition 5,0% 3,3% 8,5% Opposition Rejected 32,2% 32,5% 30,3%
Source: Our elaboration on INPADOC data.
It is interesting to note that percentages of the different outcomes do not substantially change when we restrict the analysis to the patents belonging to the large companies26. This should support the hypothesis that the patent re-examination performed by the EPO commission is strictly based on technological issues and that the exa miners are not influenced by reputation effects. The only relevant difference is in the incidence of cases in which the opponent decides to withdraw the opposition previously filed before the EPO verdict (Termination of Opposition in Table 4). The latter percentage is higher when the opposed patent belongs to a major innovator, suggesting that a threat effect might be active.
From the data in table 3 we can as well induce that there are no relevant quality ex-ante differences between the patent granted to the large innovators and to other firms. This evidence will be important to exclude the possibility of quality effect when interpreting subsequent results about the companies involved in oppositions.
In order to pinpoint other possible patent-specific characteristics, that may produce spurious biases on our observations about strategic determinants, we have computed the average number of patent families27 and patent claims by opposition outcome. We have as well computed the previous values for the patent control sample.
The data in Table 5 suggest that there are no relevant bias in the subset of patent subject to opposition with respect to the non opposed patents. The only significant difference relates to the higher average number of claims for the opposed patents that have been eventually amended. This evidence seems to support the hypothesis that – at least in the telecommunication sector - these idiosyncratic characteristics of a single patent are one but a minor determinant of patent suit filings. This paves the way to our hypothesis that firms’ characteristics are a major factor in determining the decision to file the opposition.
25
The distribution of patent portfolio is rather skewed, the major innovators are the following: Alcatel, AT&T, Ericsson, Lucent, Motorola, NEC, Nokia, Nortel, NTT, Philips, Qualcomm, Siemens. 26
The incidence of revoked patent is slightly larger than the ones obtained by Harhoff and Reitzig (2004). In the biotechnology sector 30% of opposed patent were eventually revoked.
27
The number of patent families is the number of countries, also non European, for which protection has been asked. This parameter can be interpreted to some extent as a proxy for the commercial value of the patent and for the potential geographical extension of the patent-holder’s final market.
Table 5– Average and median number of patent families and patent claims for different outcomes of the opposition procedure.
Number of patent families
Number of patent claims
Amended Patent mean 15.22 18.56
median 12 15.5
Opposition Rejected mean 10.94 12.41
median 9 10
Patent Revoked mean 10.75 10.58
median 9 8.5
Control Sample mean 11.67 9.39
median 9 8
Source: our elaboration on EPO data.
One of the possible dimensions to observe firm- level strategies for the management of their patent portfolios is the payment of the renewal fees (Schankerman, 1999). By a theoretical perspective, the firm is expected to pay the renewal fees until such incremental cost equals expected revenues from the future exploitation of patent rights. Quite surprisingly, a relatively high percentage (14%) of survived patents28 are not renewed in the first four years after the end of the opposition procedure29 (Table 6). This might be a somehow contrasting result with respect to Haroff and Reitzig (2002) that associated patent opposition to higher patent quality, measured by patent citation analysis.
However, it is important to recall that they were working on the “single-product” pharmaceutical sector, while in the telecommunication industry, where technological complementarities are fundamental, the filing of an opposition from a competitor can be interpreted as a threatening signal of subsequent non-collaborative relationships that eventually lowers the private value of the opposed patent. Even more interestingly, the incidence of non renewed patent is clearly different for the two sub-samples of large and small companies. For the former we found a percentage of non renewed patent of about 11%, while for the latter the percentage raises to 17%. For a clearer interpretation of this evidence, we calculated the renewal rate also for the patent included in the control sample. The difference between the sub-samples of large and small innovators is more evident when taking into account work in progress patent30. These are cases of patent opposition for which there was not yet evidence from the legal database INPADOC of a final decision by the EPO court at the moment of this study.
28
The survived patents include the cases of opposition rejected, patent amended and spontaneous opposition withdrawal by the opponent.
29
The European patent system gives to the patentee the initial possibility to choose the number of countries in which protection will be provided. After the granting, each patent holder has to pay an individual renewal fee for every country. We considered a patent not fully renewed if it lapsed in at least three quarters of the total number of countries. This is due to avoid the risk of including among the non-renewed sub sample those patent that expired only in minor countries.
Table 6– Percentages of patents non renewed during the four years after the end of the opposition and during the work in progress period.
Patent renewal Full Sample Sample Excluding Major Innovators Major Innovators Control Sample
% Survived non renewed 14,5% 17,3% 11,0% 9.8%
% WP non renewed 20,1% 25,4% 6,7%
Source: Our elaboration on INPADOC data.
Even if the renewal policy can differ between large and small patentees for a range of factors, such discrepancy can be a signal of lower contracting power for smaller companies that prefer to stop investing on a technology even after winning the legal suit. In fact, the technological dynamics in the telecommunication sector are cumulative and the risk of incurring new oppositions on second-generation products can discourage smaller innovators31.
The third hypothesis presented in section three suggested that the decision to file a patent opposition might be somehow conditioned by the degree of final market overlapping among the companies involved. It is possible to assign each European patent to the country in which it was originally filed. This information can be interpreted as a proxy of the main geographical coverage of the patentee. When analysing the distribution of the country priorities of the opposed patents, some clear pattern emerge. While in the full population of European patents in the telecommunications classes non-EU priorities account for nearly 54% of total patents, such percentage decreases to 39% in the sample of patents subject to opposition. This evidence suggests that the geographical effect, if any, is rather weak. Alternatively, it is also plausible that patents already in force in the U.S. are more powerful and so less likely to be opposed.
Table 7– Percentages of patents with EU, US and JP priority in the TLC classes. Years 1980-1990
Priority Full Population Opposed Patents
EU 68,21 % 75,81 %
US 20,55 % 15,03 %
JP 11,24 % 9,16 %
Years 1991-2002
Priority Full Population Opposed Patents
EU 49,51 % 56,26 %
US 28,97 % 25,36 %
JP 21,52 % 18,36 %
Source: Our elaboration on EPO and INPADOC data.
In order to analyse the possible strategic effects underlying the decision to file patent opposition we focus on the sub sample of 12 large innovators. We have computed a simple matrix to identify the aggregated pattern of legal oppositions specifically
31 Scotchmer (1991, 1996) presents an insightful analysis of the issue of cumulativeness in complex product innovation and patent law.
involving these companies (Table 8). The evidence obtained is clear-cut and impressive for a series of reasons.
First, even if these companies appear as opponents in 48% of the analysed legal cases, only 14% of the oppositions jointly involves two of them. In particular, three of the main European patentees (Nokia, Siemens, Ericsson) never made any reciprocal opposition. Also Alcatel and Nokia never made any reciprocal opposition. Given that the companies included in the matrix own a large part of the overall patent portfolio in the TLC sector, the probability of reciprocally infringing patents should be large enough to generate a matrix less sparse than the observed one. The three top opponent companies have filed 187 legal suits, 71% of which against patent holder external to the 12 large companies included in the matrix. Second, non European companies make a very limited use of the opposition tool: altogether, they ha ve been opposed 73 times and filed opposition only 21 times. Third, the matrix shows some interesting symmetries, supporting the plausibility of retaliation strategies via counter-suits. See - for example - the cases of Nokia vs. Motorola (respectively 5 and 7 oppositions) or Alcatel vs. Philips (2 reciprocal oppositions).
Table 8– Matrix of oppositions between major innovators
Opp. 77 20 13 59 12 0 51 0 1 0 0 0 Ass. 1 2 3 4 5 6 7 8 9 10 11 12 Other 47 1 Siemens 0 0 2 0 0 9 0 0 0 0 0 36 29 2 Motorola 1 7 9 1 0 5 0 0 0 0 0 6 11 3 Nokia 0 5 0 0 0 0 0 0 0 0 0 6 18 4 Alcatel 1 0 0 0 0 2 0 0 0 0 0 15 7 5 Ericsson 0 2 0 1 0 1 0 0 0 0 0 3 9 6 Qualcomm 0 3 2 1 0 0 0 0 0 0 0 3 5 7 Philips 1 0 0 2 0 0 0 0 0 0 0 2 17 8 NEC 8 0 0 3 0 0 0 0 0 0 0 6 4 9 Nortel 0 1 0 2 0 0 0 0 0 0 0 1 5 10 NTT 1 0 0 1 0 0 1 0 0 0 0 2 1 11 Lucent 1 0 0 0 0 0 0 0 0 0 0 0 8 12 AT&T 0 0 0 1 0 0 0 0 0 0 0 0 7 Other 64 9 4 37 11 0 33 0 1 0 0 0
Ass. : Number of times the company appears as opposed in patent opposition. Opp.: Number of times the company appears as opponent in patent opposition
e.g.: Siemens has filed 77 oppositions of which 64 against companies not included in the matrix. Siemens has been attacked 47 times but in 36 cases the opponent was a company not included in the matrix.
Source: Our elaboration on EPO and INPADOC data.
The previous evidence might be to some extent explained through the participation of the analysed companies into standard setting organisations. In order to analyse this issue, we matched the firm level data on patent opposition to the databases provided by
the European Telecommunications Standard Institute (ETSI)32. The companies reported in Table 9 participated the three major telecommunication standards with at least one patent.
Table 9– Companies involved in patent opposition procedures that are members of communication standard.
GSM GPRS UMTS
ALCATEL ALCATEL ALCATEL
AT&T DE TE MOBILE CANON
BT ERICSSON ERICSSON
BULL S.A. KONINKLIJKE FRANCE TELECOM
ERICSSON MOTOROLA FUJITSU LIMITED
GEMPLUS SIEMENS AG HITACHI, LTD.
KONINKLIJKE KPN KONINKLIJKE KPN
LUPA S.A. LUCENT TECH.
MATRA COMMUNIC. MITSUBISHI
MITSUBISHI MOTOROLA
MOTOROLA NEC CORPORATION
NEC NOKIA CORPORATION
NTT OKI ELECTRIC IND.
NOKIA CORPORATION PHILIPS ELECTRONICS
PHILIPS ELECTRONICS QUALCOMM
ROBERT BOSCH ROBERT BOSCH GM BH
SAMSUNG SAMSUNG
SIEMENS AG SIEMENS AG
TELIA AB TELIA AB
VODAFONE TEXAS INSTR.
CP8 VODAFONE
Source: ETSI database on IPR and telecommunications standards
The list of companies presented in Table 9 includes most of the major innovators analysed. This would suggest the plausibility of the hypothesis linking standard setting and collusive coordination, but we acknowledge that further analyses will be required to account for the dynamic features of this phenomenon.
Hypothesis (2) suggested that the expected cost of opposition may heavily influence the strategies concerning patent opposition and litigation. Since the real amount of expenditure required for each oppositio n is not available, we have analysed the length of each legal proceeding included in the sample33.
Also in this case, we have split the sample to highlight possible differences in trial length linked to firm characteristics. The evidence presented in Table 10 and Table 11 show that there are not substantial differences in the duration of patent oppositions. The presence of a major innovator either as opposed company or as opponent company do not significantly modify the timing of the opposition procedure. This empirical finding
32
ETSI requires the owner of any IPRs (e.g. proprietary technology), who has declared those IPRs to be essential to meet an ETSI standard, to agree to grant licenses to use its IPRs in accordance with the ETSI IPR Policy [www.etsi.org].
33 Following the literature on litigation (Somaya, 2003) we hypothesize a positive correlation between duration and cost of the trial.
reflects the anecdotical evidence reported by Harhoff and Hall (2002) from interviews to patent attorneys
Table 10– Average length (years ) of the opposition procedure for the two sub samples of major innovators and smaller companies, selected on the basis of the opposed company.
Outcomes Major innovators Other companies
mean st dev mean st dev
All Outcomes 3,47 1,87 3,01 1,75
Opposition rejected 2,58 1,34 2,5 1,3
Patent revoked 3,71 2,26 3,18 2,08
Patent amended 3,84 1,72 3,78 1,5
Source: Our elaboration on INPADOC data.
Table 11– Average length (years ) of the opposition procedure for the two sub samples of major innovators and smaller companies, selected on the basis of the opponent company.
Outcomes Major innovators Other companies
mean st dev mean st dev
All Outcomes 3,14 1,67 3,08 1,70
Opposition rejected 2,81 1,21 2,61 1,31
Patent revoked 3,24 2,01 3,13 1,89
Patent amended 3,56 1,63 3,98 1,55
Source: Our elaboration on INPADOC data.
However, the data in Table 10 and Table 11 are relevant because they stress how the opposition procedure can generate a condition of increased uncertainty for the new patent holder. Such condition can last, on average, for more than three years. In an industry where the rate of technological change is high, this situation can have detrimental effects for the temporarily blocked new innovator. The economic impact of the increase in uncertainty following the filing of a patent suit has been estimated to range from 2% to 3% of market value for the involved company (Bhagat et al. 1994, Lerner 1995). The decision to keep on investing in second generation products, while being subject to patent opposition, may be particularly risky for smaller companies with limited differentiation opportunities.
Finally, we come to an aggregated analysis of the role played by inter- firm asymmetries in the decision to file an opposition. We have calculated, for each company included in the sample, its portfolio of patents at the moment of the opposition filing. In order to provide the most accurate measure of the potential width of the companies’ patent portfolios we have considered patent priority dates. In most of the times the opposing company owns a larger portfolio than the opposed one, with a median ratio value of 2.23 (Table 12). As a further hypothesis one might argue that most specialised patent portfolios would induce high incentives to file oppositions. In this perspective, we computed the average specialisation in TLC patent classes for
opponent and opposed companies34. Table 13 shows that this latter hypothesis is not supported by significant evidence.
Table 12– Ratios of patent stocks of opponent companies to opposed companies. Patent stock ratios All patent classes Telecommunication classes
Opponent > Opposed 65 % 61%
Opposed > Opponent 35 % 39%
Median ratio 2.23 1.68
Source: our elaboration on EPO data.
Table 13– Patent portfolio specialisation in the TLC classes, at the moment of the opposition, for opposed and opponent companies.
Opposed Opponent Mean 0.2849 0.2301 Variance 1.9175 0.1159 Dof 548 Stat t 0.8441 P(T<=t) 0.3989 t critical 1.9643
Source: our elaboration on EPO data.
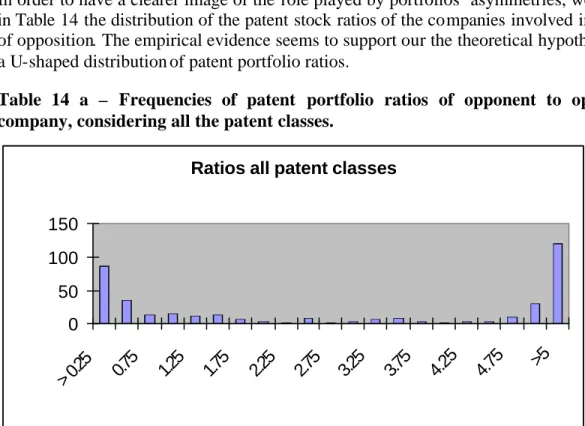
In order to have a clearer image of the role played by portfolios’ asymmetries, we show in Table 14 the distribution of the patent stock ratios of the companies involved in cases of opposition. The empirical evidence seems to support our the theoretical hypothesis of a U-shaped distribution of patent portfolio ratios.
Table 14 a – Frequencies of patent portfolio ratios of opponent to opposed company, considering all the patent classes.
Ratios all patent classes
0 50 100 150 > 0.25 0.75 1.25 1.75 2.25 2.75 3.25 3.75 4.25 4.75 >5
Source: our elaboration on EPO data.
34 The specialisation index is given, for each company, by the ratio of the number of patents in the TLC classes to the full number of its patent at the moment of the suit.
Table 15 b – Frequencies of patent portfolio ratios of opponent to opposed company, considering only the telecommunication patent classes.
Ratios telecommunications patent classes
0 50 100 150 200 < 0.25 0.5 0.75 1 1.25 1.5 1.75 2 2.25 2.5 2.75 3 3.25 3.5 3.75 4 4.25 4.5 4.75 >5
Source: Our elaboration on EPO data.
When analysing in deeper details the cases in which the opponent’s portfolio is much smaller than the opposed’s one (left side of the horizontal axis in table 14- b), it is interesting to note that a large majority of the 110 cases displaying a ratio of opponent to opposed TLC patent portfolio below 0.25 are represented by opponent companies that holds, at the moment of the opposition, only one (or zero) granted patents.
Indeed, this situation occurs in 87 cases out of 110, suggesting how the absence of a credible retaliation effect can induce also smaller patentees to file suits against larger companies35. On the other side, it is interesting to highlight that in 20% of the cases the oppositions have been filed against new innovators, not endowed with any patent before the opposition. In order to control for the possibility that the frequency distributions in Table 15 are simply due to the average patent portfolio distribution in the overall population of patentees, we calculated a baseline frequency distribution of portfolio ratios, by means of the sample of matched patents (Table 16).
Table 16 – Distribution of patent portfolio ratios from the control sample.
Baseline patent stock ratios
0 5 10 15 20 25 30 35 0.25 0.75 1.25 1.75 2.25 2.75 3.25 3.75 4.25 4.75
Source: our elaboration on EPO data.
35 In fact, in this situation the attitude of patenting company could be described as “win-it or loose-it”. Not having a patent portfolio voids de facto the likelihood of a retaliation.