Twenty Second European Conference on Information Systems, Tel Aviv 2014 1
Completed Research Paper
Li, Mei, National University of Singapore, Singapore,
[email protected]
Goh, Khim-Yong, National University of Singapore, Singapore,
[email protected]
Cavusoglu, Huseyin, University of Texas at Dallas, USA,
[email protected]
Abstract
As an exploratory study, this paper examines the factors that influence new developers’ entry to the mobile app industry, focusing on indirect network externality (INE) between hardware and software sides as well as direct network externality (DNE) between potential entrants and existing developers. Specifically, we hypothesize that INE encourages new developers’ entry whereas DNE changes with the growth of mobile platforms. To test our hypotheses, we gathered comprehensive data on mobile apps, developer-related factors from the four platforms (Apple iOS, Google Android, BlackBerry and Windows Phone) and user base of each platform. Our econometric analyses based on platform-pooled and platform-separated models reveal interesting patterns about developers’ entry decisions. An inverted U-shaped DNE between existing developers and new entrants is found. For INE, our results show that new developers are more likely to enter a platform with a larger user base. Given a platform, the entry timing is affected by the characteristics of the platform. The impacts of incumbents and price level are also discussed.
Keywords:
firm entry, network externality, mobile app industry, software developers,
two-sided market
Twenty Second European Conference on Information Systems, Tel Aviv 2014 2
1
Introduction
With the accelerating maturity of telecommunications technology, consumers’ attention has shifted tremendously from traditional personal computers (PC) and laptops to mobile devices. As a major component of mobile devices, smartphones herald the incoming mobile era. The success of smartphones cannot be solely attributed to advanced hardware configuration and convenient built-in features, but should also be credited to the rapidly emerging mobile app industry. Apple (2013) announced its 50 billion accumulated downloads in March last year, demonstrating the enormous market potential for mobile apps. A newly released report by PortioResearch (2013) states that consumers’ mobile app downloads might rocket to 200 billion annually by 2017, more than four times the total downloads in 2012. The huge demand from mobile device users for mobile apps has incentivized millions of software developers to publish mobile apps. However, a sobering fact is that most mobile app developers cannot sustain their development business due to the curse of power law (Lee & Raghu, 2011). That is, a large number of app downloads are driven by a relatively small proportion of apps. Therefore, examining developers’ behaviour on mobile platforms is of great importance to understand and predict the future trend of mobile app markets.
In this study, we examine app developers’ entry behaviour to mobile app platforms to gather insights for both platform owners and potential new entrants. Platform owners are interested in attracting more developers to publish apps on their own platform. Potential entrants may wish to avoid entering a platform at its peak by understanding their counterparts’ entry patterns and strategically enter into a platform market. As we all know, the statistics of app downloads are unavailable to the public (Garg & Telang, 2013). Potential entrants can hardly know the revenue of existing apps. It is difficult for them to make a business plan in such an information asymmetric and fast innovating market. Nonetheless, an interesting phenomenon we observed is that new developers sometimes swarm to some platforms in response to mass media’s uplifting news, even though a large number of developers are already on the platforms. Since existing literature on mobile developers is relatively scant, we investigate what factors influence new mobile developers’ entry to mobile app platforms and how they make decisions with limited information available to them.
Multiple stakeholders are present in the mobile app industry, including platform owners (e.g., Apple, Google, and Windows), mobile device manufacturers (e.g., Apple, Samsung, and LG), app developers and consumers. This study focuses on mobile app developers, an under-researched entity in the literature (Bergvall-Kåreborn & Howcroft, 2011). To understand their entry behaviour, we employ the theoretical perspective of network externality since mobile app markets possess the typical characteristics of a two-sided market, where strong indirect network externality (INE) is present (Armstrong, 2006; Rochet & Tirole, 2003). Consumers are more willing to adopt mobile devices with a wider range of apps and developers prefer to enter into platforms with a larger user base. Different from previous two-sided market literature, we provide contributions on the software side by incorporating various factors of mobile apps across multiple competing platforms rather than merely the software availability (Basu, Mazumdar, & Raj, 2003; Clements & Ohashi, 2005; Nair, Chintagunta, & Dubé, 2004). In addition, we also consider direct network externality (DNE) on the developer side which has been frequently ignored by prior research (e.g., Basu et al., 2003; Clements & Ohashi, 2005). Unlike negative externality assumed in prior analytical studies, we propose that this DNE changes with the growth of mobile platforms.
Our results based on both platform-pooled and platform-separated analysis reveal a significant effect of DNE among developers. A non-linear relationship between the numbers of existing developers and new developers exists. The inverted U-shaped relationship indicates that in the early growth phase of mobile platforms, developers’ entry is motivated by a moderate number of existing developers in the platform-category; however, once the number of existing developers crosses a peak point, new developers’ entry is inhibited by the large number of existing developers who are already in the market.
Twenty Second European Conference on Information Systems, Tel Aviv 2014 3 Additionally, we found interesting patterns of INE when comparing the results of platform-pooled model and platform-separated models. New developers are more willing to select a platform with a larger user base. Given a platform, their entry time depends on the characteristics of the platform. For the early-moving platforms (i.e., iOS and Android) in the mobile app industry, developers are confident of the platform growth and are willing to enter even when these platforms are still in an early development phase (with a small user base). However, developers’ entry intention is more conservative for the late-moving platforms (i.e., BlackBerry and Windows Phone). New developers enter these platforms only when they have observed a substantial user base. Besides the number of developers on mobile platforms, we also investigate the impact of developer composition by accounting for the number of incumbent developers. Moreover, price as one of the crucial marketing factors that influence consumers’ decision making is discussed as well.
The rest of the paper is organized as follows. In the next section we review the literature, followed by hypotheses development in section 3. We then present our research methodology and results. In the last section, we discuss our findings and conclude the paper.
2
Literature Review
Our study draws from two streams of literature. The first one is the literature on firm entry, which is tightly related to our research questions. The other one is two-sided market literature, since mobile app market is a typical two-sided market where developers and consumers can interact with each other.
2.1 Firm Entry
Firm entry relates to the supply side of business transactions and has great implications for both companies and policy makers. Various factors influence new firms’ entry. One group of factors is related to external market environment, such as profit margin, industry’s innovative level, price falling speed, the number of large firms (Bayus, Kang, & Agarwal, 2007). The other group is relevant to potential entrants themselves. For instance, factors like development cost, patenting, risk bearing ability may have impact on firms’ decision to enter a new market (Cockburn & MacGarvie, 2011; Wu & Knott, 2006).
Prior literature also offers valuable suggestions and strategies to practitioners. A dominant viewpoint of entry timing is to enter a market as early as possible because of the first-mover advantage (Bain, 1956; Kerin, Varadarajan, & Peterson, 1992; Robinson, Kalyanaram, & Urban, 1994). Early entrants could exploit market opportunities without intensive rivalry and sometimes can influence users’ definition of a new product (Carpenter & Nakamoto, 1989). In order to obtain first-mover advantages as well as to deter competitors, potential entrants may enter into a new market even though the time is too early for them (Seamans, 2012). However, facing with a highly uncertain market, firms sometimes prefer to imitate their counterparts (Debruyne & Reibstein, 2005).
Above mentioned studies are all based on game theory, which relies on the critical assumption of firms’ rationality. As rational business agents, firms always act in a way to maximize their profits and everyone reacts similarly given a same information set. However, the composition of developers in mobile app markets is more complicated than traditional markets since both professional software companies and indie amateur developers coexist in this market (Qiu, Gopal, & Hann, 2011). Indie developers possess different properties than professional companies, which may result in a discrepant behaviour. To the best of our knowledge, there is no study investigating developers’ entry behaviour in the rapid emerging mobile app markets. Therefore, this paper intends to enrich firm entry literature by examining a special composition of developer entrants.
Twenty Second European Conference on Information Systems, Tel Aviv 2014 4
2.2 Two-sided Market
Rochet and Tirole (2003) define a two-sided market as the marketplace where two different types of users participate. In this special market, users on one side value the participants on the other side. This phenomenon actually is a form of network externality (Katz & Shapiro, 1985; Shankar & Bayus, 2003), which indicates that the value of a goods or service depends on the number of other users using it as well. Network externality represents itself in two different forms in a two-sided market. One is direct network externality (DNE) that the value of the product directly comes from the other users who also use it. For example, users prefer to join social network sites which have a larger user base, since they can meet more people there. The other form is indirect network externality (INE), suggesting that the value of a product or service is influenced by its complementary products or service. For example, many consumers choose Windows operating system because of a large selection of compatible software on the platform, where the provision of software increases consumers’ valuation of Windows. INE is the most prominent feature of a two-sided market, since the utility of at least one side is related to the presence of the other side. Hardware-software market is a frequently investigated two-sided market. Software providers are likely to maximize profits by developing software for platforms with higher penetration rates, while software availability directly influences consumers’ valuation of the hardware (Katz & Shapiro, 1985). This results in a virtuous circle between consumers and software providers. Consequently, a hardware market with better service in terms of complementary products might attract more customers (Brynjolfsson & Kemerer, 1996; Clements & Ohashi, 2005).
In addition, DNE might exist among the participants on the same side and its effect could be either positive or negative (Katz & Shapiro, 1992; Kauffman, McAndrews, & Wang, 2000). However, almost all of the existing two-sided market studies only account for INE with the argument that compared to INE, DNE is trivial and can be unaccounted for. However, DNE is important based on some prior work. Both Armstrong (2006), Belleflamme and Toulemonde (2009) incorporate negative DNE to their analysis and find that an unambiguous market failure may happen with this within-group externality.
To conclude, few empirical studies about two-sided market examine DNE. We intend to bridge this gap by investigating both DNE and INE in mobile app markets. Unlike prior work which mostly evaluates two-sided markets from the perspective of consumers, we explore developers’ side by integrating more developer-related measures compared to solely the availability of software.
3
Research Model and Hypotheses Development
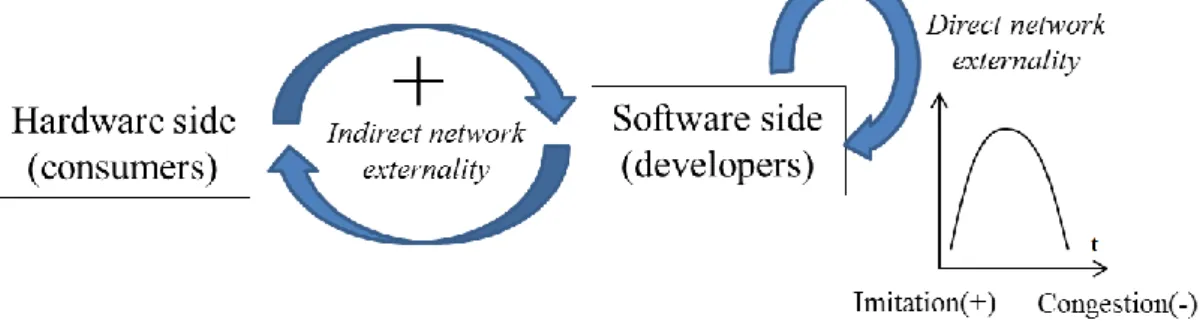
Figure 1 Illustrative Research Model
Mobile app stores classify apps into different categories according to the apps’ function. We contend that competition within a category is much larger than between categories since apps in different categories are highly differentiated from each other in terms of their function and content. Potential
Twenty Second European Conference on Information Systems, Tel Aviv 2014 5 developer entrants are more likely to consider the competition within the category where they intend to enter rather than the competition in the whole platform. Thus, in this study we treat each category as an independent software market. Consistent with prior literature on firm entry (Gort & Klepper, 1982; Wu & Knott, 2006), the number of natural entry incidences in a certain time period to each category is used to measure new developers’ entry. Mobile app market is a two-sided market, where consumers and mobile developers can interact with each other. In this market, both DNE and INE are present. Drawing from prior literature, we propose that hardware adoptions have positive effects on developers’ entry (e.g., the positive feedback loop between software side and hardware side). However, a non-linear DNE, which varies with the diffusion process, is conjectured. An illustrative research model is shown in Figure 1.
A distinct and eminent trait of a two-sided market is INE (Armstrong, 2006; Clements & Ohashi, 2005), namely the positive feedback loop between participation of the two different types of agents. From the viewpoint of developers, they prefer to join a platform with a larger user base. Therefore, software platforms with a larger user base might attract more potential developer entrants. Furthermore, the growing speed of user base also matters for developers. The fast growth of user base indicates high popularity and large amount of consumer interest for the platform. This rapidly emerging market may provide a large addressable market space for developers in the future. Ceteris paribus, developers are more likely to participate in the faster growing platforms. Thus, we hypothesize:
Hypothesis 1 (H1): The user base of a mobile platform is positively associated with new developers’ entry to each category.
Hypothesis 2 (H2): The growth rate of user base of a mobile platform is positively associated with new developers’ entry to each category.
While most studies on two-sided market only focus on INE, simplifying the analysis by neglecting DNE, in this study we argue that DNE does influence developers’ entry behaviour. Both Armstrong (2006) and Belleflamme and Toulemonde (2009) contend that negative DNE exists on the seller side and this further complicates the analysis since market failure might happen. In present research context, we posit that this externality varies with time and displays a non-linear relationship along with time.
Though DNE suggests positive externality of existing adopters to new adopters, sometimes it creates an opposite effect (Srinivasan, Lilien, & Rangaswamy, 2004). At the beginning of a product life cycle, few consumers know the true value of the innovation and they choose a “wait-and-see” approach. Only when the number of existing adopters exceeds their own definition of critical mass, they would purchase the product. Hence, there might be a silent period of sales before dramatic growth, the so-called “chilling effect” (Gatignon, 2010; Goldenberg, Libai, & Muller, 2010; Rust, 2010).
This “chilling effect” possibly takes effect in a two-sided market. Consumers wish enough apps existed to add value, while developers appreciate more consumers to provide a larger addressable market. However, for potential entrants, a first-mover strategy can provide advantages to capture a large initial market share (Robinson et al., 1994). Encountered with such conflicting scenarios, they are more likely to imitate their counterparts’ behaviour, hence the contagion effects among entrants (Debruyne & Reibstein, 2005). Mimicking peer developers’ entry behaviour, potential developer entrants can not only overcome the negative effects caused by the information scarcity of the new market, but also reap the positive externalities on the consumer side. Therefore, in the early phase, potential entrants are more willing to step into the market if they observe more developers who are already on a platform.
As time passes by, business press reports help both developers and consumers to better grasp the market dynamics. The effect of market uncertainty may be eliminated progressively. In this period, potential entrants are more concerned about the competition intensity of the platform – whether entry is profitable or not due to the congestion effect. At this moment, the congestion effect lends itself as a
Twenty Second European Conference on Information Systems, Tel Aviv 2014 6 negative DNE on developer side (Schmalensee & Evans, 2007). Hence, we contend that a non-linear relationship exists between new developers’ entry and the number of existing developers. An inverted U-shaped relationship is therefore expected and we propose:
Hypothesis 3 (H3): There is an inverted U-shaped relationship between existing developers of a category and new developers’ entry to that category.
Besides the number of existing developers, the composition of developers may influence new developers’ entry. The existence of incumbents has been considered having significant impact on the entrants’ entry decision and performance (Bayus et al., 2007; Cockburn & MacGarvie, 2011). Similar to the distribution of book sales on Amazon, the downloads of mobile apps also display the pattern of Pareto distribution (Lee & Raghu, 2011). That is, about twenty percent of the total apps attract eighty percent of the total downloads. Most of these highly popular apps are developed by the large or professional software studios, which possess economies of scale to continuously develop and maintain the apps. In addition, these studios have strong monetary support to conduct all kinds of promotional activities and can bear larger loss than the small- or middle-scale developers. Furthermore, these incumbents might have great advantage over the new entrants in terms of reputation and loyal consumers. Therefore, the number of established incumbents directly influences the competition intensity of the market (Bayus et al., 2007) and we hypothesize:
Hypothesis 4 (H4): The number of established incumbents in a category is negatively associated with new developers’ entry to that category.
As an explorative study, we want to investigate the important factors that influence developers’ entry to mobile platforms. Price is a vital factor for both app developers and consumers. Developer entrants would consider the existing price level in the market before entering, since ceteris paribus it determines the entrants’ profitability (Simonsohn, 2010). However, in this research context it may not be the case. Mobile apps are information goods which bear negligible cost to reproduce and distribute, given that their development and maintenance costs are already sunk (Bakos & Brynjolfsson, 2001). Developers would like to reduce app price to attract more consumers. Though the size of user base is a good indicator of addressable market for developers, it is still difficult for new entrants to estimate the number of potential users of the category where they intend to enter. Not all smartphone users install apps and their demands for each category may not be the same. In firm entry literature, price is a factor that can reflect the size of potential consumer group. Larger demand can speed up the price reduction rate of a product due to competition (Bayus et al., 2007). Thus, the price level of a category is a good predictor to estimate the number of potential users of that category. The lower the price level is, the larger the potential user group may exist. Therefore, we posit:
Hypothesis 5 (H5): Price level of a category is negatively associated with new developers’ entry to that category.
4
Methodology
4.1 Data Collection and Operationalization
As stated above, the context of our study is the mobile app industry. According to current market share of mobile platforms, we mainly focus on the four dominating mobile app stores – Apple App Store, Google Play, BlackBerry World and Windows Phone Marketplace. These four mobile platforms together serve more than ninety percent of the smartphone users (IDC, 2013).
To empirically validate our hypotheses, data on both software and hardware sides are needed. We obtained app information from Mobilewalla (Datta, Dutta, Kajanan, & Pervin, 2012), which kept track of app information from the four mobile app stores, including basic information of each app, version updating history and ranking since its inception date of December 23, 2009. For hardware side, we
Twenty Second European Conference on Information Systems, Tel Aviv 2014 7 obtained user base of each platform from comScore MobiLens, which provided the size of net user base of the four platforms in monthly manner from December 2009. In addition, the apps were classified into 19 categories1 according to their content and function. Thus, the empirical analysis in this study was conducted on platform-category-month level from a longitudinal perspective.
We define new developers’ entry time as the time when their first app was released. Thus, developers’ entry history can be recovered from the app release date. It enables us to extract the number of competitors in each month. Our observation period spans from January 2010 to March 2012. With an exception, Android’s data is available only from May 2011 to March 2012 due to Mobilewalla’s technical limitations. We define established incumbents as those large developers with ample monetary and labour resources, who have more potential to perform well. Given the lack of data on developers’ characteristics, we operationalized it as the large developers who were ranked in top 102
of the store by Mobilewalla at least once in that month. Price level measures the pricing of apps in a category and was computed as the average price of all paid apps in that category.
User base (i.e., UserBase) is the number of active devices of particular mobile platform in a month. The growth rate of user base (i.e., UserBaseGrowthRate) was computed as the percentage increase of user base in a month relative to user base of last month (shown in equation (1)).
*100 UserBase - UserBase i,t i,t - 1 UserBaseGrowthRate = i,t UserBase i,t - 1 (1) where i denotes mobile platform and t denotes month.
Besides, some other factors may influence developers’ entry behaviour, including the numbers of apps and free apps in a category, the average user rating score and rating counts of a platform-category. Platform dummies and category dummies were included to control for platform-specific and category-specific effects. We also incorporated month dummies to capture time trends. Table 1 shows variable definitions and descriptive statistics of the key variables can be found in Table 2.
Variable Definition
NewEntryi,j,t Total number of new developers in category j of platform i in month t.
UserBasei,t Total number (in million) of active devices of platform i in month t.
UserBaseGrowthRatei,t Growth rate of user base of platform i in month t, calculated according to
equation (1).
Developersi,j,t Total number (in thousand) of existing developers in category j of platform i
in month t.
Incumbentsi,j,t Total number of established incumbents in category j of platform i in month t.
PriceLeveli,j,t Average price of all paid apps in category j of platform i in month t.
Control Variables
Appsi,j,t Total number (in thousand) of apps in category j of platform i in month t.
FreeAppsi,j,t Total number (in thousand) of free apps in category j of platform i in month t.
RatingValencei,j,t Average consumer rating score (normalized to 0~1) of apps in category j of
platform i in month t.
1 As space limit, we are unable to provide detailed description about how to classify the apps. The categorization scheme is
available upon request.
2 As a robustness check, we also used top 30 and top 50 to identify the incumbent developers. The alternative measurements
Twenty Second European Conference on Information Systems, Tel Aviv 2014 8 RatingVolumei,j,t Average number (in hundred) of ratings received by apps in category j of
platform i in month t. Platform
Dummies Indicators of platforms. Category
Dummies Indicators of categories.
Month Dummies Indicators for each month between January 2010 and March 2012. Table 1 Variable Definition
Variable Mean Std. Dev. Min Max
NewEntry 152.580 253.291 0.000 2055.000 UserBase 18.413 10.976 4.060 52.100 UserBaseGrowthRate 1.731 4.722 -10.000 12.195 Developers 4.529 6.726 0.006 38.827 Incumbents 0.604 1.087 0.000 8.000 PriceLevel 1.630 1.110 0.000 7.742 Apps 14.503 23.380 0.006 144.629 FreeApps 5.838 9.040 0.003 54.923 RatingValence 0.366 0.149 0.023 0.821 RatingVolume 2.483 5.163 0.010 50.160 Table 2 Descriptive Statistics (obs. = 1501)
4.2 Model Specification
The specification of our econometric model is shown in equations (2), (3) and (4). As NewEntry is an over-dispersed count variable, we chose negative binomial model to do estimation. In order to test the hypothesized non-linear relationship between existing developers and new developers’ entry, a quadratic term of existing developers has been added to the model. Since developers are unable to react to the market environment immediately, we took one-month lag3 for all the independent variables.
y i, j,t y P NewEntry = y = y , where y = 0, 1, 2, 3 … (2) 2 2 (3) , , , 1 , 1 2 , 1 3 , , 1 2 4 , , 1 5 , , 1 6 , , 1 , , ( ) exp( ) i j t i j i t i t i j t i j t i j t i j t i j tE NewEntry UserBase UserBaseGrowthRate Developers
Developers Incumbents PriceLevel ControlVariables
(4)
where i denotes mobile platform, j indicates category and t is month.
4.3 Results
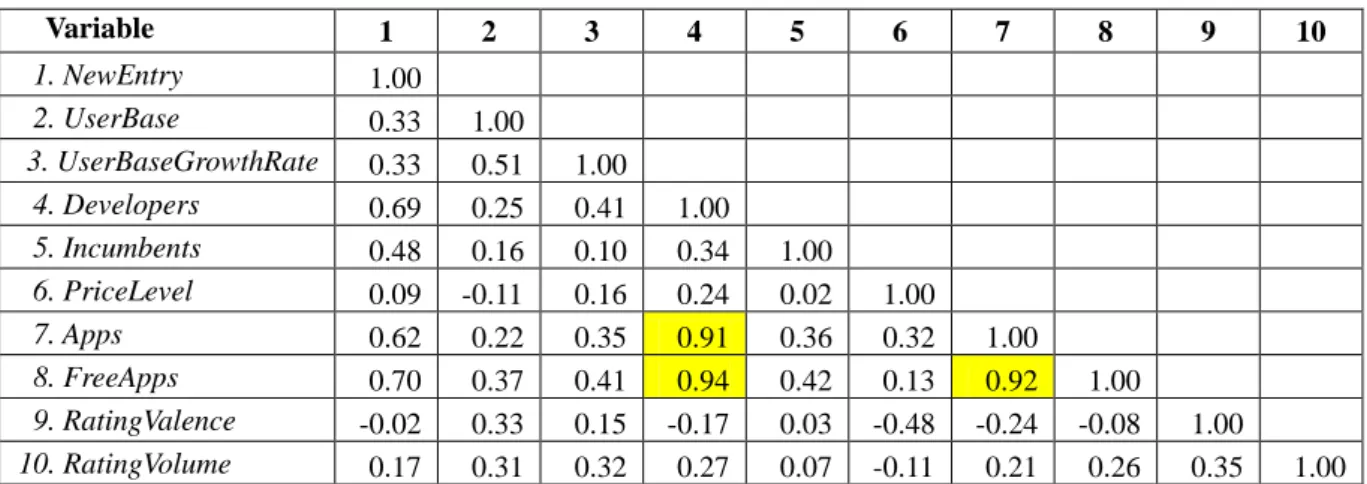
We ran a pooled model first, which includes the four major platforms, iOS, Android, BlackBerry and Windows Phone (WinPhone). Correlation matrix is shown in Table 3. Most of the correlation values in the cells are acceptable except for three pairs, i.e., Apps and FreeApps, Apps and Developers,
3 We also tried the model specification with two-month lag and three-month lag, respectively. Both produced similar results
Twenty Second European Conference on Information Systems, Tel Aviv 2014 9 FreeApps and Developers. However, high correlation only increases standard error if the correlated variables are significant in the estimation results (Wooldridge, 2009). We will check the significance of these variables and decide whether drop some of them to avoid multicollinearity later.
Variable 1 2 3 4 5 6 7 8 9 10 1. NewEntry 1.00 2. UserBase 0.33 1.00 3. UserBaseGrowthRate 0.33 0.51 1.00 4. Developers 0.69 0.25 0.41 1.00 5. Incumbents 0.48 0.16 0.10 0.34 1.00 6. PriceLevel 0.09 -0.11 0.16 0.24 0.02 1.00 7. Apps 0.62 0.22 0.35 0.91 0.36 0.32 1.00 8. FreeApps 0.70 0.37 0.41 0.94 0.42 0.13 0.92 1.00 9. RatingValence -0.02 0.33 0.15 -0.17 0.03 -0.48 -0.24 -0.08 1.00 10. RatingVolume 0.17 0.31 0.32 0.27 0.07 -0.11 0.21 0.26 0.35 1.00 Table 3 Correlation Table
We estimated both fixed-effects and random-effects models with the panel data. The command of xtnbreg with either fe or re option in Stata 12.0 was used for estimation. The Hausman test rejects the null hypothesis, suggesting that fixed-effects model produces consistent results. Thus we only reported the results of fixed-effects in Table 4. Negative binomial model is not a linear model and the estimated model coefficients are not directly interpretable. For convenient interpretation, marginal effects at means of covariates were reported. Since Developers, Apps and FreeApps are all significant, multicollinearity is not a problem for our estimation (Wooldridge, 2009). As per Table 4, the results show that both UserBase and UserBaseGrowthRate positively influence new developers’ entry. H1 and H2 are supported. Both the linear and quadratic terms of Developers are significant. The signs suggest an inverted U-shaped relationship between the number of existing developers and new developers’ entry, supporting H3. Incumbents and PriceLevel are insignificant, leaving H4 and H5 unsupported.
Variable
Fixed-effects
Marginal
effects Variable Fixed-effects
Marginal effects UserBase 0.065*** 0.738*** FreeApps -0.053*** -0.605*** (0.008) (0.135) (0.014) (0.197) UserBaseGrowthRate 1.591* 18.126* RatingValence 0.929** 10.591* (0.862) (10.623) (0.470) (5.522) Developers 0.211*** 2.401*** RatingVolume 0.012 0.133 (0.024) (0.537) (0.015) (0.174)
Developers2 -0.002*** -0.022*** Platform 2 (Android) -3.081*** -35.112***
(0.000) (0.005) (0.352) (7.768) Incumbents 0.010 0.116 Platform 3 (BlackBerry) -0.708*** -8.074** (0.010) (0.110) (0.238) (3.567) PriceLevel 0.019 0.215 Platform 4 (WinPhone) 0.409 4.656 (0.016) (0.183) (0.296) (3.050) Apps 0.012*** 0.137** Constant -2.364*** - (0.005) (0.057) (0.315)
Note: 1. There are 76 platform-categories in the dataset.
2. Category and month dummies are included in the model but not reported here due to space limit. 3. Marginal effects are calculated with zero fixed-effects.
4. Standard errors in parentheses *** p<0.01, ** p<0.05, * p<0.1.
Twenty Second European Conference on Information Systems, Tel Aviv 2014 10 Three control variables are significant, namely Apps, FreeApps and RatingValence. The coefficient of Apps is positive, suggesting that developers are willing to enter a category with more apps. This is a bit counterintuitive, but as mobile platform is a two-sided market, the number of apps available in a category, in a certain degree, reflects the user size of that category. Thus, this positive coefficient may imply that new developers prefer to develop apps for popular categories. The negative sign of FreeApps indicates that new developers are averse to a category with too many free apps, which might intensify competition in the category. The positive sign of RatingValence indicates that potential entrants are more likely to enter a category with higher user ratings. Furthermore, platform dummies for Android and BlackBerry are significant. Apple iOS is the baseline, compared to which, new entrants are reluctant to enter both Android and BlackBerry. This shows developers’ extreme passion for iOS, consistent with the viewpoint of market analysts. Month and category dummies capture time trend and category-specific effects, respectively. Due to space limit, their coefficients are omitted but available upon request.
The pooled analysis above reflects entrants’ average preference among different stores, capturing both cross-platform and within-platform variation. We cannot tease out the effects of in-store measurements separately. Thus, we next estimated platform-separated models with consideration of competing platforms. We evaluated the influence of each store’s new developers and existing apps on new developers’ entry to other platform-categories. The model is specified in equation (5).
, , 1 2 3 2 4 5 6 7 8 9 10 1 2 3 , j, , j, , j, i j t i i,t -1 i,t -1 i, j,t -1 i, j,t -1 i, j,t -1 i, j,t -1 -i t -i t -i t
NewEntry UserBase UserBaseGrowthRate Developers Developers Incumbents PriceLevel NewEntry
NewEntry NewEntry App
11 12 , , 1 2 3 , j, , j, , j, -i t -i t -i t i j t s Apps Apps ControlVars (5)
where i represents platform (i could be iOS, Android, BlackBerry or WinPhone), j indicates category and t is month. –i denotes platforms other than i.
As Android’s observation is only available since May 2011, we had to concentrate our analysis on the shortest observation period – May 2011 to March 2012, during which we have information for all competing platforms. The descriptive statistics of this modified dataset have been omitted due to space limit. We conducted data analysis for each platform separately with cross-platform variables. Since new entries to the platforms may affect each other simultaneously, we used three-stage least squares to estimate this equation system. The command of reg3 in Stata 12.0 was employed to do the estimation. According to the correlation table (omitted but available upon request), the two significant control variables (i.e. FreeApps and RatingValence) in Table 4 are highly correlated with some other variables of our research interest. To deal with potential multicollinearity, we dropped them from our model.
Variable iOS Android BlackBerry WinPhone
UserBase -18.671*** (5.699) -20.314*** (5.223) 14.810** (6.193) 33.078 (20.604) UserBaseGrowthRate 1.784 (3.321) 16.733 (12.623) -6.355*** (1.756) -2.348*** (0.710) Developers 67.372*** (4.585) 67.516*** (14.689) -30.265 (18.758) 111.925*** (17.095) Developers2 -1.084*** (0.130) -3.559*** (1.075) 42.802*** (4.875) -34.801*** (6.961) Incumbents -3.269 (6.752) 58.955*** (15.944) 27.528*** (4.448) 5.171*** (1.952) PriceLevel -14.590* (7.827) -66.468** (27.213) -9.824* (5.667) -6.177** (3.132)
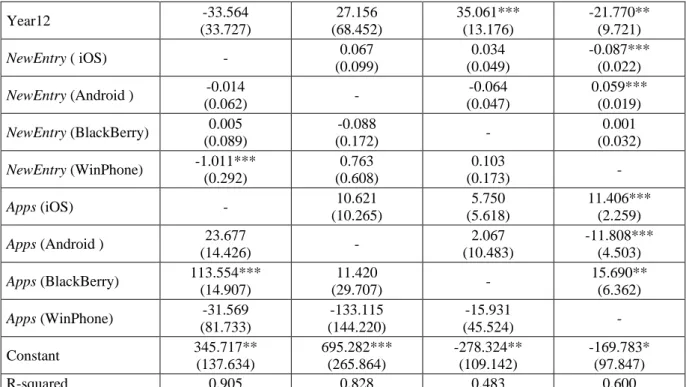
Twenty Second European Conference on Information Systems, Tel Aviv 2014 11 Year12 -33.564 (33.727) 27.156 (68.452) 35.061*** (13.176) -21.770** (9.721) NewEntry ( iOS) - 0.067 (0.099) 0.034 (0.049) -0.087*** (0.022) NewEntry (Android ) -0.014 (0.062) - -0.064 (0.047) 0.059*** (0.019) NewEntry (BlackBerry) 0.005 (0.089) -0.088 (0.172) - 0.001 (0.032) NewEntry (WinPhone) -1.011*** (0.292) 0.763 (0.608) 0.103 (0.173) - Apps (iOS) - 10.621 (10.265) 5.750 (5.618) 11.406*** (2.259) Apps (Android ) 23.677 (14.426) - 2.067 (10.483) -11.808*** (4.503) Apps (BlackBerry) 113.554*** (14.907) 11.420 (29.707) - 15.690** (6.362) Apps (WinPhone) -31.569 (81.733) -133.115 (144.220) -15.931 (45.524) - Constant 345.717** (137.634) 695.282*** (265.864) -278.324** (109.142) -169.783* (97.847) R-squared 0.905 0.828 0.483 0.600
Note: 1. As we only have 190 observations for each platform, the addition of month dummies made the model unidentified. Thus, year dummy was included to control for time trend instead.
2. Standard errors in parentheses *** p<0.01, ** p<0.05, * p<0.1
Table 5 Platform-Separated Analysis with Cross-Platform Effects
Table 5 shows the estimation results. Compared with Table 4, the coefficients of some variables have changed. UserBase and UserBaseGrowthRateare not uniformly positively related to NewEntry. The coefficients of UserBase of iOS and Android are negative and WinPhone’s UserBase does not significantly influence the new entry. What causes this change might be the platform-separated estimation. The coefficients show the effects of user base conditional on a given platform, instead of the effects across different mobile platforms. The pooled model captures both cross- and within-platform variation of UserBase and UserBaseGrowthRate, while the platform-separated analysis displays developers’ entry pattern to a particular platform along with the platform’s growth path. The positive coefficients of UserBase and UserBaseGrowthRate in the platform-pooled model suggest that developers are more willing to choose a mobile platform with a larger user base and more rapid growth speed. However, developers’ entry time to a particular platform may not tightly relate to these factors, as suggested by the platform-separated model. A possible reason for the negative coefficients of iOS and Android’s UserBase in Table 5 might be developers’ confidence and forward looking in the growth of these platforms in future. In contrast, developers are willing to enter BlackBerry only when they observe a large size of user base. Thus, the growth rate of user base on iOS and Android seems to be not very important to influence potential entrants’ decision.
The counterintuitive signs of BlackBerry and WinPhone’s UserBaseGrowthRate might be attributed to the user base data we have. As we used net user base which accounts for users’ switching behaviour, user bases of both BlackBerry and WinPhone decrease all the time in our dataset. The data shows that new developers’ entry remains on a normal level in spite of the drop of net user base. Actually, the number of new users is the preferred approach to measure the growth of user base in a platform since developers are more concerned about the new device adopters when they make entry decision.
Regarding the influence of existing developers on new entrants, iOS, Android and WinPhone display an inverted U-shaped relationship, consistent with H3. Non-linear effect has not been found for BlackBerry. Furthermore, we can calculate entry peaks according to the coefficients. On average, the
Twenty Second European Conference on Information Systems, Tel Aviv 2014 12 entry peak may happen at the time when Developers equals 31,076 (i.e., 67.372/ (2*1.084)*1k), 9,485 (i.e., 67.516/ (2*3.559)*1k), 1,608 (i.e., 111.925/ (2*34.801)*1k) for iOS, Android and WinPhone, respectively. The significant coefficients of Incumbents are in the opposite direction unlike what we hypothesized (i.e., H4). A possible reason is that our measurement of established incumbents is based on Mobilewalla’s developer ranking, which is highly correlated with the performance of developers’ apps. Categories with more well-performed apps are likely to attract a larger number of consumers and thus new entrants prefer to join such a market. The coefficients of PriceLevel in all four platforms are significant and negative, supporting H5, while we did not observe this result in the pooled model. The reason might be that each platform has its own pricing plan because they address different customer segments. For example, BlackBerry primarily targets the enterprise market and is more for business users. Therefore, app prices on BlackBerry usually are higher than those on other platforms. These confounding effects might explain the insignificant coefficient in the pooled model.
In addition, the coefficients of cross-platform factors reveal interesting patterns. Most coefficients of contemporary new entry on competing platforms are insignificant, except for the impacts on WinPhone. Furthermore, existing apps in competing platform-categories do have influence on new entry. Majority of the coefficients are positive, suggesting that the whole mobile app industry is expanding. The flourishing development of one platform encourages other platforms’ expansion. Among the four platforms, the app market of WinPhone bears more influence from its competing platforms, which might be caused by its infancy. Since the marketplace of WinPhone was opened in late 2010, developers still kept a wait-and-see attitude to this platform during our observation period. The development of other platforms heavily influenced developers’ entry decision to WinPhone platform.
5
Discussion and Conclusion
5.1 Findings and Discussion
This study aims to uncover the factors that influence new developers’ entry to mobile app platform-categories. Specifically, we focused on INE between software and hardware sides and DNE between existing and new developers. We have used a pooled model that includes information from the four dominating platforms to understand developers’ entry decision. As these platforms may influence each other simultaneously, a simultaneous equation system that models each platform separately but accounts for cross-platform effects has also been constructed. Our results reveal interesting patterns on developers’ entry decisions.
The platform-pooled model shows strong positive INE of user base on developer entry. Developer entrants prefer platforms with a larger user base and higher growth rate. Some differences have been observed in the platform-separated analysis. Platform-separated analysis is based on a given platform, thus the resultant coefficients uncover developers’ entry pattern along with the platform growth. This pattern varies with platforms. For the early-moving platforms (e.g., iOS and Android), developers are more confident of the platform growth and willing to enter even when the user base is small. However, for the platforms (e.g., BlackBerry) which adopted mobile app store strategy later, developers’ entry decision is significantly influenced by the size of user base. The pooled model and platform-separated models generally reach the same conclusion about DNE between new and existing developers. An inverted-U relationship has been found between existing developers and new developers’ entry. At the early stage, developers incline to mimic their counterparts’ action to eliminate the negative effects brought by the uncertainty of the new market. With the accumulation of existing developers, this DNE later becomes negative, resulting in an inverted U-shape relationship.
As an explorative study, we also investigated non-network effects brought by two important variables, namely the number of established incumbents and price level of the apps in platform-categories. Different from our expectation, established incumbents have positive impact on developers’ entry. A
Twenty Second European Conference on Information Systems, Tel Aviv 2014 13 possible trigger for this finding might be the inappropriate operationalization of the variable. We will look for better information source to measure this variable in the future. For price level, the platform-separated analysis finds that within a platform, developers are more likely to join categories with a lower price level.
5.2 Theoretical and Practical Implications
This study contributes to prior literature in three ways. (1) In spite of the popularity of the mobile app industry, app developers are still an under-researched group (Bergvall-Kåreborn & Howcroft, 2011). Most existing knowledge about them comes from qualitative research. This study enriches the literature on mobile app industry by quantitatively analyzing developers’ entry behaviour with secondary data. Although a substantial proportion of mobile developers are amateur indie developers, they still behave rationally in a way of risk aversion and competition avoidance as predicted by our hypotheses. (2) Previous empirical studies on two-sided markets generally simplify the software side and seldom discuss DNE among developers. Nevertheless, this research accounts for INE between hardware and software sides as well as DNE among developers. We documented significant effects of both INE and DNE on new developers’ entry. This demonstrates the need to control for both types of network externalities in mobile app markets. (3) Furthermore, we found that DNE among developers varies with the growth of platform rather than a unidirectional relationship. Thus, the specification of non-linear direct network externality in certain type of markets may be more appropriate.
Our research also provides valuable implications for practitioners in the mobile app industry. Platform owners would like to attract more developers to their own platform to increase consumers’ valuation of their products. However, potential entrants may be deterred by the large amount of uncertainty of the marketplace at the initial phase. It is better for platform owners to provide subsidies or priorities to incentivize early entry. Even in the middle course, platform owners still can strategically arrange their promotion or new product release timetable by understanding developers’ entry curve. Currently, app stores do not have strict quality control after app release, resulting in a super crowded market. Users cannot find ideal apps easily and potential entrants are deterred by the super crowds. Thus, platform owners can consider only keeping existing apps which are above average quality to relieve new developers’ aversion to competition. For developers, they can compare price levels of categories to roughly estimate the sizes of potential users. By predicting the peak time and the growth point where the platform-category currently is at, potential entrants can forecast their counterparts’ actions and optimize their entry decisions. Though our research context is mobile app markets, the findings are applicable to most platform-based commerce environments as well, such as eBay and Taobao.
5.3
Limitations and Future Work
This study does not come without limitations. First of all, the hardware side plays a critical role in this two-sided market. Besides the app sales data, handling the chicken-and-egg paradox is pivotal because the positive feedback loop between two sides brings endogeneity issues. Given the lack of detailed data on the hardware side, we cannot model two sides simultaneously. Future research could incorporate more hardware relevant factors to exogenously determine the user base. Second, though platform-separated analysis does provide insights about developers’ entry behaviour, it does not control for developers’ platform choice simultaneously. One solution to obtain more accurate insights about both platform choice and entry timing is to use multilevel models. Third, we do not have information on in-app-purchase, which makes us unable to analyze developers’ motivation to release apps. Future study can incorporate this information to better understand developers’ entry decision. Fourth, as data limitation, we do not know developers’ demographics or entire publishing history over platforms. Future research with such information may generate more insights about individual developers. Finally, this study treats the four mobile app platforms equally, but in reality, they are largely differentiated from each other. Platform-specific studies may reveal more interesting findings.
Twenty Second European Conference on Information Systems, Tel Aviv 2014 14
References
Apple. (2013). Apple’s App Store Marks Historic 50 Billionth Download Retrieved November 30, 2013, from http://www.apple.com/pr/library/2013/05/16Apples-App-Store-Marks-Historic-50-Billionth-Download.html
Armstrong, M. (2006). Competition in Two-Sided Markets. The RAND Journal of Economics, 37(3), 668-691.
Bain, J. (1956). Barriers to Competition. Cambridge: Massachusetts.
Bakos, Y., & Brynjolfsson, E. (2001). Aggregation and Disaggregation of Information Goods: Implications for Bundling, Site Licensing, and Micropayment Systems Lectures in E-Commerce (pp. 103-122). Vienna: Springer.
Basu, A., Mazumdar, T., & Raj, S. (2003). Indirect Network Externality Effects on Product Attributes. Marketing Science, 22(2), 209-221.
Bayus, B. L., Kang, W., & Agarwal, R. (2007). Creating Growth in New Markets: A Simultaneous Model of Firm Entry and Price. Journal of Product Innovation Management, 24(2), 139-155. Belleflamme, P., & Toulemonde, E. (2009). Negative Intra-Group Externalities in Two-Sided Markets.
International Economic Review, 50(1), 245-272.
Bergvall-Kåreborn, B., & Howcroft, D. (2011). Mobile Applications Development on Apple and Google Platforms. Communications of the Association for Information Systems, 29(1), 565-580.
Brynjolfsson, E., & Kemerer, C. F. (1996). Network Externalities in Microcomputer Software: An Econometric Analysis of the Spreadsheet Market. Management Science, 42(12), 1627-1647. Carpenter, G. S., & Nakamoto, K. (1989). Consumer Preference Formation and Pioneering Advantage.
Journal of Marketing Research, 26(3), 285-298.
Clements, M. T., & Ohashi, H. (2005). Indirect Network Effects and the Product Cycle: Video Games in the Us, 1994-2002. Journal of Industrial Economics, 54(4), 515-542.
Cockburn, I. M., & MacGarvie, M. J. (2011). Entry and Patenting in the Software Industry. Management Science, 57(5), 915-933
Datta, A., Dutta, K., Kajanan, S., & Pervin, N. (2012). Mobilewalla: A Mobile Application Search Engine Mobile Computing, Applications, and Services (pp. 172-187): Springer.
Debruyne, M., & Reibstein, D. J. (2005). Competitor See, Competitor Do: Incumbent Entry in New Market Niches. Marketing Science, 24(1), 55-66.
Garg, R., & Telang, R. (2013). Inferring App Demand from Publicly Available Data. MIS Quarterly, 37(4), 1253-1264.
Gatignon, H. (2010). Commentary on Jacob Goldenberg, Barak Libai and Eitan Muller's. International Journal of Research in Marketing, 27(1), 16-17.
Goldenberg, J., Libai, B., & Muller, E. (2010). The Chilling Effects of Network Externalities. International Journal of Research in Marketing, 27(1), 4-15.
Gort, M., & Klepper, S. (1982). Time Paths in the Diffusion of Product Innovations. The Economic Journal, 92(367), 630-653.
Twenty Second European Conference on Information Systems, Tel Aviv 2014 15 IDC. (2013). Android and Ios Combine for 91.1% of the Worldwide Smartphone Os Market in 4q12
and 87.6% for the Year, According to Idc Retrieved March 14, 2014, from
http://www.idc.com/getdoc.jsp?containerId=prUS23946013
Katz, M. L., & Shapiro, C. (1985). Network Externalities, Competition, and Compatibility. American Economic Review, 75(3), 424-440.
Katz, M. L., & Shapiro, C. (1992). Product Introduction with Network Externalities. The Journal of Industrial Economics, 40(1), 55-83.
Kauffman, R. J., McAndrews, J., & Wang, Y. M. (2000). Opening the “Black Box” of Network Externalities in Network Adoption. Information Systems Research, 11(1), 61-82.
Kerin, R. A., Varadarajan, P. R., & Peterson, R. A. (1992). First-Mover Advantage: A Synthesis, Conceptual Framework, and Research Propositions. Journal of Marketing, 56(4), 33-52. Lee, G., & Raghu, T. (2011). Product Portfolio and Mobile Apps Success: Evidence from App Store
Market. Paper presented at the 17th Americas Conference on Information Systems, Detroit, Michigan.
Nair, H., Chintagunta, P., & Dubé, J. P. (2004). Empirical Analysis of Indirect Network Effects in the Market for Personal Digital Assistants. Quantitative Marketing and Economics, 2(1), 23-58. PortioResearch. (2013). Mobile Applications Futures 2013-2017 Retrieved November 30, 2013, from
http://www.portioresearch.com/en/major-reports/current-portfolio/mobile-applications-futures-2013-2017.aspx
Qiu, Y., Gopal, A., & Hann, I. H. (2011). Synthesizing Professional and Market Logics: A Study of Independent Ios App Entrepreneurs. Paper presented at the the 32nd International Conference on Information Systems, Shanghai, China.
Robinson, W. T., Kalyanaram, G., & Urban, G. L. (1994). First-Mover Advantages from Pioneering New Markets: A Survey of Empirical Evidence. Review of Industrial Organization, 9(1), 1-23. Rochet, J. C., & Tirole, J. (2003). Platform Competition in Two-Sided Markets. Journal of the
European Economic Association, 1(4), 990-1029.
Rust, R. T. (2010). Network Externalities-Not Cool? A Comment on "the Chilling Effects of Network Externalities". International Journal of Research in Marketing, 27(1), 18-19.
Schmalensee, R., & Evans, D. S. (2007). The Industrial Organization of Markets with Two-Sided Platforms. Competition Policy International, 3(1).
Seamans, R. C. (2012). Fighting City Hall: Entry Deterrence and Technology Upgrades in Cable TV Markets. Management Science, 58(3), 461-475.
Shankar, V., & Bayus, B. L. (2003). Network Effects and Competition: An Empirical Analysis of the Home Video Game Industry. Strategic Management Journal, 24(4), 375-384.
Simonsohn, U. (2010). Ebay's Crowded Evenings: Competition Neglect in Market Entry Decisions. Management Science, 56(7), 1060-1073.
Srinivasan, R., Lilien, G. L., & Rangaswamy, A. (2004). First in, First Out? The Surprising Effects of Network Externalities on Pioneer Survival. Journal of Marketing, 68(1), 41-58.
Wooldridge, J. M. (2009). Introductory Econometrics: A Modern Approach: South-Western Pub. Wu, B., & Knott, A. M. (2006). Entrepreneurial Risk and Market Entry. Management Science, 52(9),