ACS CAN Examination of Cancer Drug Coverage and
Transparency in the Health Insurance Marketplaces
November 18, 2015
Executive Summary
In 2014, the American Cancer Society Cancer Action Network (ACS CAN) analyzed coverage of cancer drugs in the health insurance marketplaces created by the Affordable Care Act (ACA) and found that transparency of coverage and cost-sharing requirements were insufficient to allow cancer patients to choose the best plan for their needs. In this updated analysis, which incorporates 2015 data from marketplaces in California, Florida, Illinois, North Carolina, Texas, and Washington, we found that coverage transparency has improved somewhat since 2014, but significant barriers remain for cancer patients. In particular, we found the following:
• Coverage of newer oral chemotherapy medications was limited in some states in 2015;
• Coverage for intravenous medications, while noted more often than in 2014, was still unclear in most plans;
• Cost-sharing structures presented in plan formularies did not match those presented on marketplace websites nearly half of the time;
• Plans continue to place most or all oral chemotherapy medications on the highest cost-sharing tier, presenting transparency and cost barriers for patients; and,
• Nearly half of plans placed a generic oral chemotherapy drug on the highest cost-sharing tier, which may constitute a discriminatory cost-sharing design.
To address these issues, we provide nine recommendations to states and the U.S. Department of Health and Human Services to increase transparency of coverage and cost-sharing, ensure adequate access to medically necessary drugs via an exceptions process, make cost-sharing more predictable and affordable for patients, and monitor the marketplace for evidence of discrimination against persons with high-cost conditions such as cancer.
Introduction
The ACA expands health insurance coverage primarily through increased access to Medicaid and tax credits to purchase private health insurance through the health insurance marketplaces. In order to ensure adequate insurance coverage and help consumers compare among private health insurance plans offered in the individual market, the ACA requires coverage of ten essential health benefits, categorizes plans into metal tiers by actuarial value, requires modified community rating, and requires states or HHS to establish marketplaces to allow consumers to easily compare among and choose a health plan. However, researchers and advocates have identified the transparency of marketplace plan
2
coverage provisions as a significant barrier for consumers.1,2,3 In addition, rules defining essential health benefits left a great deal of flexibility for insurers in prescription drug coverage, leading to concerns that some plans may not provide adequate coverage for certain diseases.4
In 2015, an estimated 1.7 million Americans will be diagnosed with cancer, and approximately
14.5 million Americans are cancer survivors.5 In 2011, $88.7 billion was spent on direct medical costs for cancer treatment in the United States, nearly $10 billion of which was spent on prescription
medications.5 Increasingly, prescription drugs to treat cancer are targeted to specific molecules involved in the growth or spread of particular cancers, meaning drugs are not necessarily interchangeable, and most of these targeted medications are not yet available in generic form.6
In 2014, ACS CAN analyzed coverage of cancer drugs in marketplace plans and found that transparency of coverage, particularly for intravenous medications, as well as transparency of cost-sharing
requirements, was insufficient to allow cancer patients to choose the best plan for their needs.1 This report updates the 2014 analysis, considering transparency, coverage, and cost of cancer drugs in marketplace plans in 2015, and is focused on the following research questions:
• Can consumers easily compare marketplace plans based on their coverage of cancer drugs?
• How often are specific cancer drugs excluded from coverage, and how often are coverage limitations such as prior authorization and step therapy used?
• Can consumers easily compare marketplace plans based on their likely out-of-pocket spending for cancer drugs?
Background
The ACA requires health plans in the individual and small group markets to cover 10 essential health benefits, including prescription drugs. Essential health benefits are set at the state level using a benchmark plan as reference. All plans in a given state must cover the same number of drugs in each United States Pharmacopeia (USP) category and class as the selected benchmark plan, but in no case can a plan cover fewer than one drug per category and class.7 Cancer drugs are included in the category of “antineoplastic agents”, for which there are several subclasses.
The prescription drug benchmarks for the 2015 marketplace coverage year were chosen from health plans available in each state in 2013. HHS has announced that these benchmarks will be updated for the 2017 coverage year.8 In addition, beginning in the 2017 coverage year, HHS will require that each health plan’s Pharmacy and Therapeutics (P&T) committee review the prescription drug formulary to ensure coverage of a range of drugs across categories and classes to treat all disease states, to ensure the formulary does not discourage enrollment by particular groups, and to ensure access to drugs included in treatment guidelines.9 In addition, beginning in plan year 2016, health plans must comply with additional prescription drug formulary transparency requirements, including that drug formularies must list all drugs covered by the plan, be accessible to enrollees and potential enrollees, show tiering and limitations, and clearly indicate the plans to which the formulary applies.9
3
In 2014, ACS CAN found significant gaps in the transparency of prescription drug coverage in the marketplaces, as well as high cost-sharing for cancer drugs.1 Research on HIV medication coverage has found that some plans place all HIV medications, including generics, on the highest cost-sharing tier, potentially as a way to discourage enrollment by HIV-positive patients.10 Other researchers have shown similar patterns for other complex conditions, including cancer.11 Due to concerns about possible
discrimination through prescription drug benefits, as well as the significant variation in prescription drug coverage allowed under the essential health benefit rules and previously-identified transparency gaps, we analyzed transparency, coverage, and cost of cancer drugs in 2015 marketplace plans.
Methods
We examined prescription drug formularies for all silver plans in six states: California, Florida, Illinois, North Carolina, Texas, and Washington. Taken together, these six states accounted for 46 percent of all marketplace enrollees as of June 30, 2015.12 We chose these states for geographic diversity, overall size, and number of expected cancer diagnoses in 2015,5 as well as to achieve a mix of state-based and federally-facilitated marketplaces. In addition, two of these states have been considering legislation to improve the transparency of prescription drug formularies or cost-sharing (Illinois and Washington), and one state recently passed such legislation (California). ACS CAN had previously investigated coverage of cancer drugs in 2014 marketplace plans in three of these states – California, Florida, and Texas.1 In these three states, we are able to compare trends over time, while the addition of three new states allowed us to look at one state with a highly successful Marketplace (North Carolina) and two states considering legislation to improve prescription drug transparency (Illinois and Washington).
We collected data on transparency, coverage, and cost-sharing for 22 cancer drugs from 66 silver plan formularies in these six states using formulary links provided by the marketplaces.13 The transparency of prescription drug coverage was assessed by the ease of access to the formulary, including number of clicks from the marketplace-provided link to the formulary; whether the cost-sharing tiers listed on the formulary matched the cost-sharing structure presented on the marketplace; whether formularies were searchable; and whether they included any out-of-pocket cost estimates. We also assessed coverage of the 22 cancer drugs on each formulary, including placement on cost-sharing tiers and any limitations on coverage such as prior authorization, quantity limits, and step therapy. For active ingredients available as both a brand and generic medication, we included the cost-sharing tier for the generic, where
covered, in our summary estimates. Finally, we determined the cost-sharing provisions for cancer drugs, including the number of drugs covered on the highest cost-sharing tier, and whether enrollees were required to pay coinsurance, or a percentage of the cost of the drug, rather than a flat copay for particular cost-sharing tiers.
We selected 22 cancer drugs for investigation from several classes of anti-cancer medications on the United States Pharmacopeia (USP), and four of our selected drugs are available exclusively
intravenously. A list of these drugs and their route of administration is available in Table 2.
We selected these drugs to provide coverage for a wide range of cancers, and to investigate a mix of oral and IV drugs, as well as newly approved and older drugs. In addition, we focused primarily on two
4
classes of anti-cancer drugs: molecular target inhibitors and monoclonal antibodies. The number of available molecular target inhibitors has been increasing rapidly, making the 2013 benchmarks potentially obsolete for this class. Monoclonal antibodies were chosen because 21 state benchmarks covered no drugs in this class, likely because all monoclonal antibodies are administered
intraveneously.1 In general, intravenous drugs frequently are covered under a health plan’s medical, rather than prescription drug, benefit, meaning they frequently are not listed on prescription drug formularies. Therefore, the absence of an intravenous drug on the prescription drug formulary does not necessarily indicate a lack of coverage. Overall, 20 of the 22 drugs we investigated were the same as in our 2014 analysis.1
Results
Availability of links to prescription drug formularies has improved since 2014, but transparency issues remain
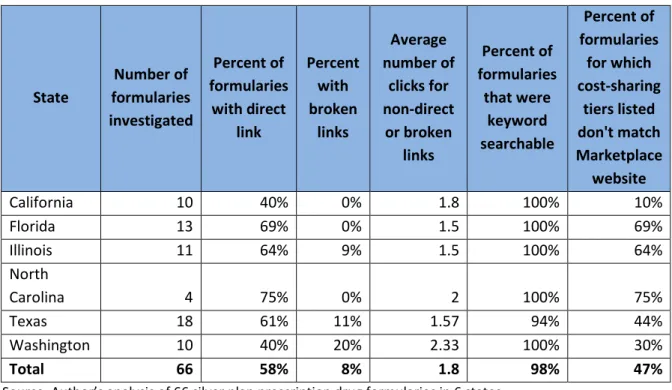
Among the six states included in our analysis, all marketplaces provided links to prescription drug formularies, though not all were directly available on the plan comparison website. California, unlike in 2014,1 now provides links to formularies for all CoveredCalifornia insurers, but it does so through a separate webpage13 — no links are provided on the “plan details” page. Similarly, Washington provides a separate webpage with links to formularies for all Washington HealthPlanFinder insurers,13 but no links are provided on the “plan summary” page. Healthcare.gov, the marketplace for Florida, Illinois, North Carolina, and Texas, provides links to formularies on the “plan details” page for each health plan.14 Among the links provided in all six states, 58 percent went directly to a prescription drug formulary (Table 1). Another 7.6 percent of links were broken or blank, but these were unevenly spread across states. California, Florida, and North Carolina had no broken or missing links, while 9 percent of links were broken or missing in Illinois, 11 percent in Texas, and 20 percent in Washington. For insurers that did not provide a direct link or provided a broken link or no link at all, the formulary was an average of 1.8 clicks away from the link provided (or from the insurer homepage, in the case of broken or missing links).
5
Table 1: Prescription Drug Formulary Transparency, by State
State Number of formularies investigated Percent of formularies with direct link Percent with broken links Average number of clicks for non-direct or broken links Percent of formularies that were keyword searchable Percent of formularies for which cost-sharing tiers listed don't match Marketplace website California 10 40% 0% 1.8 100% 10% Florida 13 69% 0% 1.5 100% 69% Illinois 11 64% 9% 1.5 100% 64% North Carolina 4 75% 0% 2 100% 75% Texas 18 61% 11% 1.57 94% 44% Washington 10 40% 20% 2.33 100% 30% Total 66 58% 8% 1.8 98% 47%
Source: Author’s analysis of 66 silver plan prescription drug formularies in 6 states.
Notes: Number of clicks were counted from link provided by the marketplace or, if no link or a broken link was provided, from the insurer’s home page.
None of the six marketplaces provided an integrated tool to search for plans by coverage of particular prescription drugs. CoveredCalifornia does provide an out-of-pocket cost calculator tool including estimated prescription drug use, but it does not allow input of specific prescription drugs. HHS has announced that an out-of-pocket cost calculator tool will be available on healthcare.gov in the 2016 plan year, but the details of the tool are not yet clear.15
Once formularies are found, patients must be able to search for their prescription drugs and match the coverage tier listed on the formulary back to cost-sharing information listed on the marketplace website or in the Summary of Benefits and Coverage. Among the 66 formularies we investigated, 98 percent were searchable. However, nearly half of formularies had sharing tiers that did not match the cost-sharing information provided on the marketplace website (47 percent). For the most part, this occurred because healthcare.gov and the Washington HealthPlanFinder provided cost-sharing information for only four prescription drug tiers, while many plans use five or more tiers in their prescription drug benefit design. For example, in North Carolina, three of the four prescription drug formularies had five tiers, while healthcare.gov listed only four tiers, leading to a mismatch for 75 percent of formularies. Some plans using four or fewer tiers also had mismatches between the number of tiers listed on the formulary and the number shown on the marketplace website. For example, there are two Assurant Health formularies in use in Illinois, Florida, and Texas, one with two tiers and one with three tiers, and neither matched the cost-sharing shown on healthcare.gov. Healthcare.gov showed no cost-sharing after deductible for all drugs for the Assurant Health plans with a link to a two-tier formulary and four cost-sharing tiers for the Assurant Health plans with the link to the three-tier formulary.
6
Finally, formularies for Molina Healthcare in California and Florida provided an out-of-pocket cost estimate for each prescription drug through the formulary search tool. This type of tool, which was not seen in our 2014 analysis,1 could greatly benefit consumers if adopted more widely.
Many cancer drugs are covered by all or most plans, but coverage of IV drugs remains unclear and newer cancer medications appear to be heavily excluded from formularies in some states
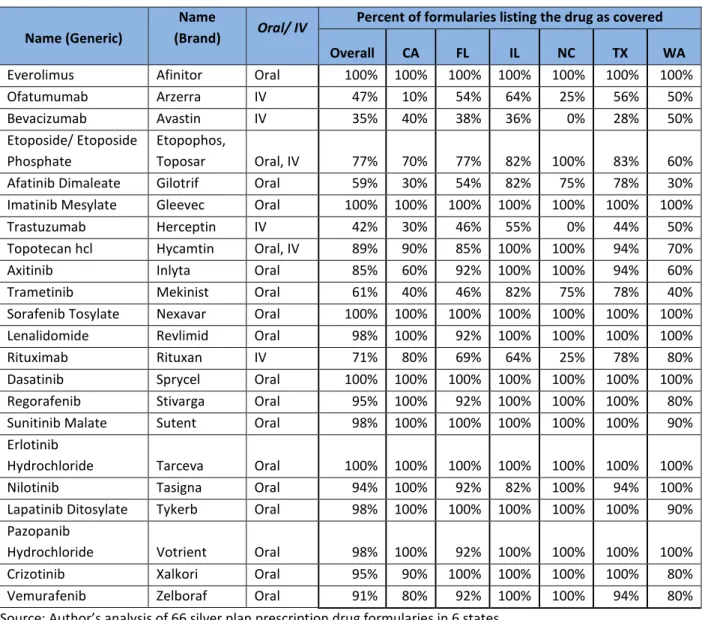
Across all six states, 15 of the 18 oral chemotherapy drugs studied were covered by more than 85 percent of formularies (Table 2). Five oral chemotherapy drugs were covered by all formularies analyzed, and an additional eight oral chemotherapy drugs were covered by 90 percent or more of formularies. Three oral chemotherapy drugs, Etoposide (a generic), Gilotrif, and Mekinist (both brand name only drugs) were covered by significantly fewer plans. Gilotrif had the lowest coverage rate of all of the oral chemotherapy drugs, covered by only 59 percent of plans. This drug was approved in late 2013 and does not have a generic alternative, and it is unclear whether the lack of coverage is due to its relative newness on the market, the availability of alternative treatments, or cost. The same is true of Mekinist, which was also approved in 2013. Etoposide is available in both oral (Etoposide) and IV (Etoposide Phosphate) forms, and is available as both a brand name drug (Etopophos or Toposar) and a generic. It is unclear why this drug was significantly more likely to be excluded from formularies, though it may be due to the option to cover either oral or IV formulations. In addition, we note that there is significant variation by state in coverage of these three drugs, ranging from 30 percent of formularies for Gilotrif in Washington to 100 percent of formularies for Etoposide in North Carolina.
7
Table 2: Coverage of cancer drugs in marketplace plan formularies, overall and by state
Name (Generic)
Name
(Brand) Oral/ IV
Percent of formularies listing the drug as covered Overall CA FL IL NC TX WA
Everolimus Afinitor Oral 100% 100% 100% 100% 100% 100% 100% Ofatumumab Arzerra IV 47% 10% 54% 64% 25% 56% 50% Bevacizumab Avastin IV 35% 40% 38% 36% 0% 28% 50% Etoposide/ Etoposide Phosphate Etopophos, Toposar Oral, IV 77% 70% 77% 82% 100% 83% 60% Afatinib Dimaleate Gilotrif Oral 59% 30% 54% 82% 75% 78% 30% Imatinib Mesylate Gleevec Oral 100% 100% 100% 100% 100% 100% 100% Trastuzumab Herceptin IV 42% 30% 46% 55% 0% 44% 50% Topotecan hcl Hycamtin Oral, IV 89% 90% 85% 100% 100% 94% 70% Axitinib Inlyta Oral 85% 60% 92% 100% 100% 94% 60% Trametinib Mekinist Oral 61% 40% 46% 82% 75% 78% 40% Sorafenib Tosylate Nexavar Oral 100% 100% 100% 100% 100% 100% 100% Lenalidomide Revlimid Oral 98% 100% 92% 100% 100% 100% 100% Rituximab Rituxan IV 71% 80% 69% 64% 25% 78% 80% Dasatinib Sprycel Oral 100% 100% 100% 100% 100% 100% 100% Regorafenib Stivarga Oral 95% 100% 92% 100% 100% 100% 80% Sunitinib Malate Sutent Oral 98% 100% 100% 100% 100% 100% 90% Erlotinib
Hydrochloride Tarceva Oral 100% 100% 100% 100% 100% 100% 100% Nilotinib Tasigna Oral 94% 100% 92% 82% 100% 94% 100% Lapatinib Ditosylate Tykerb Oral 98% 100% 100% 100% 100% 100% 90% Pazopanib
Hydrochloride Votrient Oral 98% 100% 92% 100% 100% 100% 100% Crizotinib Xalkori Oral 95% 90% 100% 100% 100% 100% 80% Vemurafenib Zelboraf Oral 91% 80% 92% 100% 100% 94% 80% Source: Author’s analysis of 66 silver plan prescription drug formularies in 6 states.
Notes: For drugs available in IV form, absence from the formulary does not necessarily mean the drug is not covered by the plan. It could instead mean the drug is covered under the medical benefit. However, most plans do not provide a list of medical benefit drugs.
In general, coverage for chemotherapy drugs administered intravenously is far less clear, as was the case in 2014.1 Of the four drugs available exclusively intravenously, coverage ranged from 71 percent of all formularies for Rituxan to 35 percent of all formularies for Avastin. In general, most formularies do not systematically list physician-administered IV drugs, making it difficult for patients using these drugs to choose an appropriate health plan for their needs. These drugs are often covered under the health plan’s medical benefits, rather than the pharmacy benefits. Only one issuer, Assurant Health, systematically listed drugs covered under the medical benefit on all formularies. We note that, in analysis of 2014 Marketplace plans, IV drugs were even less likely to be listed on formularies than in 2015, indicating some progress with respect to physician-administered medication transparency. For
8
example, the four IV drugs we analyzed were each listed on only 30 percent of Florida formularies in 2014,1 compared with 38 to 69 percent of Florida formularies in 2015.
Coverage limits are applied extensively, but their potential effect on patients is unclear Limits on coverage, such as prior authorization, step therapy, and quantity limits, were applied frequently to the cancer drugs we studied, and information on the specific nature of those limits was generally not available. Chemotherapy drugs are highly toxic, making prior authorization routine and a commonly understood practice for oncologists. Overall, nearly all formularies investigated required prior authorization (sometimes called prior review or prior notification) on multiple cancer drugs.
Relatively few formularies imposed step therapy requirements — meaning that one drug must be tried and shown ineffective before a second drug will be covered by the plan — on cancer drugs. Step therapy is often used to manage plan costs, and a lower-cost drug must be tried first before moving on to a higher-cost drug. Only UnitedHealthcare and Assurant Health required step therapy for any cancer drugs, with UnitedHealthcare requiring it for one drug in Illinois and North Carolina and Assurant Health requiring it for three drugs in Illinois.
Finally, many formularies have quantity limits on cancer drugs, but few clarify the specific number of refills or specific dosages that make up these limits. While clinically-appropriate quantity limits,
particularly for toxic drugs like chemotherapy, likely do not represent a barrier to patients, requirements for more frequent refills (and associated cost-sharing) or quantity limits inconsistent with current on-label and off-on-label oncology practice could pose significant barriers to care. For example, in California, Texas, and Washington, a total of five small, local health plans16 placed quantity limits on several cancer drugs allowing only two 15-day refills per month during the first three months of treatment. The reasoning for these limits was not explained, and the formularies did not indicate whether copays or coinsurance must be paid for both refills in a given month.
Most cancer drugs are placed on the highest cost-sharing tier, often with significant coinsurance requirements
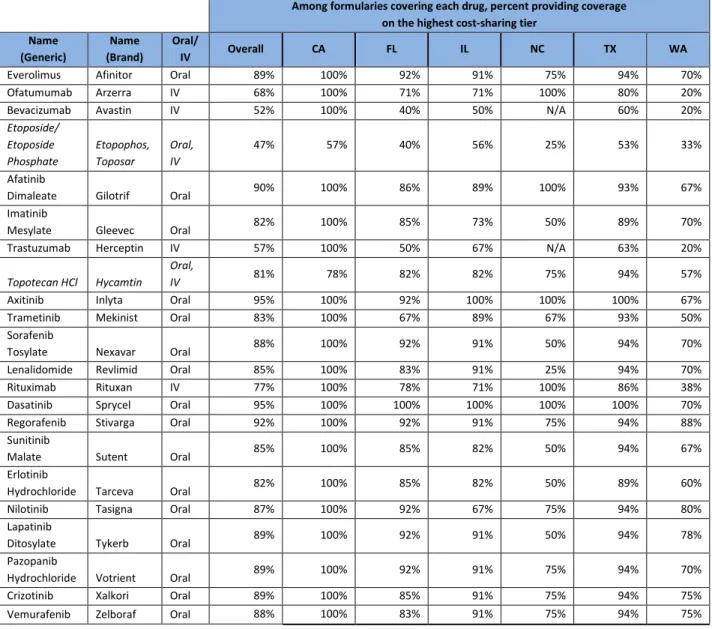
Of the 18 oral cancer drugs examined, 17 were placed on the highest cost-sharing tier by more than 80 percent of formularies (Table 3). Cost-sharing tiers were more variable for IV cancer drugs, primarily because few plans listed these drugs on formularies and several plans indicated they were covered under the medical benefit, which we did not count as the highest cost-sharing tier.
9
Table 3: Percent of formularies placing cancer drugs on highest cost-sharing tier, overall and by state
Among formularies covering each drug, percent providing coverage on the highest cost-sharing tier
Name (Generic) Name (Brand) Oral/ IV Overall CA FL IL NC TX WA
Everolimus Afinitor Oral 89% 100% 92% 91% 75% 94% 70% Ofatumumab Arzerra IV 68% 100% 71% 71% 100% 80% 20% Bevacizumab Avastin IV 52% 100% 40% 50% N/A 60% 20% Etoposide/ Etoposide Phosphate Etopophos, Toposar Oral, IV 47% 57% 40% 56% 25% 53% 33% Afatinib
Dimaleate Gilotrif Oral 90% 100% 86% 89% 100% 93% 67% Imatinib
Mesylate Gleevec Oral 82% 100% 85% 73% 50% 89% 70% Trastuzumab Herceptin IV 57% 100% 50% 67% N/A 63% 20%
Topotecan HCl Hycamtin Oral,
IV 81% 78% 82% 82% 75% 94% 57%
Axitinib Inlyta Oral 95% 100% 92% 100% 100% 100% 67% Trametinib Mekinist Oral 83% 100% 67% 89% 67% 93% 50% Sorafenib
Tosylate Nexavar Oral 88% 100% 92% 91% 50% 94% 70% Lenalidomide Revlimid Oral 85% 100% 83% 91% 25% 94% 70% Rituximab Rituxan IV 77% 100% 78% 71% 100% 86% 38% Dasatinib Sprycel Oral 95% 100% 100% 100% 100% 100% 70% Regorafenib Stivarga Oral 92% 100% 92% 91% 75% 94% 88% Sunitinib
Malate Sutent Oral 85% 100% 85% 82% 50% 94% 67% Erlotinib
Hydrochloride Tarceva Oral 82% 100% 85% 82% 50% 89% 60% Nilotinib Tasigna Oral 87% 100% 92% 67% 75% 94% 80% Lapatinib
Ditosylate Tykerb Oral 89% 100% 92% 91% 50% 94% 78% Pazopanib
Hydrochloride Votrient Oral 89% 100% 92% 91% 75% 94% 70% Crizotinib Xalkori Oral 89% 100% 85% 91% 75% 94% 75% Vemurafenib Zelboraf Oral 88% 100% 83% 91% 75% 94% 75%
Source: Author’s analysis of 66 silver plan prescription drug formularies in 6 states.
Notes: When both a generic and brand name were covered, coverage tier of the generic was included in the calculations above. This applies only to Etoposide and Topotecan HCl.
Even Etoposide, which is available as an oral generic, was placed on the highest cost-sharing tier in 47 percent of formularies. Prior research has argued that placing all medications, including generics, on the highest cost-sharing tier for HIV is evidence of insurers attempting to discourage potentially high-cost patients from enrolling, a phenomenon researchers call “adverse tiering.”10 The placement of all or nearly all cancer drugs on the highest cost-sharing tier, including generics, in many plans appears not to be designed to encourage use of cheaper or more effective alternatives, but to extract the maximum patient cost-sharing for all cancer drugs. However, we note that, unlike HIV, cancer treatment is often highly specialized to the unique genetics and site of tumors, and few generics are available. It is
10
therefore more difficult to determine whether tier placement of particular cancer drugs may amount to discrimination.
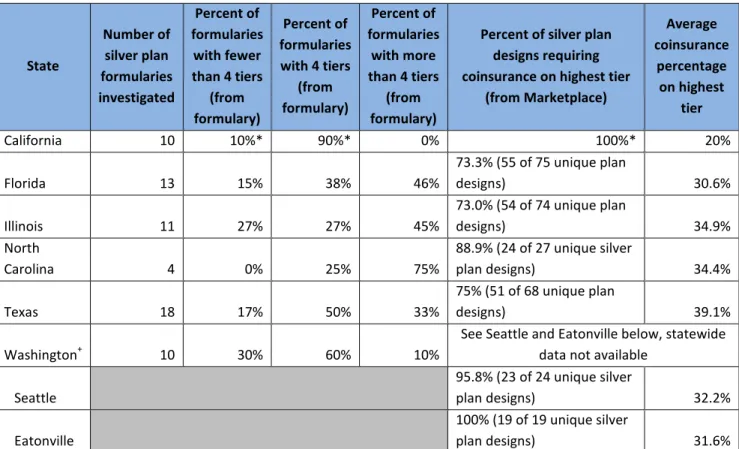
Across all six states, between 73 and 100 percent of silver plans use coinsurance on the highest cost-sharing tier (Table 4), meaning consumers using cancer drugs must pay a percentage of the cost of their drugs rather than a flat copayment. Coinsurance is not transparent for patients shopping for coverage, as no information on the negotiated drug price for particular insurers and pharmacies is available. In addition, coinsurance can be extremely expensive. For example, even after the deductible is met, a plan with 30 percent coinsurance after the deductible on a cancer drug that costs $5,000 per month would cost a cancer patient $1,500 at the pharmacy for each refill until the plan out-of-pocket maximum is reached.
Table 4: Silver plan cost-sharing designs, by state
State Number of silver plan formularies investigated Percent of formularies with fewer than 4 tiers (from formulary) Percent of formularies with 4 tiers (from formulary) Percent of formularies with more than 4 tiers (from formulary)
Percent of silver plan designs requiring coinsurance on highest tier
(from Marketplace) Average coinsurance percentage on highest tier California 10 10%* 90%* 0% 100%* 20% Florida 13 15% 38% 46% 73.3% (55 of 75 unique plan designs) 30.6% Illinois 11 27% 27% 45% 73.0% (54 of 74 unique plan designs) 34.9% North Carolina 4 0% 25% 75% 88.9% (24 of 27 unique silver plan designs) 34.4% Texas 18 17% 50% 33% 75% (51 of 68 unique plan designs) 39.1% Washington+ 10 30% 60% 10%
See Seattle and Eatonville below, statewide data not available
Seattle 95.8% (23 of 24 unique silver plan designs) 32.2% Eatonville 100% (19 of 19 unique silver plan designs) 31.6% Source: Author’s analysis of prescription drug formularies, as well as downloadable cost-sharing data for all silver plans available from healthcare.gov.13
Notes: *California requires a standardized silver plan design that uses 20 percent coinsurance for the specialty drugs. We note that the Kaiser Permanente formulary lists only 3 tiers, but the standardized 4 tiers appear to apply per CoveredCA.com. +Washington does not use standardized plan designs or provide a downloadable dataset of cost-sharing designs for all silver plans, so we analyzed all plans available in Seattle and Eatonville.
11
Discussion
Consumers attempting to choose a marketplace plan based on coverage of cancer drugs will likely find the process of finding formularies, verifying coverage, and determining cost-sharing burdensome in most cases, and impossible in other cases. In general, more than half of the formularies we investigated were available via direct links from marketplace websites, but CoveredCalifornia and Washington HealthPlanFinder should provide those links in the plan shopping feature, not on a separate webpage. Even those links that were not direct yielded formularies in relatively few clicks, on average. However, the formularies themselves often listed cost-sharing tiers that did not match to the cost-sharing provided on marketplace websites, and limitations on coverage, particularly quantity limits, were not well explained.
Overall, 15 of the 18 oral cancer drugs we studied were covered on 85 percent or more of formularies, indicating fairly broad coverage for these drugs. However, three oral cancer drugs were covered less frequently, two of which were approved recently (in 2013) and one of which is available in oral form as a generic. The reasons for these exclusions are unclear, but may be related to cost, availability of other treatment options, proximity to approval date, or availability as IV-administered drugs (for Etoposide, the generic). In addition, most formularies do not list physician-administered IV drugs, leaving
consumers who need those drugs completely in the dark as to coverage prior to enrollment.
Comparing plans based on likely out-of-pocket costs for drugs is the most significant challenge facing consumers. Many cancer drugs are extremely expensive, making plan cost-sharing provisions for prescription drugs a very important component of selecting the highest-value plan. Unfortunately, most plans place many, or even all, covered cancer drugs on the highest cost-sharing tier, which generally requires coinsurance rather than a flat copayment. Coinsurance does not provide consumers with any estimate of their out-of-pocket costs, as the negotiated drug price on which coinsurance is based is not shown. A few plans have helpfully begun providing an estimated out-of-pocket cost as part of their drug search tool, and this practice should be encouraged and emulated by marketplaces. Finally, nearly half of plans placed a drug that is available in generic, oral form on the highest cost-sharing tier, a practice that has been called discriminatory when used for drugs to treat HIV.17
Policy Recommendations
ACS CAN strongly recommends that states and HHS pursue the following policy changes to ensure adequate, timely, and affordable access to prescription drugs to treat cancer:
• Discriminatory tiering: HHS and states should monitor prescription drug benefits closely for evidence of discrimination against patients with high-cost conditions. This includes monitoring the cost-sharing for generic and brand drugs used to treat high-cost conditions such as cancer, as well as monitoring coverage limits on these drugs.
• Copays, not coinsurance: HHS and states should encourage or require the use of copayments for prescription drugs rather than coinsurance. Coinsurance requirements are not transparent and prevent patients from adequately comparing plans. As a first step, states and HHS should
12
require any plans using coinsurance to provide an estimate of out-of-pocket costs associated with all drugs covered using coinsurance.
• Direct links to formularies: HHS and state-based marketplaces should require insurers to provide direct links to searchable prescription drug formularies for each qualified health plan. HHS and states should have processes in place to verify the accuracy of the submitted links, and to allow insurers to provide updated links during the year if necessary.
• Cost-sharing transparency: All drugs listed in formularies should be clearly labeled with a cost-sharing tier that matches those displayed on the marketplace and in the Summary of Benefits and Coverage. HHS and state-based marketplaces should perform periodic checks to ensure that formulary links provided match prescription drug data submitted by qualified health plans and displayed on marketplace websites.
• Complete tiering information on marketplaces and in the Summary of Benefits and Coverage: Comparative information on healthcare.gov and state-based marketplaces, as well as the standard Summary of Benefits and Coverage forms used nationwide, should be expanded as needed to include cost-sharing information for plans with five or more tiers in their prescription drug benefit.
• Standardized cost-sharing: States and HHS should consider creating standardized cost-sharing for qualified health plans to improve transparency and reduce ability to design plans that discourage enrollment by high-cost consumers. Standardized cost-sharing should use copays, rather than coinsurance, for all prescription drugs.
• Exceptions process: HHS and states should strengthen and enforce the exceptions policy allowing enrollees access to non-covered drugs when medically necessary. The exceptions process could be strengthened through standardized cost-sharing requirements and
standardized exceptions request forms, and by requiring plans to cover currently-used drugs for those changing plans as they pursue the exceptions process.
• Coverage limits: Quantity limits should be clearly described in formulary documents and consistent with clinically appropriate use. Quantity limits should not be used to place additional administrative or cost-sharing burdens on enrollees, such as requiring refills every 15 days. For patients changing plans, any step therapy requirements should be waived if the patient is already being successfully treated on a particular medication.
• Consumer tools: Marketplaces should develop tools that allow consumers to search for plans that cover their prescription drugs. In addition, out-of-pocket cost calculators – including the one available on the healthcare.gov website in 2016 – should allow for input of consumers’ specific prescription drug utilization.
13
References
1 American Cancer Society Cancer Action Network. Cancer Drug Coverage in Health Insurance Marketplace Plans. Washington, DC: American Cancer Society Cancer Action Network; March 2014. Available at:
http://www.acscan.org/content/wp-content/uploads/2014/03/Marketplace_formularies_whitepaper.pdf.
2 Blumberg, LJ, Peters, R, Wengle, E, Arnesen, R. Physician Network Transparency: How Easy Is It for Consumers to Know What They are Buying? Washington, DC: Urban Institute; August 2014. Available at:
http://www.urban.org/sites/default/files/alfresco/publication-pdfs/1001746-Physician-Network-Transparency.PDF.
3 American Cancer Society Cancer Action Network. Cancer Care and the Adequacy of Provider Networks Under the ACA Marketplace Plans. Washington, DC: American Cancer Society Cancer Action Network; June 2014. Available at: http://www.acscan.org/content/wp-content/uploads/2014/07/ACS-CAN-Cancer-providers-and-QHP-Networks.pdf.
4 Clemans-Cope, L, Blumberg, LJ, Feder, J, Pollitz, K. Protecting High-Risk, High-Cost Patients: Essential Health Benefits, Actuarial Value, and Other Tools in the Affordable Care Act. Washington, DC: Urban Institute; June 2012. Available at: http://www.urban.org/sites/default/files/alfresco/publication- pdfs/412588-Protecting-High-Risk-High-Cost-Patients-quot-Essential-Health-Benefits-quot-quot-Actuarial-Value-quot-and-Other-Tools-in-the-Affordable-Care-Act.PDF.
5 American Cancer Society. Cancer Facts & Figures 2015. Atlanta, GA: American Cancer Society; 2015. Available at: http://www.cancer.org/acs/groups/content/@editorial/documents/document/acspc-044552.pdf.
6 American Cancer Society. Targeted Therapy. Atlanta, GA: American Cancer Society; July 2013. Available at: http://www.cancer.org/acs/groups/cid/documents/webcontent/003024-pdf.pdf.
7 Patient Protection and Affordable Care Act; Standards Related to Essential Health Benefits, Actuarial Value, and Accreditation, Final Rule. 78 Fed. Reg. 12834 (Feb. 25, 2013).
8 Center for Consumer Information & Insurance Oversight. Information on Essential Health Benefits (EHB) Benchmark Plans. Bethesda, MD: Centers for Medicare & Medicaid Services. Available from: https://www.cms.gov/CCIIO/Resources/Data-Resources/ehb.html
9 Patient Protection and Affordable Care Act; HHS Notice of Benefit and Payment Parameters for 2016, Final Rule. 80 Fed. Reg. 10750 (Feb. 27, 2015).
10 Jacobs, DB, Sommers, BD. Using Drugs to Discriminate – Adverse Selection in the Insurance Marketplace. N Engl J Med 2015; 372: 399-402.
11 Pearson, CF. Avalere Analysis: Exchange Benefit Designs Increasingly Place All Medications for Some Conditions on Specialty Drug Tier. Washington, DC: Avalere Health; February 2015. Available at: http://avalere.com/expertise/life-sciences/insights/avalere-analysis-exchange-benefit-designs-increasingly-place-all-medication.
12 Per CMS, 9.9 million overall, 4.6 million of which were in these six states. See Centers for Medicare and Medicaid Services. June 30, 2015 Effectuated Enrollment Snapshot. Baltimore, MD: Centers for Medicare and Medicaid Services; June 2015. Available at:
14
https://www.cms.gov/Newsroom/MediaReleaseDatabase/Fact-sheets/2015-Fact-sheets-items/2015-09-08.html.
13 Formulary links were gathered from the following sources: Centers for Medicare and Medicaid Services. 2015 Health Plan Information for Individuals and Families. Baltimore, MD; 2015. Available at: https://www.healthcare.gov/health-plan-information-2015/; Covered California. Prescription Drugs. Available at: http://www.coveredca.com/individuals-and-families/getting-covered/prescription-drugs/; and Washington HealthPlanFinder. How to Find Out if Your Medication Is on a Health Plan’s Formulary. January 29, 2015. Available at:
https://wahbexchange.org/files/6914/2257/5612/Consumer_Formulary_Chart_Final.pdf.
14 Centers for Medicare and Medicaid Services. See 2015 Health Insurance Plans and Prices. Baltimore, MD: Centers for Medicare and Medicaid Services. Available at: https://www.healthcare.gov/see-plans/. 15 Centers for Medicare and Medicaid Services. CMS Bulletin on Proposed Out-of-Pocket (OOP) Cost Comparison Tool for the Federally-facilitated Marketplaces (FFMs). Washington, DC: Centers for Medicare and Medicaid Services; June 4, 2015. Available at:
https://www.cms.gov/CCIIO/Resources/Regulations-and-Guidance/Downloads/OOP-Cost-Comparison-Tool-Bulletin_06-03-2015.pdf.
16 These plans include Columbia United in Washington; Valley Health Plan and Chinese Community Health Plan in California; and Community First and Community Health Choice in Texas.
17 See The AIDS Institute and The National Health Law Program. RE: Discriminatory Pharmacy Benefits Design in Selected Qualified Health Plans Offered in Florida. Tampa, FL: The AIDS Institute; May 29, 2014. Available at: http://www.healthlaw.org/publications/browse-all-publications/HHS-HIV-Complaint#.VfbRTFVVhBd.
15
Acknowledgements
This work was authored by Laura Skopec, Research Associate, Urban Institute, and funded by the American Cancer Society Cancer Action Network. The author gratefully acknowledges the input of Alissa Crispino, Anna Howard, Lisa Lacasse, Dana Malick, Kirsten Sloan, and Steven Weiss at the American Cancer Society Cancer Action Network, and Linda Blumberg at the Urban Institute. The findings and conclusions in this report are those of the author and do not necessarily represent the views of the Urban Institute, its trustees, or its funders.