Gene and Pathway-Based Analysis
-
Second Wave of Genome-wide Association Studies
-Gang Peng1, Li Luo2, H1oicheong Siu1, Yun Zhu1, Pengfei Hu1, Shengjun Hong1, Jinying Zhao3, Xiaodong Zhou4, John D Reveille4, Li Jin1, Christopher I. Amos5 , Momiao Xiong2.
1
School of Life Science, Fudan University, Shanghai 200433 , China
2
Human Genetics Center, University of Texas School of Public Health, Houston, TX 77225
3
Department of Medicine, Emory University of School of Medicine, Atlanta, GA 30306
4
Division of Rheumatology, Medical School, University of Texas Health Science Center at Houston, Houston, TX 77030.
5
Department of Epidemiology, University of Texas, M. D. Anderson Cancer Center, Houston, TX 77030.
Running Title: Gene and Pathway-based Analysis
Address for correspondence: Momiao Xiong, PhD
Human Genetics Center
University of Texas School of Public Health P.O. Box 20334, Houston, Texas 77225 (Phone): 713-500-9894
Despite great success of GWAS in identification of common genetic variants associated with complex diseases, the current GWAS have focused on single SNP analysis. However, single SNP analysis often identifies a number of the most significant SNPs that account for only a small proportion of the genetic variants and offers limited understanding of complex diseases. To overcome these limitations, we propose gene and pathway-based association analysis as a new paradigm for GWAS. As a proof of concept, we performed a
comprehensive gene and pathway-based association analysis for thirteen published GWAS. Our results showed that the proposed new paradigm for GWAS not only identified the genes that include significant SNPs found by single SNP analysis, but also detected new genes in which each single SNP conferred small disease risk, but their joint actions were implicated in the development of diseases. The results also demonstrated that the new paradigm for GWAS was able to identify biologically meaningful pathways associated with the diseases which were confirmed by gene-set rich analysis using gene expression data. Genome-wide association studies (GWAS) armed with efficient genotyping technologies are emerging as a major tool to identify disease susceptibility loci and are successful to detect association of a number of SNPs with complex diseases1-12. However, to only test for
association of single SNP is insufficient to dissect complex genetic structure of complex diseases. To extract biological insight from GWAS and to understand the principles underlying complex phenomena that take place on various biological pathways remain a major challenge. In a typical GWAS, hundreds of thousands of SNPs are genotyped for thousands of individuals. By
comparisons of differences in the DNA variations between the normal and affected individuals, the SNPs can be ordered according to their degrees of association. The common approach is to select dozens of the most significant SNPs in the list for further investigations. This approach
which takes only SNPs as basic units of association analysis has a few serious limitations. First, the single SNP showing significant association with complex diseases typically has only mild effects13. The common disease often arises from joint action of multiple loci within a gene or joint action of multiple genes within a pathway. Although each single SNP may confer small disease risk, their joint actions will play a significant role in the development of disease. If we only consider the most significant SNPs, the genetic variants that jointly have significant risk effects, but individually make only a small contribution, will be missed. Second, locus heterogeneity, in which alleles at different loci cause disease in different populations, will increase difficulty in replication of association of single marker14. The list of significant SNPs from several studies may rarely overlap. A gene, particularly, a pathway, consists of a group of interacting components acting in concert to perform specific biological tasks. Replication of association finding at the gene level or pathway level is much easier than replication at the SNP level. Third, attempting to understand and interpret a number of significant SNPs without any unifying biological theme can be challenging and demanding. SNPs and genes carry out their functions through intricate pathways of reactions and interaction. The function of many SNPs may not be well characterized, but function of genes and particularly pathways, on the contrary, are much better investigated. Therefore, the gene and pathway-based association analysis should allow to gain insight into the functional basis of the association and facilitate to unravel the mechanism of complex diseases.
To meet conceptual and technical challenge raised by GWAS and take full advantage of the huge opportunities provided by GWAS, a complementary approach to genome-wide search association of single SNP with the disease is gene and pathway association analysis. The gene and pathway-based association analysis is to take a gene or pathway as a basic unit of analysis.
The gene and pathway-based GWAS aim to simultaneously study association of a group of genetic variants in the same biological pathway14-16, which help us to holistically unravel complex genetic structure of common disease to gain insight into the biological processes and disease mechanism17.
The gene and pathway-based GWAS can be performed by extension of gene set enrichment analysis for gene expression data, which intend to identify subtle, but coordinated expression variations of gene groups18, to genome-wide association studies. This will open a new avenue for association analysis. However, simple application of gene set analysis methods for gene
expression data to GWAS may not work very well. The key difference between the gene
expression data and SNP data is that in expression data each gene is represented by one value of expression level of the gene, but in GWAS each gene is represented by a variable number of SNPs. The challenge facing us is how to represent a gene. Wang et al.19 proposed to choose the most significant SNP from each gene as a representative. As Casci20 pointed out “Given that each gene is associated with more than one SNP, how do you choose the most representative one? And how do you correct for the fact that longer genes have more SNPs than shorter ones?”. In other words, applying gene set enrichment analysis methods to GWAS requires developing gene-based association analysis that takes gene as a basic unit of association analysis. One promising approach is to combine P-values for correlated SNPs into an overall significance level to represent a gene and to combine P-values for the genes into an overall significance level to investigate association of a pathway with the disease21.
RESULTS
To investigate what should be the basic units for genome-wide association studies and to illustrate how to perform the gene and pathway-based genome-wide association analysis, we
examine the thirteen published GWAS (Supplementary Table 1 online), where WTCCC represents Wellcome Trust Case Control Consortium, NARAC, the North American Rheumatoid Arthritis Consortium, EIRA, the Swedish Epidemiological Investigation of
Rheumatoid Arthritis, DGI, Diabetes Genetics Initiative, AREDS, The Age-Related Eye Disease Study, CORIELL, Coriell Institute for Medical Research, and ten diseases: bipolar disorder (BD), coronary artery disease (CAD), Crohn's disease (CD), hypertension (HT), rheumatoid arthritis (RA), type 1 diabetes (T1D), type 2 diabetes (T2D), Parkinson's Disease (PD), Age-Related Eye Disease (AREDS) and Usuals. Since only P-values for testing association of single SNP (but not individual genotypes) were publically accessible, we used the statistical methods for combining independent P-values to perform gene and pathway-based GWAS (see Methods). The methods for combining dependent P-values require individual genotype
information and cannot be applied here. The number of typed cases and controls, the number of typed SNPs and genes, and P-values for ensuring genome-wide significance using Bonferroni correction for each study are listed in Supplementary Table 1.
In principle, there are three basic units for genome-wide association studies: SNP, gene and pathway. The current GWAS are limited to taking a SNP as the basic unit for association testing. Now we present the results where the basic unit of association tests is a gene or a pathway. The procedure for gene and pathway-based GWAS consist of two steps. The first step is to combine a set of P-values for SNPs in a gene, which is obtained from GWAS of single SNP, into an overall significance level of the gene. The second step is to combine a set of P-values for genes in a pathway into an overall P-value for the pathway. To combine P-values, one typically assumes that the P-values are independent and uniformly distributed under their null hypothesis. In this report, four combination tests: Fisher combination test, Sidak combination test, Simes’
combination test and a test based on false discovery rate were used (See methods). Since the SNPs within a gene may be in linkage disequilibrium, P-values of SNPs from the same gene are often not independent and hence independent assumption of combining P-values is violated. We used methods for combining independent P-values for the following reasons. First, the methods for combining dependent P-values require data with individual genotypes. However, in many cases, individual genotypes cannot be publically accessed. Second, errors that arise from
violation of independent assumption are not very high (We will present the results of comparison of methods combining independent P-values and combining dependent P-values elsewhere). Third, Q-Q plots for the four combining tests (Supplementary Figure 1) showed that the observed distribution of P-values of the combining tests (except for Fisher combination test) matches expectation for the majority of the data, but starts to depart from the null at 3.15 ×10⁻⁶ (gene) and 10−4 (pathway).
We obtained the combined P-values for each gene. Supplementary Table 2a and 2b summarized total number of significant genes, significant SNPs and significant SNPs which belong to
insignificant genes. Figures 1A and 1B plotted –log10 of the P-value of Fisher and Simes
combination tests for association of the gene with disease, respectively. The number of replicated SNPs and genes in the different studies or the number of significant SNPs and genes shared by several diseases was listed in Table 1. In Supplementary Tables S3-S15 we listed all significant genes with P-values ≤3.15×10⁻⁶ which were calculated by Fisher combination test or by the test based on the false discovery rate (FDR) for thirteen studies. In these tables we also included the number of typed SNPs within each significant gene and P-value of the most significant SNP in the gene. Supplementary Tables S16-S18 listed the significant SNPs and genes for PA, RA and T2D diseases shared by two independent studies. Three remarkable features emerge from these tables.
First, similar to SNPs, the gene can also be considered as a basic unit for association testing. These tables showed that except for the diseases RA and T1D, the number of significant SNPs in each study is very small, but the number of significant genes is quite large. From these tables we can find that the large proportion of significant genes even contains no single significant SNP. For example, in T2D study (WTCCC), the P-values of the best SNPs in the genes PPARG, JAZF1, TSPAN8 and THADA were 0.001205, 0.001681, 0.0000156, 0.01080, respectively, but the overall P-values of these genes were 2.87×10⁻⁵, 8.58×10−7,3.17×10−13, 1.80×10⁻⁵,respectively. Although initial single SNP analysis did not find any significant SNPs in these genes, the recent meta-analysis24 showed that the P-values of the best SNPs in these genes were 2.00×10⁻⁷, 5.00×10⁻¹⁴, 1.10×10⁻⁹ and 1.10×10⁻⁹, respectively. This demonstrated that the results of the gene-based association analysis were consistent with the results of meta-analysis. If we only conduct the single SNP association analysis, these significant genes might be missed due to low power of small sample sizes in the initial GWAS. Second, replication of association finding that results from gene-based approach in additional independent samples were much easier than that from single SNP association analysis. We examined association studies of three diseases: T2D, PA and RA, each with two independent studies. For T2D, no SNPs were replicated in two independent studies (WTCCC and DGI) after correction for multiple test by Bonferroni method. However, seven genes including genes TCF7L2 (transcription factor 7-like 2) and CDKAL1 (CDK5 regulatory subunit associated protein 1-like 1) were replicated (Supplementary Table S17). The gene TCF7L2 which has a marked effect on type 2 diabetes was widely replicated association in several studies 2,23. In single SNP association analysis, although strong association of CDKAL1 was reported from WTCCC (P=1.02×10⁻⁶) and from WTCCC/UKT2D2,3 (P=10−8), the original scan and follow up replication samples from DGI only support nominal association
(P=0.0024). In gene-based analysis, its strong association was observed from WTCCC (P < 10−20) and DGI (P=1.84×10⁻⁶) (Supplementary Table S17). Although the function of CDKAL1 is unknown, nominal association of the risk allele with reduced insulin secretion in controls was reported in DGI study (P=0.01)23. To explain why replication of the significant gene in
independent samples is much easier than replication of the significant SNP we presented Table 2 in which all SNPs with P-values < 0.05 in the genes were listed. Table 2 demonstrated that although few single SNP in the genes CDKAL1, TTLL5 and BTBD16 showed significant association in WTCCC study or DGI study, the joint effects of multiple SNPs with very mild effects made three genes to be strongly associated with the diseases in both studies. Third, the gene-based association analysis will more effectively identify the common genes that are shared within a disease group than the single SNP association analysis. Althoughthere is considerable heterogeneity among complex diseases, many diseases share common phenotypes, forming a group of diseases. In the studies which we examined here, CD+RA+T1D are autoimmune
diseases, and CAD+HT+T2D have metabolic and cardiovascular phenotypes in common. GWAS offer us opportunity to reveal the genetic variants that confer risk to more than one disease.
Supplementary Table 19 summarized the shared genes within the disease group based on the best SNP within the gene. In other words, a gene is shared within a disease group if at least one
significant SNPs in the gene are in common within the disease group. As Supplementary Table 19 shown, based on the most significant SNPs in the gene shared within a disease group, we can only find the shared genes in the RA+T1D disease group. However, if we perform gene-based association analysis, as Supplementary Table 20 shown, we can find a number of shared genes within CD+RA+T1D, CAD+HT+T2D and RA + T1D disease groups. This demonstrated that to detect genetic variants at the SNP level may run a high risk of missing shared genes within the
disease group. Although we cannot confirm all these findings at this stage, some genes in Supplementary Table 20 were reported to be associated with either autoimmune diseases or metabolic diseases. For example, it was widely reported that HLA-DQA2 and HLA-DQB2 were involved in autoimmune diseases and GBE1 was associated with metabolic syndrome.
Numerous genome-wide gene expression analyses have shown that single-gene analysis finds little similarity between two independent studies, but pathway-based analysis may find a number of pathways in common24. These results imply that pathway-based analysis coupled with gene-based analysis may also provide an analytic tool for interpreting the results of GWAS to unravel complex genetic structure of the diseases19. Pathway analysis is to identify pathways that are significantly associated with the disease. In other words, we attempt to test whether the pathway is overrepresented by the genes which are significantly associated with the disease. The hypergeometric test (Fisher’s exact test), several combining P-value methods (Fisher combination test, Sidak combination test, Simes’ combination test and a test based on false discovery rate) were used to test significant association of pathway with the disease (See methods). We assembled 465 pathways from KEGG25 and Biocarta (http://www.biocarta.com). Table 3
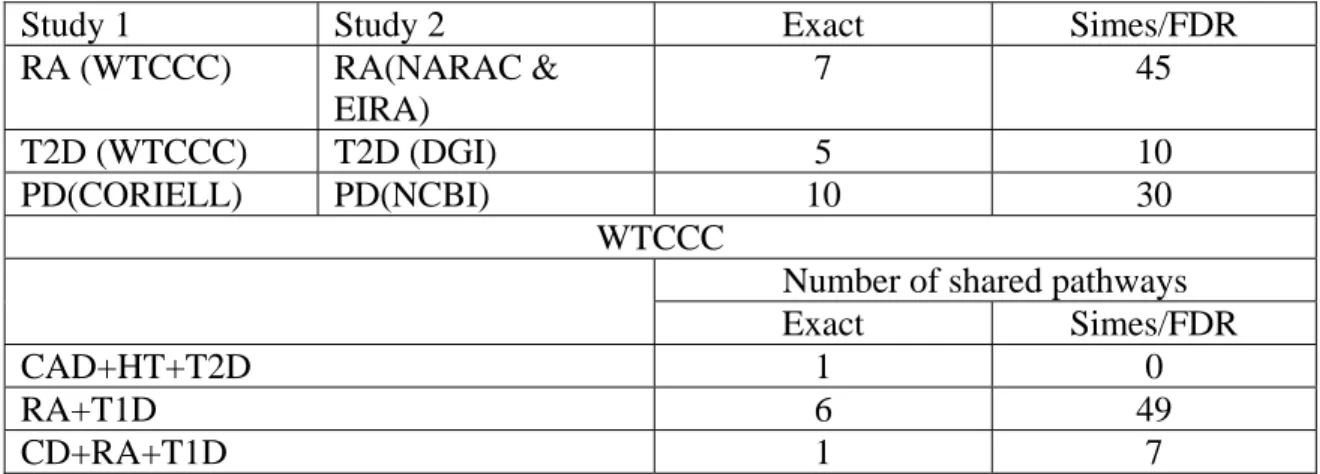
summarized the number of significant pathways and Table 4 summarized the number of replicated pathways associate with the diseases RA, T2D and PA in two independent studies or the number of pathways shared within the diseases CAD+HT+T2D, RA+T1D, and CD+RA+T1D in the WTCCC studies. These significant pathways were identified by overrepresentation test and Simes/FDR method. Supplementary tables 21-33 summarized all significant pathways with P-values ≤0.01 which were calculated by Fisher exact test or by Simes/FDR method for thirteen studies. Supplementary tables 34-36 listed all significant pathways associated with the diseases RA, T2D and PA which were replicated in two independent studies and Supplementary tables
37-39 listed the significant pathways shared by the disease groups: CAD+HT+T2D, RA+T1D and CD+RA+T1D. These tables demonstrated several remarkable features that should be used to extract biological insight from GWAS. First, the paradigm of genetics of complex diseases is that the combined actions of DNA variants within pathways play an essential role in predisposing to diseases while the genetic effects of individual gene may be small. Therefore, functional pathway analysis is a key to unraveling mechanism of complex diseases and opens a way toward a pathway definition of complex diseases. Biological pathways are sets of genes that work in concert to perform particular cellular functions or biological processes. As Table 3 shown, much larger proportion of pathways was significantly associated with the disease than that of genes, let alone SNPs. This implied that pathways play essential roles in causing disease. We note that many identified pathways showing significant association form the core of pathway definition of
complex diseases. For example, MAPK pathway, JNK pathway, the ubiquitin-proteasome pathway, O-Glycan biosynthesis and Axon guidance which showed significant association with the PD in two studies (CORIELL and NCBI) have been reported as a set of major pathways implicated in PD26,27. T2D is caused by excessive production of glucose, decreased insulin secretion, and insulin resistance, which lead to oxidative address and activate stress-sensitive signaling pathways28. Pathway-based association analysis identified NF-kB, p38 MAPK, Angiotensin II mediated activation of JNK Pathway, Activation of PKC through G protein coupled receptor pathway, Wnt signaling pathway, Adherens junction, Melanogenesis, ECM-receptor interaction and Vitamin C in the Brain pathway, which form the major pathways defining T2D (Supplementary Table 40). Second, results of pathway-based GWAS can be verified by functional pathway enrichment analysis of gene expressions. For example, RA is an autoimmune disease. Its major feature is chronic inflammation of joints. Our pathway-based association analysis identified
Cytokine-cytokine receptor interaction, IFN α signaling, , Jak-STAT signaling, Complement and coagulation cascades, and Fatty acid biosynthesis pathways that were confirmed by pathway enrichment analysis of gene expression profiling of peripheral blood cells of RA29. Third, replication of the results of pathways in independent samples is much easier than replication of genes or SNPs. One strategy to meet the major challenge of separating the large number of false-positive associations from the true false-positive associations in GWAS is to replicate the results in independent studies. Replications are a major strategy for confirmation of association results. Replications can be performed at the level of the SNP, the gene and pathway. As Table 1 shown, no significant SNPs (using Bonferroni method for correction of multiple tests) in T2D GWAS can be replicated and only seven significant genes can be replicated in the WTCCC and DGI studies. However, 10 (Simes/FDR) or 5 (Fisher exact test) pathways can be replicated (Table 4). Risk genes for different individuals may be different, but may be in the same pathway. Identification of pathways associated with disease allows us to much easily discover pathogenesis of disease. Figures 2A and 2B plot the GnRH signaling pathway that was associated with RA in the WTCCC studies with P-value ≤1.48×10⁻¹⁴(Fisher combination test), P-value ≤0.025(Fisher Exact Test) and P-value ≤0.017(Simes/FDR) and NARAC & EIRA studies with P-value ≤1.00×10⁻¹⁷ (Fisher combination test), P-value ≤0.0055(Fisher Exact Test) and P-value
6 10 39 .
1 × −
≤ (Simes/FDR) . Although GnRH pathway was significantly associated with RA in
both studies, the genes that turned significant association in two studies were different. Two paths: Gs Æ AC Æ PKA Æ Gonadotropins gene expression & secretion and MAPK pathway (GRB2 Æ Sos –> Ras Æ Raf1 Æ MEK1/2 Æ ERK1/2 Æ Gonadotropins gene expression & secretion) are involved in GnRH pathway. In WTCCC studies, several genes GNAS (Gs, P-value < 0.0097), ADCY2 (AC, P-value < 0.000191) and PRKACB (PKA, P-value < 4.48×10⁻⁶) in the first path
showed strong association or mild association, but did not show any association in NARAC & EIRA studies. The genes in the second path (MAPK pathway): GRB2 (P-value <1.27×10⁻⁵), KRAS (Ras, P-value < 7.77×10⁻⁶) and MAP2K1 (ERK, P-value < 0.005) were associated with RA in NARAC & EIRA studies, but not in WTCCC studies. It has been a long-time to discuss that endocrine system may play critical role in the pathogenesis of RA. Gonadotropins are hormones secreted by gonadotrope cells of the pituitary gland. The two major gonadotropins are luteinizing hormone (LH) and follicle stimulating hormone (FSH). LH stimulates secretion of sex steroids from the gonads. FSH stimulates the maturation of ovarian follicles in women and support sperm cell maturation in men. Gonadotropins have marked immunomodulatory properties and may play important roles in the pathogenesis of various immune-regulatory diseases. Sex hormone levels including estrogen and/or progesterone in women and testosterone in men are reported relatively low in most RA patients. Clinical onset of RA also shows hormone- related pattern30. Typically, the peak incidence of RA in women is during menopause, while the disease in men occurs after age 45. These observations are consistent with gonadotropins associated disease mechanisms. It is interesting to note that the P-values of the best SNP in gene PRKACB, GRB2 and KRAS were 0.013, 0.006 and 0.0012, respectively. This example showed that each SNP may confer small contribution, but their joint actions may affect function of the pathway which in turn will cause disease. These results strongly challenge the current strategy for genome-wide association studies which was limited to taking only single SNP as basic unit for association testing.
DISCUSSION
In the past two years we have witnessed the success of the first wave of large-scale GWAS. Despite rapid progress in GWAS, the most widely used approach to GWAS is individual SNP association analysis. In other words, it evaluates the significance of individual SNPs. However,
GWAS at only SNP level have two serious limitations. First, the final result of individual SNP association analysis is determined by the selected significance level. The different choice of the significance level will severely affect the list of significant SNPs. Many SNPs with moderate genetic effects are discarded by the strict threshold. Therefore, the list of most significant SNPs account for only a small proportion of the genetic variants of complex traits and are unable to reveal holistic genetic structure. Second, Single individual SNP association analysis separates association finding from biological interpretation. It offers limited understanding of complex diseases as an integrated whole. What should be future developments for GWAS? To address this issue, we proposed to take a system biology approach, which considers not only SNP, but also gene and pathway as a basic unit of GWAS, to deciphering complex path from genotype to phenotype.
The proposed paradigm for GWAS consists of three components: SNP-based, gene-based and pathway-based association analyses. Gene and pathway-based association analysis assesses the significance of the genes and the predefined pathways, and intends to identify biological
pathways with subtle but coordinated genetic variants that confer risk contributions. We
performed a comprehensive gene and pathway-based GWAS for eleven diseases, assuming that the results of single SNP association analysis are available. Our results showed that the proposed new paradigm for GWAS not only identified the genes that include significant SNPs found by single SNP analysis, but also detected new genes in which each single SNP conferred small disease risk, but their joint actions were implicated in the development of diseases. We verified the new genes that were identified by the new paradigm for GWAS from two aspects. First, these new findings were replicated in two independent samples. Second, the SNPs that are located in the new identified genes were not significant in any of their original studies, but showed strong
association in the recently published meta analysis of genome-wide association data and large-scale replication. Our results also strongly demonstrated that replication of association finding at the gene or pathway level is much easier than replication at the individual SNP level. One of the major advantages offered by the new paradigm for GWAS is that pathway-based analysis can add structure to genomic data and allows us to gain insight into the deep understanding of cellular processes as intricate networks of functionally related genes. We further demonstrated that the new paradigm can also offer the opportunities for finding the pathways that are common within disease groups. We used RA as an example to show that the identified pathways by the new paradigm for GWAS can be confirmed by gene-set rich analysis using gene expression data. This implies that the new paradigm for GWAS will open a novel avenue to integrate GWAS with other functional analyses and hence will facilitate to uncover the mechanism of complex diseases.
Since the current GWAS only report the P-value for single SNP, and the individual genotype data is not publically available, our methods for gene and pathway-based GWAS are designed for the P-value data. The major tool for gene and pathway-based analyses is to combine independent P-values of single SNP in the gene into an overall P-value for the gene and independent P-values of single gene in the pathway into an overall P-value for the pathway. Since the SNPs in a gene are often dependent, we need methods for combining dependent P-values, which in turn require individual genotype information. The limitation of the proposed gene and pathway-based association analysis which is based on combining independent P-values is applied to dependent data. The gene and pathway-based analysis that uses the methods to combine dependent P-values will be needed. The results of the gene and pathway-based GWAS that take correlations among the SNP and genes into account will be performed in the near future.
In the coming years we will see the rapid progress in GWAS. Many challenging tasks for GWAS are that we not only need to develop powerful statistical methods for detection of as many association of genetic variants as possible, but also need to study functional basis of association and to gain insight into deeper and deeper understanding of mechanism of complex diseases. To unravel the true nature of complex diseases can only be gained by integration of multiple approaches and multiple types of data. As a proof of concept, we showed that the gene and pathway-based GWAS can provide a general framework for combining genetic studies with other functional analyses. We expect that gene and pathway-based analysis will become second wave of large-scale GWAS.
METHODS
Gene-based association analysis. A gene consists of a number of SNPs. Typical results for association studies are the P-values for testing association of the single SNP with the disease. Statistics for testing association of a gene with the disease were conducted on the basis of the combination of P values of the SNPs in the gene14. We assume that the P-values Pi are independent and uniformly distributed under their null hypotheses although independent assumption may be violated due to linkage disequilibrium (LD) among SNPs in the gene. Several methods were used to combine independent P values. A general framework for combining independent P-values is as follows. Let Pi be the p-value for corresponding statistic
i
T with G distribution to test the i-th markerMi. Then, Pi is a random variable with a uniform distribution on [0,1]. Under the null hypothesis (G distribution), the common form for combining P-values is to make transformation. Let H be a continuous monotonic function. A transformation of P-value is defined as
) 1 ( 1 i i H P Z = − − . Fisher Combination Test.
The full combination methods are to combine P-values of all SNPs within the gene. The statistic for combining K independent P-values or combining information from K SNPs, is usually given by . 1
∑
= = K i i ZZ If H =1−e−x/2, then Fisher showed that
∑
∑
= = − − =− = K i i K i i F H P P Z 1 1 1 log 2 ) 1 ( follows a χ(22K) distribution21.Sidak Combination Test (The Best SNP)
If we consider only the best SNP in the gene, then the statistic is defined as
) 1 ( P ZB = .
The distribution of ZB is given by K
B w w
Z
P( ≤ )=1−(1− ) , which is also referred to as Sidak’s correction.
Simes’ Combination Test
Let P-values be ordered as P(1) ≤P(2) ≤...P(k). The P-value is calculated as
⎭ ⎬ ⎫ ⎩ ⎨ ⎧ = i kP Ps i i ) ( min . The FDR methods
Let π be the proportion of tests with a true null hypothesis and F(α) be the expected proportion of tests yielding a P-value less than or equal toα , )V(α be the expected proportion of tests resulting in a false positive with significant levelα.
Suppose that there are d distinct P-values among p={p1,",pk}. Let~p1<~p2 <"< p~d.
Let mjbe the number of P-values among p that are equal to ~ . pj Then, j d j j m p I k F
∑
= ≤ = 1 ) ~ ( 1 ) ( ~ α α ,where I is an indicator function:
⎩ ⎨ ⎧ ≤ = ≤ otherwise , 0 ~ , 1 ) ~ ( j α j α p p I
For two sided test, ) 2 , 1 min( p = π ,
For one sided test (χ2 test, trend test) ) 2 , 1 min( a = π , where
∑
= = k i i p k p 1 1 ,∑
= = k i i a k a 1 1 , )ai =2min(pi,1− pi Then, )v(α is estimated by πα α)= ( v . Define ) ( ) ( ) ( ) ( ) ( i i p F p v i t = and} { min ) ( (j) i j t i q ≥ = , ) ( ) 2 ( ) 1 ( q ... qm
q ≤ ≤ ≤ is the ordered false discovery rates. We also take } { min ( ) 1 ) 1 ( j j t q ≥ =
as the false discovery rate for the gene or pathway19.
Pathway-based association analysis.
Consider m genes in a pathway. Assume that P-value for each gene is calculated by one of the methods to combine independent P-values in the previous section. The methods for testing association of pathway with the disease are given below.
Hypergeometric Test (Fisher Exact Test). Fisher exact test is to search for an
overrepresentation of significantly associated genes among the genes in the pathway. We
assume that the total number of genes that are of interests is N. Let S be the number of genes that are significantly associated with the disease (P-value ≤0.05and is calculated by Fisher
combination test) and m be the number of genes in the pathway. Also let k be the number of genes significantly associated genes in the pathway. The P-value of observing k significant genes in the pathway is calculated by
. 1 0
∑
= ⎟⎟ ⎠ ⎞ ⎜⎜ ⎝ ⎛ ⎟⎟ ⎠ ⎞ ⎜⎜ ⎝ ⎛ − − ⎟⎟ ⎠ ⎞ ⎜⎜ ⎝ ⎛ − = k i m N i m S N i S PSidak method. Both P-values for testing association of gene and pathway are calculated by Sidak method that is described in previous section.
Simes’ method. Both P-values for testing association of gene and pathway are calculated by Simes’ method that is described in previous section.
Simes/FDR method. The P-value for testing association of the gene is calculated by Simes’ method and the P-value for testing association of the pathway is calculated by FDR method.
M. M. Xiong is supported by Grant from National Institutes of Health NIAMS P01 AR052915-01A1, NIAMS P50 AR054144-01 CORT, HL74735, and ES09912, and Grant from Hi- Grant from National Institutes of Health Tech Research and Development Program of China (863) (2007AA02Z300). C.I. Amos is supported by Grant from National Institutes of Health ES09912, J. D. Reveilleis supported by Grant from National Institutes of Health NIAMS P01 AR052915-01A1, L. Jin are supported by Grant from Shanghai Commission of Science and Technology (04dz14003) and Grant from Hi-Tech Research and Development Program of China (863) (2007AA02Z300).
1. Saxena, R. et al. Genome-Wide Association Analysis Identifies Loci for Type 2 Diabetes and Triglyceride Levels. Science 316, 1331–1336 (2007).
2. WTCCC. Genome-wide association studies of 14,000 cases of seven common diseases and 3,000 shared controls. Nature 447, 661–683 (2007).
3. Rioux, J.D. et al. Genome-wide association study identifies new susceptibility loci for Crohn disease and implicates autophagy in disease pathogenesis. Nat. Genet. 39, 596– 604 (2007).
4. Sladek, R. et al. A genome-wide association study identifies novel risk loci for type 2 diabetes. Nature 445, 881–885 (2007).
5. Zanke, B.W. et al. Genome-wide association scan identifies a colorectal cancer susceptibility locus on chromosome 8q24. Nat. Genet. 39, 989–994 (2007).
6. Haiman, C.A. et al. Multiple regions within 8q24 independently affect risk for prostate cancer. Nat. Genet. 39, 638–644 (2007).
7. Gudmundsson, J. et al. Two variants on chromosome 17 confer prostate cancer risk, and the one in TCF2 protects against type 2 diabetes. Nat. Genet. 39, 977–983 (2007). 8. Moffatt, M.F. et al. Genetic variants regulating ORMDL3 expression contribute to the
risk of childhood asthma. Nature 448, 470–473 (2007).
9. Zeggini, E. et al. Replication of genome-wide association signals in UK samples reveals risk loci for type 2 diabetes. Science 316, 1336–1341 (2007).
10. Scott, L.J. et al. A genome-wide association study of type 2 diabetes in Finns detects multiple susceptibility variants. Science 316, 1341–1345 (2007).
11. Frayling, T.M. et al. A common variant in the FTO gene is associated with body mass index and predisposes to childhood and adult obesity. Science 316, 889–894 (2007). 12. Plenge, R.M. et al. TRAF1-C5 as a risk locus for rheumatoid arthritis--a genomewide
study. N Engl J Med. 357, 1199-1209 (2007).
13. Lesnick, T.G. et al. A genomic pathway approach to a complex disease: axon guidance and Parkinson disease. PLoS Genet 3, e98 (2007).
14. Benjamin, M. N. & Sham, P.C. The Future of association studies: gene-based analysis and replication. Am. J. Hum. Genet. 75, 353–362 (2004).
16. Wang, K., Li, M., & Bucan, M. Pathway-based approaches for analysis of genomewide association studies. Am J Hum Genet. 81 (6),1278–1283 (2007).
17. Curtis, R.K., Oresic, M., & Vidal-Puig, A. Pathways to the analysis of microarray data. Trends Biotechnol. 23, 429-435 (2005).
18. Subramanian, A. et al. Gene set enrichment analysis: a knowledge-based approach for interpreting genome-wide expression profiles. Proc Natl Acad Sci U S A. 102, 15545-15550 (2005).
19. Pounds S, Cheng C. Robust estimation of the false discovery rate. Bioinformatics.22, 1979-1987 (2006).
20. Casci T. The best of the rest. Nature Reviews Genetics. 8: 907 (2007).
21. Zaykin DV, Zhivotovsky LA, Czika W, Shao S, Wolfinger RD. Combining p-values in large-scale genomics experiments. Pharm Stat. 6:217-226 (2007).
22. Zeggini et al. Meta-analysis of genome-wide association data and large-scale replication identifies additional susceptibility loci for type 2 diabetes. Nat. Genet. 40, 638-45 (2008). 23. Diabetes Genetics Initiative of Broad Institute of Harvard and MIT, Lund University, and
Novartis Institutes of BioMedical Research. Genome-wide search unearths surprising clues for diabetes and blood triglycerides. Science 316, 1331-1336 (2007).
24. Nam D and Kim S-Y. Gene-set approach for expression pattern analysis. Brief Functional Genomic Proteomic (2008) elm034v1.
25. Ogata, H., et al. , KEGG: Kyoto Encyclopedia of Genes and Genomes. Nucleic Acids Res 27, 29-34 (1999).
26. Jankowski M. The role of JNK pathway in familial Parkinson's disease. Postepy Biochem. 53, 297-303 (2007).
27. Moran LB, Graeber MB. Towards a pathway definition of Parkinson's disease: a complex disorder with links to cancer, diabetes and inflammation. Neurogenetics. 2008 9, 1-13 (2008).
28. Evans JL, Goldfine ID, Maddux BA, Grodsky GM. Oxidative stress and stress-activated signaling pathways: a unifying hypothesis of type 2 diabetes. Endocr Rev. 23, 599-622 (2002).
29. van der Pouw Kraan TCTM et al. Rheumatoid arthritis subtypes identified by genomic profiling of peripheral blood cells: assignment of a type I interferon signature in a subpopulation of patients. Ann Rheum Dis, 66, 1008 – 1014 (2007).
30. Panayi GS. Adrenal and gonadal steroid hormone deficiency in the pathogenesis of rheumatoid arthritis. J Rheumatol Suppl. 44:10-12 (1996).
Legend
Figure 1A. Gene-wide scan for eleven diseases. For each of eleven diseases, -log10 of the P value of Fisher combination test for association of the genes are plotted against position on genome. P values < 1×10⁻⁵are represented by circles. All diseases that were not indicated by studies in the Figure were performed in the WTCCC studies.
Figure 1B. Gene-wide scan for eleven diseases. For each of eleven diseases, -log10 of the P value of Simes combination test for association of the genes are plotted against position on genome. P values < 1×10⁻⁵are represented by circles. All diseases that were not indicated by studies in the Figure were performed in the WTCCC studies.
Figure 2A. P values of genes in GnRH pathway for RA in WTCCC studies. Blocks containing significant genes are in red color, Blocks containing mild significant genes are in light red color and blocks containing no significant genes are in green color.
Figure 2B. P values of genes in GnRH pathway for RA in NARAC & EIRA studies. Blocks containing significant genes are in red color, Blocks containing mild significant genes are in light red color and blocks containing no significant genes are in green color.
Supplementary Figure 1. Q-Q plots for Fisher combination test, Simes combination test, Sidak combination test and test base on false discovery rate applied to T2D (WTCCC). The P-values for the corresponding combination tests are plotted (as -log10 P-values) as a function of p values from the expected (uniform) null distribution either before or after removing significant P-values (<3.15 ×10⁻⁶ for genes or <10−4for pathways).
Supplementary Figure 1A. Q-Q plots for the Fisher combination tests of genes before removing significant P-values.
Supplementary Figure 1B. Q-Q plots for the Fisher combination tests of genes after removing significant P-values.
Supplementary Figure 1C. Q-Q plots for the Simes combination tests of pathways before removing significant P-values.
Supplementary Figure 1D. Q-Q plots for the Simes combination tests of pathways after removing significant P-values.
Table 1a. Number of replicated or shared SNPs and genes (Fisher method)
Study 1 Study 2 Number of
replicated or shared SNPs
Number of replicated or shared SNPs which are not located in significant genes Number of replicated or shared genes RA (WTCCC) RA(NARAC & EIRA) 28 0 42 T2D (WTCCC) T2D (DGI) 0 0 7 PD(CORIELL) PD(NCBI) 4 4 82 WTCCC CAD+HT+T2D 0 0 6 RA+T1D 29 0 57 CD+RA+T1D 0 0 5
Table 1b. Number of replicated or shared SNPs and genes (FDR method)
Study 1 Study 2 Number of
replicated or shared SNPs
Number of replicated or shared SNPs which are not located in significant genes Number of replicated or shared genes RA (WTCCC) RA(NARAC & EIRA) 28 0 36 T2D (WTCCC) T2D (DGI) 0 0 0 PA(CORIELL) PA(NCBI) 4 2 4 WTCCC CAD+HT+T2D 0 0 0 RA+T1D 29 0 35 CD+RA+T1D 0 0 0
Table 2. Overall values of the genes CDKAL1, TTLL5 and BTBD16 and their SNPs with P-values less than 0.05 in WTCCC and DGI studies.
WTCCC DGI
Gene P-value Gene P-value Gene P-value Gene P-value
CDKAL1 <1.0E-20 TTLL5 3.0E-15 CDKAL1 2.0E-6 BTBD16 1.0E-6 N0 of SNPs 126 N0 of SNPs 25 N0 of SNPs 114 N0 of SNPs 30
SNP P-value SNP P-value SNP P-value SNP P-value
rs714831 0.0022 rs760233 0.0093 rs714830 0.0135 rs1885512 0.0183 rs2294809 0.037 rs1158282 0.0206 rs736425 0.0208 rs2273796 0.0086 rs2328529 0.0011 rs2302592 0.0465 rs1548145 0.0117 rs7078328 0.0165 rs2328549 0.0001 rs2303345 0.0458 rs2305955 0.0394 rs7098436 0.0098 rs2328573 0.0183 rs2359866 0.0267 rs2820001 0.0188 rs10510107 0.0165 rs2819999 0.0246 rs2359983 0.0177 rs6905567 0.0354 rs10788281 0.0167 rs4236002 0.0054 rs4903350 0.0273 rs6926388 0.0237 rs11200528 0.0132 rs4291090 0.0163 rs4903359 0.0089 rs6927356 0.0478 rs11200537 0.0351 rs4413596 0.032 rs6574258 0.0092 rs6938184 0.0183 rs4527692 0.0254 rs7156551 0.0356 rs7747752 0.0468 rs6456368 2.0E-05 rs8015242 0.0441 rs7754840 0.0075 rs6908425 0.0074 rs8020986 0.0396 rs7767391 0.0365 rs7739578 0.0064 rs9323619 0.0178 rs9460546 0.0057 rs7739596 0.0076 rs10131117 0.0053 rs9465871 0.0445 rs7741604 0.0198 rs10143790 0.0353 rs10484632 0.0122 rs7747752 0.0018 rs11621464 0.0394 rs10946398 0.0059 rs7752602 0.0351 rs11621718 0.0129 rs11970425 0.0375 rs7754840 4.5E-05 rs12887886 0.0427 rs16884481 0.0073 rs7763304 0.0067 Gene P-value Gene P-value rs7766346 0.0271 BTBD16 5.0E-08 TTLL5 4.0E-07 rs7767391 5.5E-06 N0 of SNPs 31 N0 of SNPs 21
rs9348440 8.5E-05 SNP P-value SNP P-value
rs9350257 0.0427 rs1022782 0.0017 rs760233 0.0316 rs9358395 0.0071 rs4237539 0.0021 rs4903359 0.0268 rs9366357 0.0057 rs4317918 0.0027 rs6574258 0.0129 rs9368283 0.0157 rs7078328 0.004 rs8018962 0.0272 rs9460546 3.7E-05 rs10510107 0.0025 rs8020986 0.0382 rs9465871 1.0E-06 rs10887121 0.0053 rs10131117 0.0128 rs10946398 2.5E-05 rs10887122 0.001 rs11621464 0.0231 rs16883996 0.0469 rs11200528 0.002 rs17183738 0.0454 rs11200537 0.0053
Table 3. The number of pathways showing significant association Number of pathways Sources Disease Exact Simes/FDR BD 15 3.23% 22 4.73% CAD 22 4.73% 28 6.02% CD 26 5.59% 77 16.56% HT 23 4.95% 21 4.52% RA 36 7.74% 67 14.41% T1D 24 5.16% 136 29.25% WTCCC T2D 33 7.10% 28 6.02% DGI T2D 53 11.40% 24 5.16% NARAC & EIRA RA 40 8.60% 103 22.15% CORIELL PD 24 5.16% 47 10.11% NCBI PD 15 3.23% 31 6.67% CORIELL ALS 35 7.53% 29 6.24% NCBI AREDS 26 5.59% 104 22.37%
Table 4. Number of replicated or shared pathways
Study 1 Study 2 Exact Simes/FDR
RA (WTCCC) RA(NARAC & EIRA) 7 45 T2D (WTCCC) T2D (DGI) 5 10 PD(CORIELL) PD(NCBI) 10 30 WTCCC
Number of shared pathways
Exact Simes/FDR
CAD+HT+T2D 1 0
RA+T1D 6 49