CARDIFF UNIVERSITY
Development of Novel
Methodologies to Quantify, Analyse
and Classify
In-Vivo
Knee Function
Affected by Aging, Osteoarthritis
and Total Knee Replacement
Daniel John Watling
PhD Thesis
Institute of Medical Engineering & Medical Physics
School of Engineering
i
Declaration of Authorship
DECLARATION
This work has not been previously been accepted in substance for any degree and is not concurrently submitted in candidature from any degree.
Signed . . . (candidate) Date . . .
STATEMENT 1
This thesis is being submitted in partial fulfilment of the requirements for the degree of PhD.
Signed . . . (candidate) Date . . .
STATEMENT 2
This thesis is the result of my own independent work/investigation and all views are my own except where otherwise stated. Other sources are acknowledged by explicit references.
Signed . . . (candidate) Date . . .
STATEMENT 3
I hereby give consent for my thesis, if accepted, to be available for photocopying and for library loan, and for the title and summary to be made available to outside organisations.
ii
Abstract
Total knee replacement is effective at reducing pain resulting from end stage knee osteoarthritis but patient clinical outcome remains poor. This study develops methodologies for the assessment and classification of knee function to further the understanding of the mechanical effects of osteoarthritis, identify targets for treatment and objectively evaluate patient functional recovery. This study additionally develops methodologies to investigate how internal knee
structures function during dynamic in-vivo activities using novel approaches to MRI.
The uncertainties in the assessment of patients’ knee function were first investigated. Stair gait analysis was investigated to complement traditional level gait analysis. Measurements with the force plate interacting with step one displayed lowest inter-subject variability and were carried forwards to patient assessments. The level and stair gait of three age groups of healthy volunteers was investigated to select a healthy control group. A trend of peak sagittal moments at the hip, knee and ankle all decreasing with aging and frontal plane joint moments at the hip and ankle increase with aging was found. Age related changes were non-linear becoming more prominent towards old age. Young and middle aged healthy volunteers were combined to form a larger, homogenous cohort for patient comparisons. Inter-subject variability is neither helped nor hindered by the inclusion stair gait analysis when compared to level gait ensuring no adverse affects in distinguishing functional changes from naturally occurring individual variation. Patient completion of stair gait was unfortunately very poor however and the practicalities of stair gait in the patient population were found to be preventative. The accuracy of using principal component analysis over traditional parameterisation to classify osteoarthritic or healthy knee function was found to improve classification accuracy when using the Cardiff Dempster Shafer Theory Classifier. Knee measures were found to have poor classification accuracy with hip and ankle adaptations best discriminating healthy and patient gait. The adaptations to lower limb biomechanics observed in older healthy adults appear to become magnified with osteoarthritis. The classification methodology developed throughout the study resulted in an in and out of sample classification accuracy of 97.9% in determining osteoarthritic or healthy knee function. The hip, knee, ankle and ground reaction force biomechanical data of 12 patients before total knee replacement and one year post surgery were assessed using principal component analysis and the Cardiff Demspter Shafer Classifier. 42% of patients experience no functional benefit and 25% of patients recovered lower limb function characteristic of young and middle aged healthy volunteers. Classification of total knee replacement outcome was found to correlate with clinical outcome measures but implant type, BMI, weight loss and presence of comorbidities were poor indicators of patient outcome. Patient age and pre surgery function were found to correlate to the function observed post surgery, indicating that the earlier timing of intervention (and visualisation of this using the classification methodology) may improve
functional and clinical outcome of patients with end stage knee arthritis.
Novel, high resolution MR imaging and analysis techniques to quantify 3D, patient specific,
in-vivo menisco-tibial kinematics and meniscus shape change were created. Repeatability was
high with largest errors due to MRI image quality. Posterior translations of both menisci were found with increasing knee flexion angle and large meniscus translations, as much as 3.4mm in the anterior-posterior direction and 4mm in the medial-lateral direction were observed with changing transverse plane knee joint rotations. Load bearing introduced substantial additional posterior motion of both menisci, up to 4.6mm (medial meniscus) and 5.2mm (lateral meniscus) in the flexed knee. Large variability was observed between subjects suggesting patient specific response to load bearing is an important consideration in the treatment and rehabilitation of soft tissue injuries and prevention of early onset arthritis. Flexion of the knee was found to introduce compression in the menisci while loading contributed greatest posterior translation of both menisci. The posterior horns of both menisci were also found to rotate towards the centre of the tibial plateau during flexion and maintaining this during treatment of soft tissue injuries may aid the prevention of secondary pathologies.
iii
Acknowledgements
First and foremost I would like to express my gratitude to my supervisors, Dr. Cathy Holt and Dr. Gemma Whatling for their encouragement, technical guidance and support from start to finish. I would have never embarked on the journey of a PhD without their enthusiasm and dedication for the subject.
I would also like to acknowledge Depuy Int. Ltd. for funding my studies and Arthritis Research UK Biomechanics and Bioengineering Centre (ARUKBBC) at Cardiff University for providing a teaching scholarship to support the final year of research. My appreciation goes to Mr. Chris Wilson, Mr. Rhys Williams and Mr Stuart Roy, as well as their registrars, for their invaluable help with the recruitment of patients for the study. A special thank you goes to Mr. Andrew Metcalfe for the continual clinical help and advice and to Helen Roberts for her help with co-ordinating the ethical framework. The study would not be possible without the many volunteers who have so very kindly donated their time to participate in the Motion Analysis and MRI studies. The patients in particular provided a unique perspective of the challenges of osteoarthritis and provided a lot of the motivation and inspiration during this work… not to mention the countless stories which livened up a long measurement session!
I am indebted to Peter Hobden at CUBRIC for the acquisition of MRI scans and to the undergraduate students Alex Sourlas, Sarah Ward and David Williams for their help with MR data collection and their contributions towards the MRI loading device.
A very special thank you too, to Gemma, Lindsay and the NISCHR support officers for their help and company during the long Motion Analysis sessions. Also a special thank you to Wayne Ayre for keeping me as sane as was feasible during the study.
Finally, a very big thank you to all of the family and friends providing constant support and welcome distractions. An especially big thank you to my wife Magdalena, without whom this entire learning experience would not have been possible.
iv
Contents
Declaration i
Abstract ii
Acknowledgements iii
List of Figures viii
List of Tables xiii
Abbreviations xv
Nomenclature xvii
Chapter 1: Introduction and Literature Review 1 1.1: Anatomy of the knee 3 1.2: Assessing knee joint function 8
1.2.1: Patient questionnaires 8
1.2.2: Objective assessment of knee function: CT, MRI, RSA and fluoroscopy 8 1.2.3: Objective assessment of knee function: Motion Analysis 12
1.3: Objective interpretation and classification of biomechanical data: Principal Component Analysis and the Cardiff Dempster-Shafer Theory Classifier
15 1.4: Aims and structure of the study 21 Chapter 2: Motion Analysis Methods 24 2.1: Study participants 24 2.1.1: Healthy participants 24 2.1.2: OA and TKR patients 27 2.2: Equipment 29 2.2.1: Motion Analysis 29 2.2.2: Force plates 31 2.2.3: Stairs 32
2.3: Motion Analysis data collection 34
2.3.1: Motion analysis system calibration 34
2.3.2: Participant data collection 38
2.4: Data Processing 43
2.4.1: Qualisys Track Manager 43
2.4.2: Visual 3D 44
Chapter 3: Optimising and Refining Motion Analysis Methods with
Healthy Volunteers for Future Patient Knee Function Assessment 47
3.1: Introduction 47
3.1.1: Stair gait analysis for the assessment of patient knee function 48 3.1.2: Uncertainties in stair gait analysis methodologies 50 3.1.3: Healthy stair and level gait biomechanics and the changes associated
with aging 52
3.1.4: Chapter aims 56
3.2: Methods 58
v
3.2.2: Equipment and procedures 58
3.2.3: Statistical methods for study aim 1: SGC comparisons 58 3.2.4: Statistical methods for study aims 2 and 3: Adaptations to lower limb
biomechanics with aging and stair vs. walk comparisons 59
3.3: Results 60
3.3.1: Refining knee function assessments: Which SGC should be selected for
analysis? 60
3.3.2: Refining knee function assessments: Effect of aging on level gait
biomechanics 66
3.3.3: Refining knee function assessments: Effect of aging on stair gait
biomechanics 67
3.3.4: Refining knee function assessments: Does stair gait offer advantages for
future patient assessments over level gait analysis alone? 68
3.4: Discussion and Conclusions 70
3.4.1: Refining knee function assessments: Which SGC should be selected for
analysis? 70
3.4.2: Refining knee function assessments: Effect of aging on level gait
biomechanics 74
3.4.3: Refining knee function assessments: Effect of aging on stair gait
biomechanics 76
3.4.4: Refining knee function assessments: Does stair gait offer advantages for
future patient assessments over level gait analysis alone? 78
Chapter 4: PCA and Functional Classification of OA and TKR Lower Limb Function
4.1: Introduction 81
1.1.1: Chapter Aims 83
4.2: Methods 87
4.2.1: Participants 87
4.2.2: Equipment and procedures 88
4.2.3: Parameterisation of healthy volunteer, OA patient and TKR patient gait 90 4.2.4: PCA of healthy volunteer, OA patient and TKR patient gait 90 4.2.5: Dempster Shafer Theory (DST) classification of knee joint function 92
4.3: Results and Discussion 97 4.3.1: PCA of healthy and osteoarthritic gait 97
4.3.1.1: PCA of ankle plantar flexion angle during OA and NL gait 97 4.3.1.2: PCA of ankle plantar-flexion moment during OA and NL gait 100 4.3.1.3: PCA of ankle abduction moment during OA and NL gait 104 4.3.1.4: PCA of hip flexion during OA and NL gait 106 4.3.1.5: PCA of hip extension moment during OA and NL gait 110 4.3.1.6: PCA of hip adduction moment during OA and NL gait 113 4.3.1.7: PCA of knee flexion angle during OA and NL gait 117 4.3.1.8: PCA of knee extension moment during OA and NL gait 121 4.3.1.9: PCA of knee adduction moment during OA and NL gait 125 4.3.1.10: PCA of medial-lateral ground reaction force during OA and NL
gait 129
4.3.1.11: PCA of anterior-posterior ground reaction force during OA and
NL gait 132
4.3.1.12: PCA of vertical ground reaction force during OA and NL gait 136 4.3.1.13: Discussion of PCA and parameterisation of gait adaptations
vi
4.3.1.13.1: Discussion of PCA and parameterisation of modifications to ankle biomechanics with knee OA
141 4.3.1.13.2: Discussion of PCA and parameterisation of modifications to
hip biomechanics with knee OA 142
4.3.1.13.3: Discussion of PCA and parameterisation of modifications to
knee biomechanics with knee OA 143
4.3.1.13.4: Discussion of PCA and parameterisation of modifications
Ground Reaction Forces with knee OA 144
4.3.1.13.5: Summary discussion of gait adaptations with knee OA
investigated using PCA and parameterisation approaches 146
4.3.2: Classification of healthy (NL) and Osteoarthritic (OA) lower limb biomechanics during gait and selection of variables for classification of TKR outcome
148
4.3.2.1: All PCA and parameterisation variables 149
4.3.2.2: PCA variables only 151
4.3.2.3: Parameterisation variables only 153
4.3.2.5: Top ranked gait variables which could be used in a clinical
assessment 156
4.3.2.7: Discussion of the relative importance of gait variables to discriminating between OA and NL gait and identifying measurements for classifying knee functional outcome in TKR patients
158 4.3.2.7.1: Discussion of ranking the relative importance of PCA variables
to classification of OA or NL gait 158
4.3.2.7.2: Discussion of the relative importance of variable selection to classification accuracy of gait of knee OA patients and healthy
volunteers
163
4.3.3: Cardiff DST Classification of TKR patient gait, pre and post surgery 166
4.3.3.1: Results of classification of TKR patient gait, pre and post
surgery 166
4.3.3.2: Discussion: Can the functional recovery of TKR patients be
objectively and accurately classified? 172
4.3.3.3: Discussion: Does TKR restore lower limb function, similar to that of healthy volunteers, in patients with end stage knee OA or does
function remain similar to that existing pre TKR?
174 4.3.3.4: Discussion: Does the classification of TKR knee function using
the PCA and DST based methodology developed in this study allow for predictors of good or poor functional outcome following TKR to be identified?
179 4.3.3.5: Recommendations from the classification of TKR functional
outcome 185
Chapter 5:Development of a Novel Methodology to Investigate Soft Tissue Biomechanics From 3D, High Resolution MRI, In-Vivo and Under Load
188
5.1: Introduction 188
5.1.1: Background 189
5.1.2: Previous methodologies for evaluating meniscus biomechanics 190
5.1.2.1: In-vitro investigations 191
5.1.2.2: In-vivo investigations 193
5.1.3: Chapter Aims 198
5.2: Methods 199
5.2.1: Participants 199
vii
5.2.3: Data Collection: Loading protocol 203
5.2.4: Data Processing: Creating 3D models from MR Image data 205 5.2.5: Data Processing: Defining the tibial local co-ordinate system 206 5.2.6: Data Processing: Calculating meniscus translations 207 5.2.7: Data Processing: Calculating meniscus shape change 209
5.2.8: Determining repeatability 209
5.3: Results. 210
5.3.1: Repeatability of the methodology 210
5.3.2: Effect of passive knee flexion on meniscus translations 212
5.3.3: Effect of Loading on Meniscus Translations 215
5.3.4: Effect of Transverse Knee Rotations on Meniscus Translations 217 5.3.5: Meniscus shape change with loading and flexion 219
5.4: Discussion and Future Work 222
5.4.1: Assessment of the novel MR imaging protocol repeatability and
uncertainties for describing meniscus biomechanics 222
5.4.2: Assessment of meniscus translations 227
5.4.2.1: Effect of Passive Knee Flexion on Meniscus Translations 227 5.4.2.2: Effect of Loading on Meniscus Translations 229 5.4.2.3: Effect of Transverse Knee Rotations on Meniscus Translations 230 5.4.3: Meniscus shape change with passive flexion and axial load 235 5.4.3.1: Interpretation of meniscus shape change results 235 5.4.3.2: Effect of passive knee flexion on meniscus shape change 237 5.4.3.3: Effect of axial loading and flexion on meniscus shape change 238
5.5: Summary and Conclusions 240 Chapter 6:Conclusions and Future Work 242
6.1: Summary and Conclusions 242
6.2: Future Work 251
Appendix A: Volunteer MOCAP Information Sheet 256 Appendix B: Volunteer MOCAP Consent Form 260 Appendix C: Patient MOCAP Information Sheet 262 Appendix D: Patient MOCAP Consent Form 266 Appendix E: MOCAP Subject Details Form 268 Appendix F: Oxford Knee Score Questionnaire 269 Appendix G: Knee Outcome Survey Questionnaire 272 Appendix H: OA & NL Classifier Input Data 272 Appendix I: TKR Classifier Input Data 282 Appendix J: MRI Volunteer Information Sheet 287 Appendix K: MRI Volunteer Consent Form 293 Appendix L: CUBRIC MRI Initial Screening Form 297 Appendix M: CUBRIC MRI Secondary Screening Form 300
viii
List of Figures
Chapter 1
1.1 X-Ray of a knee with severe, Kellgren-Lawrence Grade 4, OA 1
1.2 Bony anatomy of the lower limbs 3
1.3 Rotations of the knee in the three clinical planes 4
1.4 Soft tissue anatomy of the knee 5
1.5 Drawing of the medial and lateral menisci on the tibial plateau 6 1.6 Schematic demonstrating the increase in peak contact stresses within
the knee upon removal of the menisci 6
1.7 Outline of a TKR implant clearly visible on X-ray 9 1.8 General Electric 3.0 Tesla closed bore MRI scanner 11 1.9 Healthy volunteer participating in MOCAP data collection 12
1.10 Knee adduction moment calculation 14
1.11 Example gait waveform showing knee flexion for one patient 16 1.12 Cardiff DST simplex plot showing classification of 4 Motion Analysis
gait assessments 19
Chapter 2
2.1 Motion analysis equipment and patient walkway in the Cardiff Motion
Analysis Laboratory 29
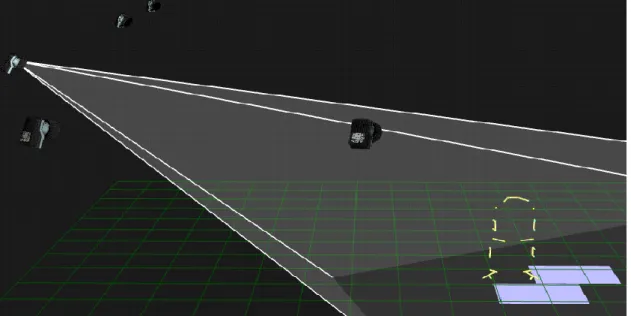
2.2 ‘View cones’ feature of Qualisys Track Manager 30 2.3 Staircase used for motion analysis data collection 33 2.4 Illustration of how stair steps interact with floor mounted force plates 33 2.5 Calibration frame used to establish the laboratory global co-ordinate
system 35
2.6 Calibration of the measurement volume using the wand method 35
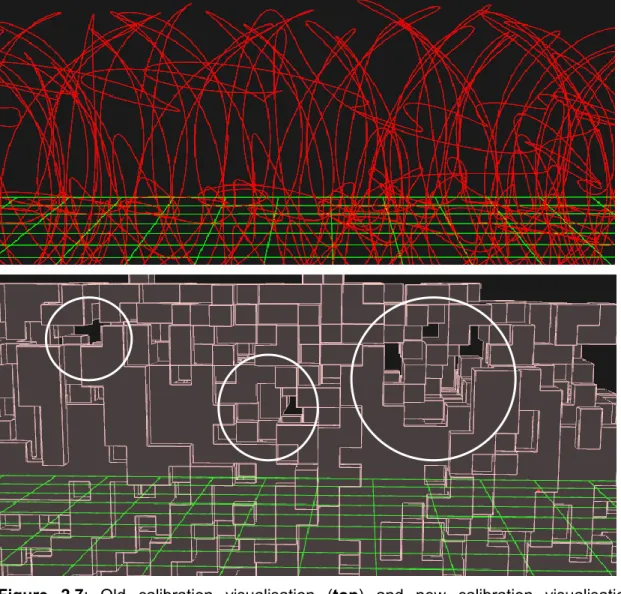
2.7 Calibration visualisation 37
2.8 Frame used to identify force plate corners during laboratory calibration 37 2.9 CAST protocol marker set used during data collection 38 2.10 Healthy participant performing level gait motion analysis 40 2.11 Four stair gait cycles used during the study 42
2.12 Motion Analysis marker labelling in QTM 43
2.13 Biomechanical model created in Visual 3D 45
Chapter 3
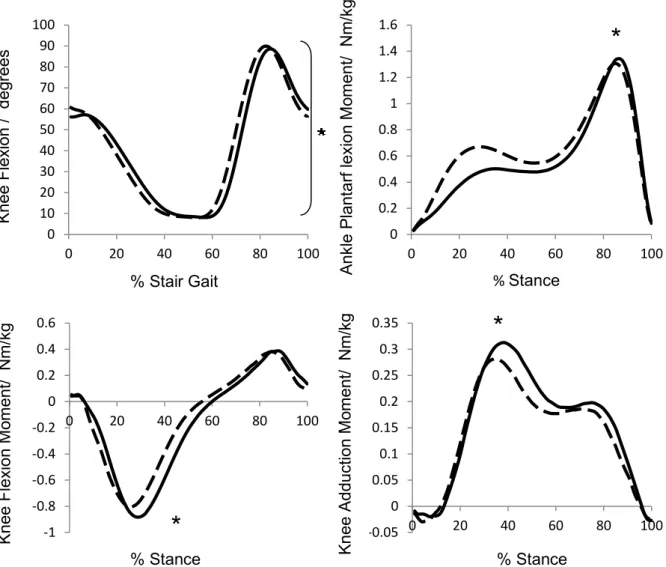
3.1 Mean kinematic and kinetic waveforms of variables found to be
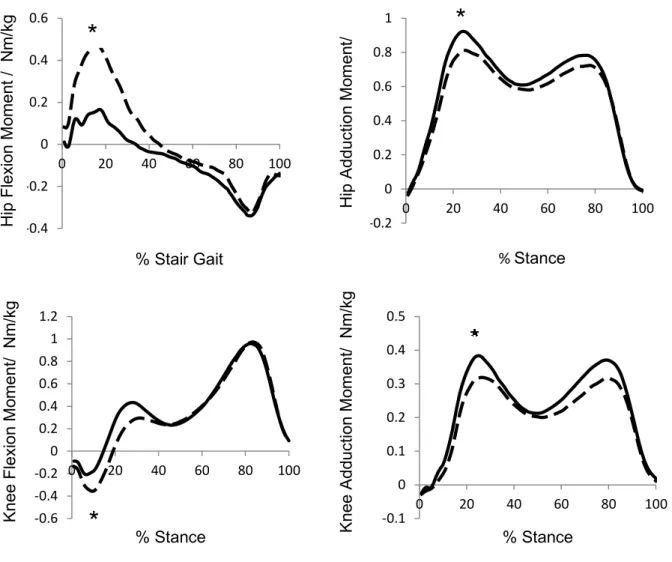
statistically significantly different between two cycles of stair ascent 63 3.2 Mean kinetic waveforms of variables found to be statistically
significantly different between two cycles of stair descent 64
Chapter 4
4.1 Visualisation of the final classification of knee function using the DST
classifier on a simplex plot 94
4.2 Simplex plot decision regions 94
4.3 Ankle plantar-flexion angle 97
ix
4.5 Factor Loading for PC1 for ankle plantar-flexion angle 98 4.6 Factor Loading for PC2 for ankle plantar-flexion angle 99 4.7 Ankle plantar-flexion angle with PC’s retained highlighted 99
4.8 Ankle plantar-flexion moment 100
4.9 Eigenvalues for the 100PC’s of ankle plantar-flexion moment for
healthy (NL) volunteers and pre-TKR (OA) patients during gait 101 4.10 Factor Loading for PC1 for ankle plantar-flexion moment 101 4.11 Factor Loading for PC2 for ankle plantar-flexion moment 101 4.12 Ankle plantar-flexion moment with PC’s retained highlighted 103
4.13 Ankle abduction moment 104
4.14 Eigenvalues for the 100PC’s of ankle abduction moment for healthy (NL) volunteers and pre-TKR (OA) patients during gait 104 4.15 Factor Loading for PC1 for ankle abduction moment 105 4.16 Ankle abduction moment with the PC retained highlighted 106
4.17 Hip flexion angle 107
4.18 Eigenvalues for the 100PC’s of hip flexion angle for healthy (NL)
volunteers and pre-TKR (OA) patients during gait 107 4.19 Factor Loading for PC1 for hip flexion angle 108 4.20 Factor Loading for PC2 for hip flexion angle 109 4.21 Hip flexion angle with PC’s retained highlighted 109
4.22 Hip extension moment 110
4.23 Eigenvalues for the 100PC’s of hip extension moment for healthy (NL) volunteers and pre-TKR (OA) patients during gait 110 4.24 Factor Loading for PC1 for hip extension moment 111 4.25 Factor Loading for PC2 for hip extension moment 112 4.26 Hip extension moment with PC’s retained highlighted 112
4.27 Hip adduction moment 113
4.28 Eigenvalues for the 100PC’s of hip adduction moment for healthy (NL) volunteers and pre-TKR (OA) patients during gait 114 4.29 Factor Loading for PC1 for hip adduction moment 115 4.30 Factor Loading for PC2 for hip adduction moment 115 4.31 Factor Loading for PC3 for hip adduction moment 116 4.32 Hip adduction moment with PC’s retained highlighted 116
4.33 Knee flexion angle 117
4.34 Eigenvalues for the 100PC’s of knee flexion angle for healthy (NL) volunteers and pre-TKR (OA) patients during gait 118 4.35 Factor Loading for PC1 for knee flexion angle 119 4.36 Factor Loading for PC2 for knee flexion angle 119 4.37 Factor Loading for PC3 for knee flexion angle 120 4.38 Knee flexion angle with PC’s retained highlighted 120
4.39 Knee extension moment 121
4.40 Eigenvalues for the 100PC’s of knee extension moment for healthy (NL) volunteers and pre-TKR (OA) patients during gait 122 4.41 Factor Loading for PC1 for knee extension moment 123 4.42 Factor Loading for PC2 for knee extension moment 123 4.43 Factor Loading for PC3 for knee extension moment 124 4.44 Knee extension moment with PC’s retained highlighted 124
4.45 Knee adduction moment 125
4.46 Eigenvalues for the 100PC’s of knee adduction moment for healthy
(NL) volunteers and pre-TKR (OA) patients during gait 126 4.47 Factor Loading for PC1 for knee adduction moment 127
x
4.48 Factor Loading for PC2 for knee adduction moment 127 4.49 Factor Loading for PC3 for knee adduction moment 128 4.50 Knee adduction moment with PC’s retained highlighted 128
4.51 Medial-lateral ground reaction force 129
4.52 Eigenvalues for the 100PC’s of medial-lateral ground reaction force
for healthy (NL) volunteers and pre-TKR (OA) patients during gait 130 4.53 Factor Loading for PC1 for medial-lateral ground reaction force 131 4.54 Medial-lateral ground reaction force with PC’s retained highlighted 131
4.55 Anterior-posterior ground reaction force 132
4.56
Eigenvalues for the 100PC’s of anterior-posterior ground reaction force for healthy (NL) volunteers and pre-TKR (OA) patients during gait
133 4.57 Factor Loading for PC1 for anterior-posterior ground reaction force 134 4.58 Factor Loading for PC2 for anterior-posterior ground reaction force 134 4.59 Anterior-posterior ground reaction force with PC’s retained highlighted 135
4.60 Vertical ground reaction force 136
4.61 Eigenvalues for the 100PC’s of vertical ground reaction force for healthy (NL) volunteers and pre-TKR (OA) patients during gait 136 4.62 Factor Loading for PC1 for vertical ground reaction force 137 4.63 Factor Loading for PC2 for vertical ground reaction force 138 4.64 Factor Loading for PC3 for vertical ground reaction force 138 4.65 Vertical ground reaction force with PC’s retained highlighted 139 4.66
Simplex plot showing co-ordinate position of BOEc for healthy volunteers and pre-TKR patients with end stage OA classified using PCA and parameterisation of the hip, knee ankle and GRF’s as input variables
149
4.67
Simplex plot showing co-ordinate position of BOEc for healthy volunteers and pre-TKR patients with end stage OA, classified using PCA hip, knee, ankle and GRF input variables
151 4.68
Simplex plot showing co-ordinate position of BOEc for healthy volunteers and pre-TKR patients with end stage knee OA, classified using parameterisation hip, knee, ankle and GRF input variables
153
4.69
Simplex plot showing co-ordinate position of BOEc for healthy volunteers and pre-TKR patients with end stage knee OA, classified using all PCA and parameterisation of the Knee and GRF’s only as input variables
154
4.70
Simplex plot showing co-ordinate position of BOEc for healthy volunteers and pre-TKR patients with end stage OA, classified using PCA and parameterisation of GRF and knee adduction moment data
157 4.71 Simplex plot showing co-ordinate position of BOEc for 12 pre TKR
patients and their corresponding one year post TKR assessment 167 4.72
Highlighted OA vertex of the simplex plot showing co-ordinate
position of BOEc for pre TKR patients and the same patients one year
post TKR 168
4.73
Highlighted NL vertex of the simplex plot showing co-ordinate position of BOEc for pre TKR patients and the same patients one year post TKR
169 4.74 Simplex plot showing co-ordinate position of BOEc for 5 pre-TKR
patients and lower limb function showing no improvements post-TKR 175 4.75
Simplex plot showing co-ordinate position of BOEc for 3 pre-TKR patients and their lower limb function being restored to that characteristic of healthy gait post-TKR
176 4.76 Simplex plot showing co-ordinate position of BOEc for 4 pre-TKR 176
xi
patients and lower limb function improving post-TKR (pink) but not to the extent for their gait to be classified as “healthy”
Chapter 5
5.1 Hypothetical change in biomechanical knee joint function with time 188 5.2 Mechanical properties of radially and circumferentially orientated fibres in the meniscus 192 5.3 Measurements taken to define menisco-tibial translations 193
5.4 Example MR Image quality 194
5.5 Schematic diagrams showing two approaches to introducing load
bearing to the lower limbs during MRI 195
5.6 MR compatible mass-pulley loading device used to apply sagittal
torques around the knee 195
5.7 Example MRI images of a grade 3 cartilage change of the lateral
femoral condyle 201
5.8 Illustrating restricted maximum knee flexion possible when using the
knee array during imaging 202
5.9 Maximum knee flexion (supine, flexi-coil) 202
5.10 Maximum knee flexion (prone, flexi-coil) 202
5.11 Loading device positioned in mock GE Signa HdX 3.0T scanner at CUBRIC, Cardiff University 203
5.12 Overview of the MR imaging protocol 205
5.13 3D Bone model registration 206
5.14 Definition of the tibia anatomical co-ordinate system 207
5.15 Tibial model registration 208
5.16 Showing qualitative visualisation and changing meniscus centroid
location 208
5.17 Representative MR image of the knee and resulting 3D meniscus
models 210
5.18 Qualitative visualisation of meniscus translation for HVY1 during
passive knee flexion 213
5.19 Qualitative visualisation of meniscus translation for HVY2 during
passive knee flexion 213
5.20 Qualitative visualisation of meniscus translation for HVY3 during
passive knee flexion 213
5.21 Qualitative visualisation of meniscus translation for HVY3 during full passive knee flexion 214 5.22 Qualitative visualisation of meniscus translation for HVY3 throughout a full range of passive knee flexion 214 5.23 Qualitative visualisation of meniscus translation for HVY1 during axial loading 216 5.24 Qualitative visualisation of meniscus translation for HVY2 during axial loading 216 5.25 Qualitative visualisation of meniscus translation for HVY3 during axial loading 216 5.26 Qualitative visualisation of meniscus translation for HVY1 during transverse plane tibial rotations 218 5.27 Qualitative visualisation of meniscus translation for HVY2 during transverse plane tibial rotations 218 5.28 Qualitative visualisation of meniscus translation for HVY3 during transverse plane tibial rotations 218 5.29 Meniscus deformation with passive flexion and axial loading for HVY1 219 5.30 Meniscus deformation with passive flexion and axial loading for HVY2 220
xii
5.31 Meniscus deformation with passive flexion for HVY3 221 5.32 Filtered MR Image of high signal areas appearing on some scans for
HVY2, introducing errors during the segmentation of menisci 223 5.33 Representative MR Image illustrating how the end of the meniscal
horns gradually transition to ligaments, viewed in the transverse plane 224 5.34 Individual 3D bone models of the full lower limb created by
segmenting 3 MR scans 231
5.35
Showing how vectors may be defined from anatomical landmarks for defining ACS’s for the femur and tibia with additional MRI hip and ankle
232 5.36
Example possible registration of 3D bone lower limb bone models bone models created from high resolution tibio-femoral joint MRI in full passive flexion
232 5.37 Qualisys Oqus MRI compatible motion capture cameras 233 5.38
Preliminary results comparing mean knee flexion and knee internal/ external rotation from the established CAST marker set and a marker set modified using anterior markers only
234 5.39
Showing example volume distribution throughout medial meniscus depth to illustrate changes in compressive behaviour with altered loading of the knee
235 5.40 Frontal plane view of 3D meniscus and tibia meshes, illustrating
measurement “noise” due to the meniscus-tibia gap 236 5.41
Transverse plane view of 3D meniscus and tibia meshes, illustrating increasingly reduced meniscus volume distributed at greater depths throughout the meniscus
237 5.42 Illustrating meniscus posterior translation with flexion as viewed in a
single 2D MR slice 239
5.43 Illustrating how two 2D MRI slices do not represent the same
xiii
List of Tables
Chapter 2
2.1 Subject metrics for three groups of healthy volunteers 25
2.2 Subject metrics for patient groups 28
Chapter 3
3.1 Data for the comparison of lower limb biomechanics during two different stair gait cycles in ascent 60 3.2 Data for the comparison of lower limb biomechanics during two different stair gait cycles in descent 61 3.3 Hip, knee and ankle biomechanics of three age groups of healthy
volunteers during level gait, stair ascent and stair descent 65
Chapter 4
4.1 Subject metrics for healthy volunteer and patient groups 88 4.2 Eigenvalues of PC’s retained using Kaiser’s rule 98 4.3 Eigenvalues of PC’s retained using Kaiser’s rule 101 4.4 Eigenvalues of PC’s retained using Kaiser’s rule 105 4.5 Eigenvalues of PC’s retained using Kaiser’s rule 108 4.6 Eigenvalues of PC’s retained using Kaiser’s rule 111 4.7 Eigenvalues of PC’s retained using Kaiser’s rule 114 4.8 Eigenvalues of PC’s retained using Kaiser’s rule 118 4.9 Eigenvalues of PC’s retained using Kaiser’s rule 122 4.10 Eigenvalues of PC’s retained using Kaiser’s rule 126 4.11 Eigenvalues of PC’s retained using Kaiser’s rule 130 4.12 Eigenvalues of PC’s retained using Kaiser’s rule 133 4.13 Eigenvalues of PC’s retained using Kaiser’s rule 137 4.14 Eigenvalues of PC’s retained using Kaiser’s rule 140 4.15
Ranking of variables used in the classification of NL or OA lower limb function using PCA and parameterisation variables of the hip, knee, ankle and GRF’s
150 4.16
Ranking of input variables used in the classification of NL or OA lower limb function using PCA of hip, knee, ankle and GRF input variables
152 4.17
Ranking of input variables used in the classification of NL or OA lower limb function using parameterisation variables of the hip, knee, ankle and GRF’s
154 4.18 Ranking of input variables used in the classification of NL or OA lower limb function using knee and GRF input variables 155 4.19 Ranking of input variables used in the classification of NL or OA lower limb function in Fig.4.70 157 4.20
Summary of classification accuracy and classification uncertainty in using five sets of biomechanical input variable to classify OA or NL knee function
166 4.21 BOEc values for pre and post TKR patients. The belief value most
influential to the classification is highlighted 170 4.22 Oxford Knee Score (OKS) and Knee Outcome Survey (KOS) 171
xiii
questionnaire scores for patients pre and post TKR 4.23 Correlation between objective classification of lower limb
biomechanics using the Cardiff DST Classifier and clinical outcome 171 4.24 Implant type and BOE
C for patients one year post TKR 181 4.25 Age and BMI of each patient at the time of TKR and BOEC for
patients one year post TKR 183
Chapter 5
5.1 Subject metrics for healthy volunteers undergoing MRI 199
5.2 Summary of MR imaging performed 202
5.3 Repeatability of meniscus centroid position calculation during 5
repeat tests 210
5.4 Comparison of segmented medial and lateral meniscus volumes across different MR Imaging for HVY1 211 5.5 Comparison of segmented medial and lateral meniscus volumes across different MR Imaging for HVY2 211 5.6 Comparison of segmented medial and lateral meniscus volumes across different MR Imaging for HVY3 211 5.7 Posterior translation of the medial and lateral menisci centroids when the knee is passively flexed 212 5.8 Medial translation of the medial and lateral menisci centroids when the knee is passively flexed 212 5.9 Posterior translation of the medial and lateral menisci centroids when the knee is loaded 215 5.10 Medial translation of the medial and lateral menisci centroids when the knee is loaded 215 5.11 Posterior translation of the medial and lateral menisci centroids when the knee is internally and externally rotated 217 5.12 Medial translation of the medial and lateral menisci centroids when the knee is internally and externally rotated 217
xv
Abbreviations
2D Two Dimension
3D Three Dimension
6DOF 6 Degrees of Freedom AC Articular Cartilage
ACL Anterior Cruciate Ligament ACS Anatomical Co-ordinate System AIM Automatic Identification of Markers AJC Ankle Joint Centre
ANOVA Analysis of Variance A-P Anterior-Posterior
ARUKBBC Arthritis Research UK Biomechanics and Bioengineering Centre ASIS Anterior Superior Iliac Spine
BMI Body Mass Index
BW Body Weight
CAD Computer Aided Design
CAST Calibrated Anatomical Systems Technique (marker set) COM Centre of Mass
COV Co-efficient of Variation
CT Computed Tomography
CUBRIC Cardiff University Brain Research Imaging Centre DICOM Digital Imaging and Communications in Medicine D-P Distal- Proximal
DST Dempster-Shafer Theory EMG Electromyography FEA Finite Element Analysis
FIESTA-C Fast Imaging Employing Steady State Acquisition FOV Field of View
FP Force Plate
GCS Global Co-ordinate System GRF Ground Reaction Force HJC Hip Joint Centre
HS Heel Strike
IDA Inverse Dynamic Analysis Int. /Ext. Internal/ External
IR Infra-Red
KJC Knee Joint Centre
KL Kellgren Lawrence (X-ray grading system) KOS Knee Outcome Survey
xvi LCL Lateral Collateral Ligament LCS Local Co-ordinate System LED Light Emitting Diode
LOO Leave-One-Out
LOOCV Leave One Out Cross Validation MCL Medial Collateral Ligament M-L Medial-lateral
MOCAP Motion Capture/ Motion Analysis MR Magnetic Resonance
MRI Magnetic Resonance Imaging
NISCHR National Institute for Social Care and Health Research
NL Normal
OA Osteoarthritis OB Objective Function OKS Oxford Knee Score PC Principal Component
PCA Principal Component Analysis PCL Posterior Cruciate Ligament PSIS Posterior Superior Iliac Spine QTM Qualisys Track Manager RMS Root Mean Square ROM Range of Motion
RSA Roentgen Stereophotogrammetric Analysis SD Standard Deviation
SGC Stair Gait Cycle
SP Stance Phase
SPGR Spoiled Gradient Recalled Echo STA Soft Tissue Artefact
TFJ Tibio-femoral Joint THR Total Hip Replacement TKR Total Knee Replacement
TO Toe Off
xvii
Nomenclature
AA-X Ankle plantar-flexion angle AM-X Ankle plantar-flexion moment AM-Y Ankle abduction moment BOE Body of Evidence
BOEc Combined Body of Evidence cf(v) Confidence factor
GRF-X Medial-lateral GRF GRF-Y Anterior-posterior GRF GRF-Z Vertical GRF
h Height of the simplex plot HA-X Hip flexion angle
HM-X Hip extension moment HM-Y Hip adduction moment
HVM "Middle" Aged Healthy Volunteers HVO "Old" Healthy Volunteers
HVY "Young" Healthy Volunteers KA-X Knee flexion angle
KM-X Knee extension moment KM-Y Knee adduction moment m(.) Probability mass function
mc(.) Combined mass probability function
mc(Ɵ) Belief in a subject’s joint function being NL or OA mc(Ɵ)AVE
Mean uncertainty belief value of all subjects' joint function being NL or OA
n Number of persons used in the data set for PCA NL Healthy volunteers
{NL} The hypothesis of a subject having NL function OA Patients with knee osteoarthritis
{OA} The hypothesis of a subject having OA function OB Objective Function
p Number of variables used in the data set for PCA
T1 Time constant which determines the rate at which excited protons return to equilibrium within the lattice during MRI
T2
Time constant for loss of phase coherence among spins oriented at an angle to the static magnetic field due to interactions between the spins during MRI
TE Time in milliseconds between the application of the 90° pulse and the peak of the echo signal during MRI
TR Time between successive pulse sequences applied to the same slice during MRI
1
Chapter 1
Introduction and Literature Review
Osteoarthritis (OA) is a progressive, degenerative disease in which the articular cartilage (AC) protecting the bone surface wears and thins. AC protects the underlying bone during normal knee articulation and once worn results in pain, inflammation, swelling and stiffening of the joint. This not only impairs functional ability and ability to perform daily activities but is also often extremely debilitating, affecting sleep and morale.
Arthritis is the most common chronic condition in the UK followed by heart conditions [1], affecting 8.5 million people [2]. Similarly, arthritis is the most common condition in the UK which limits ability to perform daily activities [3]. OA affects twice as many women as men [4] and is estimated to cost the economy £5.7 billion a year [5]. These trends are also observed across Europe with as many as 100 million people suffering with arthritis [6]. The knee is highly susceptible to pathology and degeneration owing to its lack of inherent bony stability and reliance on soft tissue structures for support.
Figure 1.1: X-Ray of a knee with severe, Kellgren-Lawrence Grade 4, OA. Highlighted are osteophytes formation (1) and narrowing of the joint space (2) used to clinically diagnose the presence of OA. Edited from [7].
1
2
OA is usually diagnosed based on symptoms reported by patients and the physical signs found upon examination of the joint. X-rays are commonly used to confirm OA and may show changes such as the thickening of the underlying bone, wear and changes to the geometry of the articulating surfaces, osteophytes (bony spurs) forming at the periphery of the joint and narrowing of the joint space as shown in Fig1.1 [8]. They may also show calcium deposits which can cause pain within the joint [9]. Motion of the joint is likely to be restricted and muscle atrophy usually follows, leading to further instability and further loss of functional ability.
Clinical examinations are not always a good indicator of how much pain or disability a patient is likely to experience. Some people experience a lot of pain and severely impaired functional ability from apparently minor joint pathology following clinical examination, while others have little pain and minimal interference with daily life from apparently more severe pathology. Similarly, some people will experience a slow and subtle degeneration of the joint while others experience much more rapid deterioration. The clinical treatment and diagnosis of OA therefore presents significant challenges and highlights the need for a better understanding of both healthy and pathological joint function to improve knowledge of the pathogenesis of OA. Furthermore, while a number of risk factors for OA are suggested such as previous joint pathology, obesity and genetics [9], it is not well understood what causes OA, who is most at risk and what early preventative treatments delay the onset of OA most effectively. While the clinical signs of severe OA are easily identifiable, it is much more difficult to objectively monitor subtle changes in joint function such as those following clinical intervention, further reinforcing the need for improved quantification and assessment of joint function.
Treatment of OA may include exercises to strengthen the muscles surrounding the affected joint, weight loss, complementary therapies and pain relief. Total knee replacement (TKR) is widely accepted as an effective means of reducing pain and increasing the function of severe, end stage OA. During a TKR the entire worn joint surface is replaced with prosthetic articulating surfaces. 56,652 TKR’s were performed in the UK between 2004 and 2005 [10] demonstrating the popularity of TKR as a treatment for severe OA. With an aging population the number of TKR’s performed is set to increase along with an increasing demand from patients to perform more demanding activities and recovering greater functional ability post-TKR.
In summary, OA severely affects quality of life and ability to perform activities of daily living in a large proportion of the population and the prevalence is expected to increase
3
of OA and the level of function returned post operatively following TKR is currently difficult to predict leading to a need for better understanding of knee joint function both pre and post operatively. As a result, the biomechanical investigations in this study have implications to the understanding of OA, to treatment planning, rehabilitation and implant design.
1.1: Anatomy of the knee
The knee is the lower limb’s second mechanical link after the ankle and preceding the hip. The knee consists of two joints. The first articulation is between the tibia and the femur bones, shown in Fig.1.2, at the tibio-femoral joint. The fibula bone is located adjacent to the tibia and this plays no role in knee joint motion, instead contributing to ankle joint motion [11]. The second joint in the knee is the articulation between the patella and femur, or patello-femoral joint. The main role of the patello-femoral joint is to increase the lever arm of the quadriceps (thigh) muscle and hence decrease contact forces within the knee during movement.
Figure 1.2: Bony anatomy of the lower limbs. Edited from Gray’s Anatomy[11] Femur Lateral epicondyle gap Medial epicondyle gap Tibia Fibula Medial malleolus Upper border of the greater trochanter Patellar
4
Figure 1.3: Rotations of the knee in the three clinical planes. Edited from Basic Biomechanics of the Musculoskeletal system [12].
The bony anatomy of the knee makes for an inherently unstable, yet highly mobile joint with 6 degrees of freedom (6DOF). Fig.1.3. shows the rotations occurring in the tibio-femoral joint (TFJ) and the terminology used to describe these. The greatest range of motion (ROM) observed in the TFJ occurs in the sagittal plane [12] with smaller motions in the frontal and transverse planes. The large sagittal motion facilitates large body movements such as enabling the forward progression of the body’s centre of mass (COM) walking, while the smaller motions of the other two planes aid stability during these large body movements [13]. The knee exhibits Sagittal ROM from 0-140º from full extension to full flexion [12]. Negative values of flexion are expected to be very small as this represents hyperextension of the TFJ and the ROM of hyperextension is around 5º [13]. Measurements will vary from person to person yet these ROM values described are not expected to deviate from that stated above by more than around 10% for the majority of the healthy population [12]. With regards to internal and external rotation of the TFJ, the ROM is expected to be much smaller than that in the sagittal plane. Maximum external rotation of the TFJ is not expected to exceed 45º and the maximum internal rotation is approximately 30º [12]. These maximum ROM values are only obtained when the knee is flexed to around 90º. When in the neutral position, with the TFJ in near full extension, internal and external rotation is almost eliminated as
Transverse plane
Frontal plane
5
abduction or adduction of the TFJ is also dependant on the amount of knee flexion due to the structure of the bones making up the joint and was not found to exceed more than 8º adduction during gait for healthy volunteers, with the maximum value occurring at around 30º knee flexion [13].
Given the large ROM of the knee and 6DOF, the soft tissues play a significant role in controlling knee articulations. Four ligaments, shown in Fig.1.4, are primarily collagen fibres arranged parallel to their length and help to control the stability of the knee. The anterior cruciate ligament (ACL) and posterior cruciate ligament (PCL) provide stability in the anterior-posterior direction while the medial collateral ligament (MCL) and lateral collateral ligament (LCL) control frontal plane stability of the knee. These two cruciate and two collateral ligaments provide passive restraint to displacement of the tibia relative to the femur. The ACL will experience strain with anterior displacement of the tibia and with internal tibial rotations. The passive restraint provided by the ACL also aids control of femoral roll back during flexion. The PCL provides tibio-femoral restraint opposing the ACL to control posterior displacements of the tibia relative to the femur. ACL and MCL injuries account for 90% of ligament injuries [14] and usually occur during twisting and squatting motions, most commonly during sporting activities.
Figure 1.4: Soft tissue anatomy of the knee. Reproduced from Gray’s Anatomy [11] Anterior cruciate ligament Posterior cruciate ligament Medial collateral ligament Lateral collateral ligament
6
The articulating surfaces of the TFJ are not inherently congruent. This allows for a large range of motion in the knee and 6DOF without impinging the soft tissues but it also means that the knee lacks the inherent bony stability of a joint such as the hip. There is therefore the potential for small contact areas and thus high contact stresses occurring at tibio-femoral contact in the AC. Two fibrocartilagenous structures called menisci sit in between the tibia and femur and are important for load transmission, shock absorption, proprioception, joint stability and increasing joint lubrication [15], shown in Fig.1.5.
Figure 1.5: Drawing of the medial and lateral menisci on the tibial plateau. Adapted from Anatomy of the Knee, in The Lower Extremity and Spine in Sports Medicine [16].
Figure 1.6: Schematic demonstrating the increase in peak contact stresses within the knee upon removal of the menisci. Reproduced from Biomechanics of the Menisci [17].
7
It is reported that the menisci carry up to 45% of the axial loads through the knee with contact stresses in the knee increasing up to 235% upon removal of the meniscus as illustrated in Fig.1.6 [16]. The menisci are therefore vital to overall function, stability and wear of the underlying articular cartilage.
Damage or pathology to the menisci compromises these important functions leading to restricted joint motion, pain, instability and a high likelihood further degenerative changes in the joint [18]. The menisci have the ability to move over the tibial plateau to maintain as congruent a joint contact as possible [19], yet become susceptible to pathology themselves if impinged within the joint. Alterations to joint kinematics may therefore predispose menisci to tears [20] and meniscal tears are strongly linked to progression of OA [18] particularly in younger patients. It is believed that the menisci transmit axial loads to hoop stresses and therefore if the integrity of the collagen fibre arrangements within the meniscus are compromised, such as when a tear is present, then there is a significant risk of increased stress in the articular cartilage and subchondral bone and hence further degeneration of the joint [16]. Despite the importance of the meniscus being widely appreciated to knee function in the literature, in-vivo studies are limited to evaluating single 2D Magnetic Resonance (MR) images [19] and low resolution MR imaging [21]. The action of ligaments, of knee kinematics and of meniscus translation is not in a single plane and as such these previously adopted methods limit our biomechanical understanding of the soft tissues of the knee and hence limit understanding of OA initiation and progression. Furthermore meniscus tears are reported to commonly occur during twisting or squatting movements [22] in a similar injury mechanism to that of ACL/ MCL ruptures described above, yet no previous in-vivo studies have been conducted considering joint loading and transverse knee rotations.
In summary, healthy knee function is a balance between large mobility and high stability and can become unbalanced when one or more components of the knee joint experience pathology. Control and stability of the knee is not dependent solely on bone interactions and bone kinematics but is additionally dependant on the function of soft tissues. These soft tissues work together to minimise localised contact stresses within the various tissues of the knee yet if one or more become damaged through acute or chronic pathology then the likelihood of secondary pathology and further degeneration is high. It is not clear however how dynamic, in-vivo activities of daily living correlate to soft tissue biomechanics and pathology. It would therefore be beneficial to improving the understanding of OA pathogenesis, OA prevention and direction of earlier clinical
8
intervention if macro- scale observations in human movement analysis can be related to the smaller scale soft tissue biomechanics likely to influence joint pain, pathology and ultimately quality of life for those with OA.
1.2: Assessing knee joint function
The clinical challenges of assessing knee OA, namely understanding the mechanical factors of the pathogenesis, monitoring gradual changes in joint function following clinical intervention and predicting future pain and level of future functional ability, demonstrate a need to accurately assess knee joint biomechanics for those with healthy, osteoarthritic and TKR joints in addition to the traditional clinical investigations. It is worth noting that ‘joint function’ in this study refers to biomechanical joint performance as opposed to the more clinical description referring to patient satisfaction
in performing certain activities. 1.2.1: Patient questionnaires
Patient questionnaires such as Knee Outcome Survey [23] and the Oxford Knee Score [24] are traditional clinical research methods of quantifying knee joint function. Patients tick one of several statements that best describe a variety of aspects of joint function such as ability to perform daily activities and pain and then the responses are assigned values which can then be combined to give an overall score of knee function. While successfully describing ability or pain when performing certain activities, these questionnaires rely on subjective patient opinion and are not sensitive enough to highlight small changes in function. Furthermore, these questionnaires give an indication of the feelings and abilities of a patient but do not contain enough information to suggest why a specific patient may be experiencing reduced joint function and difficulties with performing daily activities.
1.2.2: Objective assessment of knee function: CT, MRI, RSA and fluoroscopy
Alternatives methods for objectively quantifying joint function which overcome difficulties with using patient questionnaires include Computed Tomography (CT), Magnetic Resonance Imaging (MRI), Roentgen stereophotogrammetric analysis (RSA) and fluoroscopy.
RSA uses fluoroscopy (dynamic X-ray imaging) to track the position of tantalum markers in bone and has been widely used to investigate joint kinematics [25-28]. A
9
although a dedicated surgical procedure is required to implant the tantalum markers. This unfortunately limits the number of participants who may be assessed. RSA has been shown to have sub degree accuracy in determining rotational errors [28] and the small reported errors have even lead researchers to investigate the micro-motion of prostheses using RSA [29]. Markers may alternatively be attached directly to bone using external fracture fixation devices [30] or using intra-cortical pins [31-33]. Percutaneous devices with external markers have been shown to be influenced by the relative motion of soft tissue and bone during gait [34] and running [35] reducing the accuracy of these kinematic measurements. The clear disadvantage for large volume research is the invasive nature of these methods, both in terms of the radiation and the need to surgically insert markers or pins. The study of Cappozzo [30] used patients recovering from leg fractures to attach markers to external fracture fixation devices and this is clearly not viable in the normal healthy population, OA or TKR populations. Implanting markers into the prosthesis is another approach to RSA which is more viable in the TKR population. This overcomes some of the issues with invasive surgery although investigations are limited to patients with specific implants only [36]. Studying
in-vitro kinematics using this method is an alternative approach although it can be questioned how accurately the in-vivo muscle and soft tissue action are replicated [36].
Figure 1.7: Outline of a TKR implant clearly visible on X-ray (left) and TKR CAD model registered to that outline (right) Images collected during study at Cardiff University.
10
Fluoroscopy may be used without the addition of markers to investigate joint function, as would be the case with RSA. Sequential low dose X-rays image bone motion during dynamic activities. Although fluoroscopy generally only images in one plane, the 3D position and pose of the object can be reconstructed when matched to an accurate geometric model of that object. 3D bone models are created from CT or MR scan data and then registered in 3D on to the 2D X-Ray images to hence describe the 3D kinematics of a joint. A similar process of registering CAD models of TKR implants to fluoroscopy images may be used to reconstruct TKR 6DOF from 2D X-rays as shown in Fig.1.7. Fluoroscopy has been used to investigate kinematic joint motion for 15 years [36] and its applications have been wide and varied including assessing TKR kinematics [36, 37], uni-condylar knee replacement kinematics [38], for validating new designs and improving clinical outcomes of existing treatments, modelling knee kinematics for Finite Element Analysis (FEA) [39, 40], investigating kinematic changes in ACL deficient knees [41], assessing meniscal kinematics [39], determining knee contact points during weight bearing [42], patellar tracking to aid clinical understanding of patella-femoral pain syndrome [43] and investigating foot biomechanics [44]. The main appeal of fluoroscopy to analyse joint function is that it allows direct measurements to be taken while being non-invasive and relatively low risk to the patient. Single plane fluoroscopy is commonly available to research groups and allows greater freedom of motion for activities such as gait, step ups and leg extensions than CT and MR imaging. Determining joint kinematics using fluoroscopy image registration techniques is reported to be highly accurate, to within one degree of rotation and 0.5mm of sagittal plane translation [36]. However, there are several potential sources of error. Inaccuracies may be derived from MR imaging, segmentation of MR images for the creation of computational bone models, errors in reliably defining joint co-ordinate systems on computational bone models, inherent fluoroscopy errors and errors in matching the bone model to the fluoroscopic images that are not comprehensively accounted for in previous studies. Furthermore, [36] report out of plane translations and rotations to be consistently less accurate than in plane motions by around ten times. Out of plane accuracy is reduced in single plane fluoroscopy because translations and rotations out of the plane result in comparatively small changes in size and geometry of the object imaged. Additionally, the relatively small field of view does not permit multiple joints to be investigated simultaneously.
CT and MRI are common clinical imaging modalities allowing for visualization of the internal soft tissue and bone structures. The ability to investigate soft tissue biomechanics in relation to joint kinetics and kinematics is required to better understand OA onset and progression. CT and MRI potentially allow for this without
11
Alterations in knee joint contact pressures and locations may be critical in the mechanisms of knee pain and osteoarthritis [45] and structural changes can be visualized such as fibrillation of articular cartilage in areas of joint degeneration [46]. An example MRI scanner is shown in Fig.1.8.
Figure 1.8: General Electric 3.0 Tesla closed bore MRI scanner. Reproduced from Waisman Laboratory Facilities [47].
Compared to MRI, CT scans do not delineate the interface between soft tissues such as cartilage or cartilage-meniscus boundaries well when the entire intact joint is scanned and when these surfaces are pressed together under load. Imaging participants with metal implants, as would be present in the TKR population, is challenging however due to metal artefact present on the MR images [36]. Although imaging techniques can overcome metal artefact to a certain extent, the confined space within both CT and MRI usually prevents physiologically relevant motions to be captured. Bone segments could be reconstructed in 3D and then the pose and orientation of adjacent segments calculated from a series of statically arranged knee positions. Open MR allows a participant to stand during imaging and hence induce load in the knee and has been used in the literature previously to describe knee kinematics [19]. The compromise for increased ability to replicate in-vivo activities with open MR is a severe reduction in signal to noise ratio. The outcome is a reduction in image resolution and usually 2D acquisitions and 2D analysis [19] rather than in 3D. This simplified approach is required to balance acquiring the desired data but doing so within a feasible scan time without introducing motion artefact as the participant tires
12
and starts to move. Information about soft tissue and bone interaction in the intact in-vivo knee joint could shed light on the pathogenesis of OA [46]. No study in the literature combines high resolution 3D imaging of the internal structures of the knee with loading of the lower limbs and quantification of 3D bone and soft tissue biomechanics in-vivo.
1.2.3: Objective assessment of knee function: Motion Analysis
Opto-electronic stereophotogrammetry, or Motion Analysis (MOCAP), is the most common method of investigating human kinematics and kinetics [40] and is a technique used extensively in the existing Cardiff University protocol to measure normal or pathological function of a joint [48-52].
The participant wears a series of retro-reflective markers placed over anatomical landmarks identified by palpation, shown in Fig.1.9. Tracking markers may be placed on segments and later related to the underlying anatomy and anatomical landmarks. The Qualisys Oqus optoelectronic system at Cardiff University uses passive markers, meaning that the markers do not actively transmit any kind of signal but instead reflect infra red (IR) light from IR emitters within each camera. IR sensors, also within the cameras, allow each marker’s position in three dimensional space to be calculated provided that two or more cameras can see the marker.
13
little restriction to subject movement. Tracking kinematics within large volumes is a further practical advantage. When compared to more clinically available kinematic analyses such as high speed video recordings, motion analysis significantly reduces subjective user errors. One should also not overlook that motion analysis allows for the six degrees of freedom (6DOF) to be calculated in-vivo, and more crucially, non-invasively on several joints simultaneously, permitting a more holistic approach to understanding and modifying knee joint biomechanics.
A good appreciation of joint kinematics is granted by the technique and the instrument errors are also good, although the technique is not without inaccuracies. The most fundamental assumption is that the skin mounted marker movement directly corresponds to bone and joint movement. In reality the skin and subcutaneous soft tissues will move relative to bone leading to errors known as soft tissue artefact (STA). High inertial forces for example, such as those during heel strike, contribute to the movement of markers and soft tissues relative to bone. Human error in identifying the correct anatomical location for skin mounted markers additionally creates errors in the creation of joint axes and in the tracking of joint motion. STA errors and variability between trials in the identification of bony landmarks for example have been found to produce root mean square (RMS) errors of as much as 117% for internal and external rotation of the knee and 192% for adduction and abduction of the knee [53]. A similar study comparing the Cardiff marker based motion analysis protocol to fluoroscopic analysis of knee kinematics found statistically significant differences between the two methods in all motions except for flexion and extension [52].
Despite the reported errors in using motion analysis to calculate joint kinematics it remains the clear choice for cost effective, non-invasive, in-vivo kinematic and kinetic data to be collected from multiple joints simultaneously within large measurement volumes with a large number of healthy and patient volunteers. With this in mind, knee trials at Cardiff University use motion analysis techniques to assess a range of pathologies pre- and post-treatment with the aim of furthering the understanding of kinematic and kinetic effects of OA and evaluating patient recovery following TKR surgery.
Level gait analysis using motion analysis techniques is well documented as a powerful tool for investigating the pathogenesis and rehabilitation of lower limb disorders such as OA. Consistent temporal, kinematic and kinetic features and trends within healthy gait can be used to assess patient data. Pain, decreased muscle mass, changes in
14
proprioception and the associated compensations may alter gait biomechanics [54, 55]. Motion analysis has been used widely throughout the literature, for example characterising gait changes due to OA [51, 56-60], age [61-63], obesity [64], physiotherapy treatments [65], gender [66] and TKR [67, 68].
Figure 1.10: Knee adduction moment is the force acting about the knee centre in the frontal plane, calculated from the ground reaction force vector and its distance to the knee centre. Reproduced from Lower Extremity Review [69].
The knee adduction moment is one of the most commonly reported gait variables associated with biomechanical changes due to OA. It is expected that OA subjects walk with a higher adduction moment than healthy controls [56, 58] and as such a high adduction moment has become associated with a higher severity of OA. The adduction moment is the force acting about the knee in the frontal plane, calculated from the ground reaction force vector and its distance to the knee centre, shown in Fig.1.10. The adduction moment is often used as an indirect measure of medial compartment loading where OA is often more prevalent. High adduction moments have additionally been related to loosening of TKR implants [67]. Deluzio [57] found significant differences between OA and healthy volunteer gait in the magnitude of the knee adduction moment in addition to the range of flexion and magnitude of the flexion moment in early stance.
15
greater medially directed loads (knee adduction moments) on their knees however [59]. This may be in part due to the OA volunteers in this study having OA in all compartments of the knee rather than the medial compartment only and may also be due to variation in methodologies such as the model used to calculate the adduction moment from marker and force plate data [58].
OA participants did however reduce knee extension moments and knee compressive forces by reducing gait velocity [59]. OA and TKR patients typically do not recover the expected range of motion (ROM) during gait and instead walk with a stiff leg strategy, most likely to introduce additional stability while also reducing pain [70]. It appears that these patients do not use all of their available motion when carrying out daily functional activities. It also appears that OA and TKR patients find it relatively easy to compensate for pain or instability during level walking yet it is very difficult to understand why these functional difficulties exist from the level gait motion analysis data. Consequently, assessment of knee function would benefit from more challenging activities that are more relevant to a wider range of daily tasks. Furthermore, despite the prevalence of the knee adduction moment as an indicator of OA progression in the literature, the discrepancies and uncertainties highlight the need for an improved understanding of the relationship between biomechanical factors and OA. There is a need for a holistic approach to understanding the relationship between mechanical factors during daily life and knee OA severity which could lead to biomechanical targets for improved treatment options and rehabilitation.
1.3: Objective interpretation and classification of biomechanical data: Principal Component Analysis and the Cardiff Dempster-Shafer Theory Classifier
Regardless of the measurement approach used to investigate joint function, there is large inter-subject variability and complex inter-dependencies in the vast amount of data which can be collected to describe knee biomechanics. This remains challenging to accurate and relevant clinical patient diagnosis [71].
Analyses of kinematic and kinetic waveforms are traditionally based upon specific waveform parameters such as peaks and troughs, or based upon expert interpretation of the entire waveform [72]. An example waveform showing the knee flexion angle during level gait is shown in Fig.1.11. Parameters such as peak flexion during stance or the total ROM may be extracted from Fig.1.11 for example which can then be used to compare knee function across the four waveforms (four time points in a patient’s

![Figure 1.4: Soft tissue anatomy of the knee. Reproduced from Gray’s Anatomy [11]](https://thumb-us.123doks.com/thumbv2/123dok_us/1801758.2758547/23.892.249.742.649.1054/figure-soft-tissue-anatomy-knee-reproduced-gray-anatomy.webp)

![Figure 1.8: General Electric 3.0 Tesla closed bore MRI scanner. Reproduced from Waisman Laboratory Facilities [47]](https://thumb-us.123doks.com/thumbv2/123dok_us/1801758.2758547/29.892.254.726.262.616/figure-general-electric-scanner-reproduced-waisman-laboratory-facilities.webp)