Drivers of inequalities in Higher Education and the unexpected consequences of equality policies
Abstract
Diversity is generally considered as a goal to be achieved in order to bring the Higher Education (HE) system closer to the needs of society. Conversely, some European countries have not favoured diversification processes in HE; instead, they have preferred to pursue a policy aimed at homogeneity across HEIs, assuming that this would ensure equity and quality of both education and research. The main argument of this paper is that Higher Education Institutions (HEIs) perform differently and policies that do not consider differences across HEIs are likely to increase inequalities. We test the hypothesis that HE systems regulated on the basis of equality assumptions may rather develop substantial inequalities. We test the hypothesis by analysing the case of Italian Universities and by using indicators of research quality. We find deep inequalities in research performance, which are strongly correlated to geographic location. Moreover, we find that inequalities cannot be explained only by the weakness of the local economic context, since they are also strongly linked to the social context and to the adoption of policy measures that that do not address the peculiar features of the HEIs and the context in which they are located.
Key words
I23 - Higher Education Research Institutions I28 - Government Policy
H52 - Government Expenditures and Education JEL Classification
Authors
Emanuela Reale and Marco Seeber CERIS CNR
Via dei Taurini, 19 00185 Rome, Italy
Introduction
Although political rhetoric underlines the importance of diversities within the national HE system, Italy has not effectively pursued a differentiation among Higher Education Institutions (HEIs) in relation to their functions (teaching and research), services, as well as quality of results (Reale and Potì, 2009). The rationale to explain the reluctance towards promoting diversification processes is that the Italian system (like some other European HE systems) is based on the concept of equality of universities, which implies that HEIs ought to achieve similar outcomes and, to some extent, similar performances. The measures supposed to reduce the emergence of inequalities have been: setting up rules aimed at maintaining the same mission, status, and functioning of all the universities, as well as reducing competitiveness among universities through normative constraints to their institutional autonomy. Thus, Italian HE policies in the last twenty years have not been differentiated according to the characteristics of the institutions, and have been aimed at reducing inequalities merely through quantitative investments.
We formulate the hypothesis that HE systems regulated on the basis of equality assumptions may rather develop substantial inequalities.
The literature identifies the quality of research as a crucial factor of differentiation among universities; we intend to focus on the capability of HEIs to produce high-quality scientific outputs, hence on their potential to play a significant role as research universities in the national and international competition. Thus, the hypothesis will be tested by using indicators of research quality in Italian universities deriving from the national research assessment exercise.
We look at the actual degree of equality among academic institutions in relation to research quality and we investigate whether the differences can be suitably described through some dimensions: size of the institutions; age of the institutions; teaching load; geographic location. The paper is organised as follows. The first paragraph presents the theoretical framework, describing the various types of differentiation existing across HEIs as well as the arguments supporting differentiation and those supporting equality. It is also addressed the role played by the Italian government within the differentiation process, as well as some relevant studies and sources on HEIs differentiation. The second paragraph introduces the methodological framework by describing the tests developed to measure inequality and the databases used for this purpose. The third paragraph aims at analysing differentiation in the Italian HE system compared to other HE systems and at identifying which factors drive the differentiation within the Italian context. The fourth paragraph investigates the origins of inequalities and the fifth paragraph presents the main conclusions of the paper.
1- Theoretical framework
1.1 – Diversity in Higher Education
Diversity across HEIs and differentiation processes are two recurrent themes in the political debate. According to Huisman (Huisman, 1998, p. 78), diversity “identifies the varieties of
types of entities within a certain system”, while differentiation is a dynamic concept referring to “a process in which different structures or functions develops from a formally integrated whole”.
Diversity is generally considered as a goal to be achieved in order to bring the HE system closer to the needs of society. Diversity is supposed to enable universities to deal with different requests and abilities of the students as well as to provide different learning options; it would help institutions to choose their own mission and to shape research and teaching activities accordingly, in order to respond to specific socio-economic needs and to achieve greater autonomy.
Conversely, some European countries have not favoured diversification processes in HE; instead, they have preferred to pursue a policy aimed at homogeneity across HEIs, assuming that this would ensure equity and quality of both education and research. The main consequences have been a lack of incentives for the differentiation of mission, education, and training, as well as the adoption of a common type of institution, of the same Government regulations for funding and organisation, and of homogeneous laws and relationships (Meek et al., 2000).
In recent times, the issue of diversification has been brought to the forefront of the policy debate. Diversity within the national HE system is conceived as a crucial objective to be pursued by government policies in order to improve the performance of HEIs, although this idea is still not complemented by steps forward in understanding where diversity comes from and which benefits it actually generates. As Teichler pointed out (Teichler, 2008, p. 252), Europe “was taught the lesson that deep diversification is beautiful” thanks to the influence of other non-European countries, namely the US, in relation to which the proper configuration of the HE system should be. The basic idea was that “increasing diversity of HE establishments is beneficial in terms of quantity, quality, relevance and efficiency of HE” and, although multidimensional, “the single most important dimension of diversity in HE is research quality”. Nevertheless, the author argued that the discourse on diversity is often biased by different factors, such as the lack of precise concepts of diversity and homogeneity and the lack of distinction between vertical diversity (which deals with concepts of elite, excellence, and quality) and horizontal diversity (which deals with variety in curricula and research contents). Different arguments originating in the literature have underlined the pros and cons of variety; the evidence gathered leads to conclude against solutions of over-homogenisation or over-diversification (Teichler, 2008).
As for the sources of differentiation, market mechanisms and State regulations are considered the most important drivers, although the effect of other forces (i.e. disciplines and institutional characteristics) cannot be underestimated (Fairweather, 2000).
Two recent papers dealt with the impact of the context on academic performance. Bonaccorsi and Daraio (2005), considering the sample of Italian regions, analysed the conditions under which patents and publications generate the highest spillover and found that they generate positive externalities when patenting is very intense (size - effect). Regions with a strong industrial background gain more benefit from the knowledge produced by universities; in this case, investments by companies in universities are profitable.
Dietz and Bozeman (2005) focused on the collaboration between universities and companies in the United States. Publications are negatively correlated to industrial funding. Patenting is
positively associated to industry-university exchanges, to private funding for research, and to the number of publications. Dietz and Bozeman concluded that stable careers and public funding increase publishing, while mobility and private financing increase patenting.
Diversity can be achieved through policies aimed at implementing differentiation processes across HEIs, which can affect programmes, services provided as well as functions performed (Van Vught, 2008). Government regulations can be aimed at stimulating the market behaviour of institutions or they can be geared to correct the effects of the market on HEIs, in order to pursue the equity of the system . Jongbloed highlighted different types of failures of government policies, one of them originated from the lack of effectiveness in pursuing the intended goals. This effect can occur for different reasons: because policy devices are not suited to regulate recipients such as universities, because unexpected and unintended effects emerge, because the policy costs of applying the regulations have been underestimated, or because of combined effects coming from different regulations (Jongbloed, 2004).
Van Vught (van Vught, 2008) proposed a different conceptual framework in order to explain how an increase in the HE system’s diversity might be achieved. His framework is based on the ‘open system approach’ (which assumes that the components of the HE system, the HEIs, are able to receive inputs from their environment and to deliver outputs), integrated with the population ecology and the resource dependency perspectives, which assume that HEIs need to draw resources from their environment and compete with other HEIs in order to survive. The main propositions of Van Vught’s framework are that: 1) uniformity in environmental conditions across HEIs influences the diversity of the HE system (the stronger the uniformity of the former, the lower the diversity of the latter); 2) academic norms and values in a HEI affect the level of diversity of the HE system with the same intensity as the environmental conditions.
It is important to remind that one can distinguish between horizontal and vertical differentiation, where the former makes reference to the different missions, institutional types or profiles of the HEIs, while vertical diversity points out the degree of hierarchical stratification in terms of quality of research and teaching. In our paper we will focus on the vertical differentiation, focusing on processes affecting the differentiation of the research performance. Rossi (2010) pointed out that vertical diversity is favoured by processes such as: resource allocation based on productivity and leading to concentration and Matthew effect, government policies aimed at bolstering explicit categories of research universities, ranking of universities, etc.; on the contrary, processes hampering vertical diversity are the the lack of institutionalized mechanism for comparison, shared political culture in favour of the equality principle, legal values of degrees, constraints to financial autonomy, limited mobility of positions (internal career pattern, disciplinary academic control over admissions and progressions).
On the base of the existing literature, Huisman and other colleagues (Huisman et al., 2007) outlined that there are at least two main reasons for which empirical investigations of diversity are indispensable. The first is that it is important to understand how and why diversity evolves through time or differs, otherwise policies be ill-informed and run the severe risk of being ineffective. A second theoretical reason regard the role of fostering and impeding factors of diversity, which is a major issue in organizational studies; while there are competing explanations, the Higher education is a very suitable field to verify the impact of
regulation, which is often seen as an impeding factor, and market forces, which are often esteemed as fostering factors.
1.2 The Italian HE system
The case under investigation in this paper is that of Italy. Italy is traditionally characterised by a strong and persistent preference towards homogeneity in the HE system, which has always been justified on the basis of equity assumptions. When in the mid 1990s universities were granted substantial autonomy, the political discourse stressed the need to use autonomy as a source of diversification in the HE system, in terms of curricula offered and research specialisation, with strong attention to local needs. But, at the same time, the existing laws and regulations as well as the relationships between academics, HEIs and the Government have not not change. Specific constraints to the autonomy of the universities are still retained: universities are not differentiated in their formal mission, they cannot modify their tuition fee threshold, their budget for the cost of personnel is defined by the State as well as the status of their professors and the level of their salaries; the core funding is largely allocated on the basis of historical patterns and not on the basis of evaluation results (Reale and Potì, 2009). This orientation has been largely supported by the academics, who feared that pursuing differentiation would increase competition among HEIs and weaken the homogeneity of the system, reducing academic freedom (identified as a source of quality) and reinforcing the steering capabilities of the institutional level (Capano, 2008).
Bonaccorsi and Daraio (2008) used positioning indicators to analyse differentiation among the strategic profiles of universities. They track the position and evolution of universities with respect to their research orientation (intensity of PhD recipients out of the total student population) and intensity (publications per capita), their curricular offer (generalist vs. specialised), their growth rate, and their degree of autonomy. Italy shows little dispersion around the mean for the indicators of both research orientation and intensity, in comparison to other European countries. The authors explained this situation as a result of the lack of incentives for strategic differentiation across universities.
Halffman and Leydesdorff (2009) analysed the level of inequalities among universities by applying GINI coefficient to universities in the Shanghai ranking and to SCI publications in natural sciences. The aim was to investigate the level of inequality, both on a worldwide scale and at the level of individual nations, through trends in publications. The authors suggest “an ongoing homogenisation in terms of publication and productivity patterns among the top 500 universities in the world” and they explain the homogenisation as follows: on the one hand, the Mathew effect may have reached its limit in generating concentration of reputation and resources; on the other hand, isomorphic pressures may have pushed universities towards producing similar levels of SCI outputs. These results show that a small number of elite HEIs has a similar publication behaviour and development pattern , but they tell us little about inequalities in the overall HE system.
The picture provided for Italy, using the Shanghai ranking, shows no major shifts in equalities in the considered period (2003-2008) but a small decrease in output inequalities across universities in terms of overall output and productivity. Italy is more equal than systems oriented towards differentiation (the UK and the US) and less equal than countries belonging to the continental tradition and pursuing equality. Moreover, Italy has historically been
characterised by strong geographical inequalities – affecting the amount of resources available for research activities (Reale, 1992) – and these geographical imbalances continue to exist to this day (Svimez, 2009; Reale, Pedron, Seeber, 2008).
Since the mid 1980s the Italian government has implemented policy measures to support the growth of the Higher Education system, with a particular orientation towards regions located in the South of Italy. Interventions by the government can be divided into two phases.
The first phase, implemented from the late 1970s to the late 1990s, aimed at setting up new public universities and at increasing research personnel. Table 1 shows that 9 out 24 (37,5%) southern universities were established in that period. These universities were generally small in size and generalist; yet, they shared the same mission and objectives as the other universities in the country, they were given the same status, and they were granted the same level of autonomy.
Table 1
The growth of research personnel in southern universities has lasted until nowadays, as shown in table 2, reasonably also as a consequence of the creation of new universities in the 1990s. Table 2
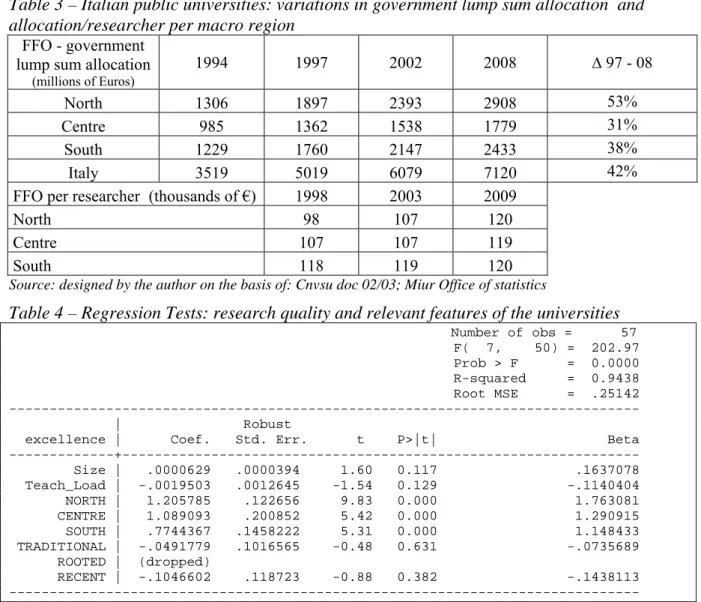
The second phase started in late nineties and targeted all the universities. It has been characterised by the introduction of a mechanism – the so-called “quota di riequilibrio” – to rebalance the allocation of core funding according to teaching productivity in terms of students weighted per discipline. The effects of such mechanism are highlighted in table 3 and table C in the appendix. It can be noted that because southern and central universities were overfunded, thus on average their budgets have grown less than the budgets of the northern ones.
Table 3
To sum up, during the first phase, government policies to compensate inequalities due to geographic location mainly relied on increasing available resources and rebalancing allocations in relation to other universities in the country. These goals prevailed over the implementation of incentives and regulations aimed at promoting virtuous behaviour among HEIs. From the late 1990s onwards, universities in the South have experienced the same conditions and the same reform processes of the other universities, and have suffered the same drawbacks. HE reforms in Italy have tried to steer the professional self-government from national - discipline to individual universities, in order to stimulate cooperation within each institution and inter institutional competition. Universities have become more important; for instance, they have been granted large autonomy in the recruitment process and they have attained a high degree of administrative and expenditure freedom. Nevertheless, the implementation of this policy has been incomplete, given the lack of effective evaluation processes and weak funding leverage. Some limitations to university autonomy supposed to ensure the equity of the system have not been removed. No adequate connections between powers and responsibilities of the management have been established (Reale and Potì, 2009; Seeber, 2009). Thus, autonomy has often been misused: there have been many scandals and, at present, some universities suffer severe financial problems.
We intend to verify if Italian universities have preserved their homogeneity, thus retaining equity and quality. Our expectation is that, since they cannot avoid competing for funding,
visibility, and reputation, a number of diversification processes have occurred, though they have been counterbalanced by regulations based on equality assumptions, which ensure the formal recognition of the same importance and status to all the universities. We wish to seek for evidence that diversities existing in the Italian HE system are coherent with Van Vught’s proposition, which predicted that large differences in the environmental conditions of HEIs would produce a high level of diversity in the HE system.
2- Methodology and sources
To test the hypotheses, this paper will refer to the analysis made by Halffman and Leydesdorff (2009), who studied inequality of university research performance in different HE systems. The results of their work will be integrated with OECD data to provide a deeper outlook on the inequality of the Italian HE system compared to other HE systems.
The research performance of the Italian HE system will also be investigated through the results of the national research assessment exercise (VTR 2001-2003). The VTR was promoted by the Ministry in early 2003 and developed by the CIVR in 2004. The aim of the VTR was to provide the Ministry with information about the excellence of research produced by HEIs. Each university submitted one scientific output (i.e. article, book, etc.) for each four researchers; considering co-authorships, about one third of all the researchers saw at least one of their products judged. The outputs could be submitted across 14 disciplines and 6 special areas. The special areas had a limited role in the overall assessment and they are not considered in this analysis. The evaluation was managed by a panel of experts for each discipline, with the support of external peers. Every product was evaluated by two peers (blind peer review) and, in the case of conflicting judgments, a third assessment was required. The outputs could be rated:
Excellent (E)= 1 - the product is within the top 20% of the value scale shared by the international scientific community
Good (G) = 0.8 - the product is in the 60-80% segment; Acceptable (A) = 0.6 - 40-60% segment;
Limited (L) = 0.2 - within the bottom 40%
The VTR peer review process has been accepted by the academia and the evaluation method has been considered reliable (Reale et al., 2007; Schiantarelli F., 2006,). Some have disputed the ability of the VTR to represent the quality of institutions, the main argument being that one publication every four researchers is not enough to take into account the productivity of institutions. Moreover, the analysis of institutional performance carried out using ISI datasets shows a positive, though weak, correlation with peer review when productivity is taken into account by using bibliometric methods (Aksnes and Taxt, 2004).
Nevertheless, some counterarguments may be mentioned:
- According to ISI data, the Italian publications produced in the 2001-2003 period were around one hundred thousand. 17.3 thousand scientific publications were submitted by HEIs and public research organisations and evaluated in the VTR; research institutions were supposed to select the best publications. The VTR sample cannot be
representative of all the excellent outputs; however, the well-known Pareto principle (20/80 rule) states that for some events roughly 80% of the effects come from 20% of the causes. Also in research it can be reasonably argued that a significant share of the best publications contributes to the largest part of knowledge advancementi (this assumption is also developed by Derek, 1962). Thus, the VTR publications can be regarded as a good sample to represent the performance of institutions.
- Some argue that the outputs submitted for evaluation are not the best ones but the ones by the most prestigious and influential researchers. Nevertheless, the selection of a poor product would have endangered the reputation of influential researchers; thus, the effect of academic power on the selection process must have been limited. Some Italian universities had direct experiences in relation to this issue, with evidence of correct selection processesii.
- The Excellent segment was not saturated: no university received only excellent ratings for its products in any of the 14 disciplines; moreover, the share of products rated excellent was 30%. Thus, the VTR sample seems to suitably comprise the best scientific production.
- VTR results homogenously represent performance in all the disciplines. On the contrary, ISI has often been criticised for not suitably considering socio-humanistic disciplines, only taking into account scientific articles while discarding monographic works and articles published in important journals written in national languages (Figà Talamanca, 2000; Seglen, 1997).
- VTR results provide qualitative evaluations across all disciplines, while ISI publications do not provide any qualitative differentiation: the Impact Factor and Citation Indexes are approximations of the impact respectively of journals and of papers, rather than an indication of quality (Weingart, 2005).
The analysis makes use of a synthetic indicator (UQy – “excellence indicator”), which measures the capability of a university to produce outputs that are high quality (rated ‘excellent’) and written by a majority of authors from said university. The choice of a quality indicator based on excellence and property was preferred to the average rating because, while it does not change quality ranking, it better highlights variations across universities and the existence of scientific leaderships.
Box 1 – Indicator of the Quality of University y (UQy)
N PRODx PEERx UQ x y ) % / (% 14 1
x PEER% = University ownership of excellent products as share of the total ownership in discipline x.
The ownership is given by the ratio between the number of authors working in the university who submitted articles and the total number of authors.
% PRODx= Products submitted by the university as share of the total products submitted in discipline
x.
N = Number of disciplines in which university y has a significant % PRODx : %PRODx>0.2% for each
Example
University y submits products in two disciplines: mathematics and chemistry.
In mathematics, a total of 1,000 scientific products are submitted at the national level; 200 products are judged ‘excellent’.
University y submits 30 articles. 14 products are judged excellent: 6 are written only by authors from university y, 6 are coauthored at 50% by researchers of other universities. Thus, university y ‘owns’ 10 excellent articles: 6 + 8*0.5.
% Peer math = 10/200 = 5 % % Prod math = 30/1000 = 3%
In chemistry a total of 1,500 products are submitted; 400 are judged excellent.
University y submits 54 articles. 15 products are judged excellent: 7 articles are full property, as for the other 8 articles one out of four authors works in university y. Thus, university y ‘owns’ 9 excellent articles: 7 + 8*0.25. % Peer chem = 9/400 = 2.25 % % Prod chem = 54/1500 = 3.6%.
N PRODx PEERx UQ x y ) % / (% 14 1
PRODchem N PEERchem PRODmath PEERmath x x / ) % % % % ( )/2 1.145 6 . 3 25 . 2 3 5 ( The indicator summarises university performance in one value. Each discipline contributes with the same weight to the performance of the university, even if a threshold is set in order to exclude minor disciplines.
An alternative solution might have been that of considering disciplines based on the number of products submitted by the university. However, this solution would have favoured major disciplines and those universities that concentrate productivity and quality on just a few disciplines. On the contrary, we deem that university excellence also lies in the fact that quality is somehow homogeneously distributed across disciplines.
The data from Italian public universities that are considered in this research regard those institutional features that are believed to impact research performance (see Table A in the Appendix).
The selected features are:
- Size, in terms of number of professors. The underlying hypothesis is that bigger universities are likely to have better performance, since they benefit from more critical mass in investments and human resources.
- Age of the university. Older universities are supposed to have better performance, because they benefit from an accumulation of knowledge and experience through time.
- The teaching load depends on the students/professors ratio; a heavy teaching load is supposed to reduce the time devoted to research and, as a consequence, to have a negative impact on performance.
- Geographical location. Because of the economic imbalances of the Italian regions, Universities located in the North and Centre of the country are supposed to achieve higher performance than universities located in the South because of the influence of the social and economic context.
The literature considers all the aforementioned features as key factors impacting the HEIs performance. For instance, size and age are crucial elements for improving the internationalisation of the HEIs (Geuna, 1998) and the literature on rankings show the
importance of the size for a high level research performance of the institutions (Zitt and Filliatreau, 2007). The strong weight of the teaching duties is questioned for being one element that might inhibit the research productivity (Frank Fox, 1992; Bellas Marcia, 1999; Noser et al., 1996), while geographical location is a factor related to proximity with firms and stakeholders, which could impact the funding capability of the HEIs (Audretsch and Stephan, 1996; Lindelöf and Lofsten, 2004).
The following paragraphs will present correlation tests and a regression analysis between the performance indicator and the features of the universities, in order to test whether or not these are linked to performance.
3- Measuring inequality in the Italian system
Italian Government has traditionally been oriented towards equality and homogeneous performance of the HEIs. Despite this orientation, the quality of research and education is rather differentiated. For instance, VTR results show that research performance is heterogeneous across universities (see Table A in the Appendix); universities also display different teaching loads (professors-students ratio, Table A), different rates of student satisfaction (Cammelli et al., 2006), and different employment rates of graduates (Cammelli, 2009).
How much is the Italian HE system differentiated when compared to other HE systems? We can use the research output as an indicator of differentiation. Besides the limits of the Shanghai ranking outlined in the literature (van Raan, 2005), it is interesting to look at the Halffman and Leydesdorff (2009) work, which adopts the GINI coefficient to measure inequality among the top 500 universities of the Shanghai ranking (ARWU, available at http://www.arwu.org/rank/2007/ranking2007.htm). The GINI coefficient ranges from zero (maximum equality) to one (maximum inequality). Italian universities are more equal than the world average (GINI coefficient: 0.143 compared to 0.192; 2003-2008 period), but less equal than countries like Germany (0.113), the Netherlands (0.114), and Sweden (0.112). The limit of this analysis is that it considers a small number of universities; only 22 Italian universities are included in the Shanghai ranking, representing roughly one third of Italian public universities., If the average number of articles produced per researcher is considered, then the Italian productivity (478) is higher than productivity of countries that are much more represented in the Shanghai, such as Germany (419, 12th), France (329, 15th )iii. The gap between high individual productivity and the small number of Italian universities may depend on the fact that Italian universities not included in the ranking are very productive but still too small to appear.
The analysis of quality distribution across Italian universities can be improved by using data provided by the VTR and the UQy indicator. When using this different indicator, the GINI coefficient of the sample of Italian universities included in the Shanghai ranking is 0.125. But when the entire sample of public universities is considered, the GINI coefficient is much higher: 0.202 (GINI calculation through the Wessa website http://www.wessa.net/). This means that the sample of universities in the Shanghai ranking is not representative of the inequality of the entire system.
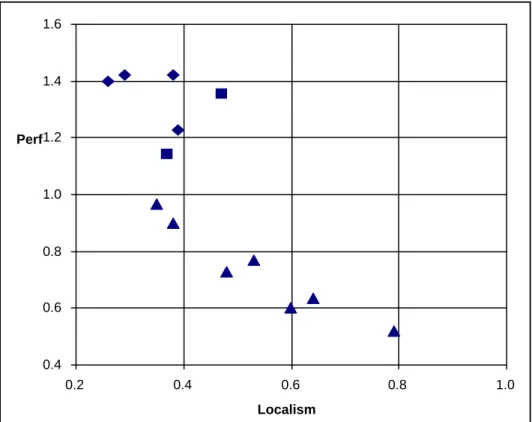
We use VTR data to investigate qualitative differentiation in relation to the four institutional features mentioned in the methodology section (see also Appendix – Table A). Table 4 shows the results of a linear regression analyses. The excellence indicator is assumed as dependent variable. The size of the institution and the teaching load have high P values, hence the significance is not sufficient. Dummy variables have been created to study the impact of the other two variables: the age and geographical location of the institution. The age of the institution does not have a significant connection with performance: P values are very high. The geographical location is the most impacting, relevant and significant factor: universities in the north display a slightly better performance than universities located in the centre, while universities in the south perform much worse.
Table 4
4- Explaining inequalities
We have identified the geographical location as the key variable for university performance: social, cultural, and economic contexts affect the performance of universities. It is now possible to deepen the analysis by exploring more specifically the role played by the economic context on the one hand and by the social-cultural context on the other hand.
4.1 The influence of the economic context
A large portion of the literature supports the concept that market investment is a key factor in research performance. We adopt a broad definition of ‘market’, in order to point out the positive influence that a wealthier economic context may play by providing more funding opportunities, not only through the exchange of services and resources with firms but also thanks to other non-governmental actors interacting with HEIs. Thus, the ‘market’ includes private, public and semi-public institutions, firms and non-profit organisations.
We first control the effect of rich economic contexts on the scientific performance, assuming that a larger potential amount of funding can be attracted. The North is the richest part of Italy, the Centre is in a mid position, while the South is the least economically developed macro region.
Moreover, research expenditure is very different across the disciplines. In some disciplines, laboratories and scientific devices are very important for research activities and they are often very expensive. Thus, we may suppose differences in discipline sensitivity to the wealth of the economic context. This link is investigated by grouping disciplines into two sets. The first group includes seven disciplines that benefit most from interacting with a rich economic context, because they can obtain a significant share of funding from firms and non-profit institutions. We identified the two groups considering research revenues classified by type of funding institution (source: VTR 2001-3).
The Pearson correlation between GDP per person and UQy is high (0.66). At first glance, this result seems to confirm that economic wealth plays an important role in university research performance. Nevertheless, a second test is required to deepen the analysis about the link between the economic wealth of the context and university performance.
- the number of disciplines in which performance is higher than the national average; - the average gap between regional performance and national performance.
Given the previous assumption, we expect that the northern macro regions will perform better than the South, especially in the group of disciplines that have more interactions and funding opportunity from the economic context. Performance is measured by the UQy indicator of excellence, calculated for the overall macro region.
Table 5
The results contradict the assumptions: the gap is similar in the two groups of disciplines. Hence, the economic wealth of the context is not the sole factor affecting imbalances in institutional performance: the functioning of the institutions must be correlated to factors other than the local economic wealth.
4.2 The influence of the social and cultural context
The wealth of the cultural and social context can be expressed by several dimensions. We assume that two factors might have a strong relevance for the Higher Education system. The first is internal to the university system: meritocracy in the recruitment process. The second element is external: the educational attainment of the young population, referring to the pool from which future researchers will be picked.
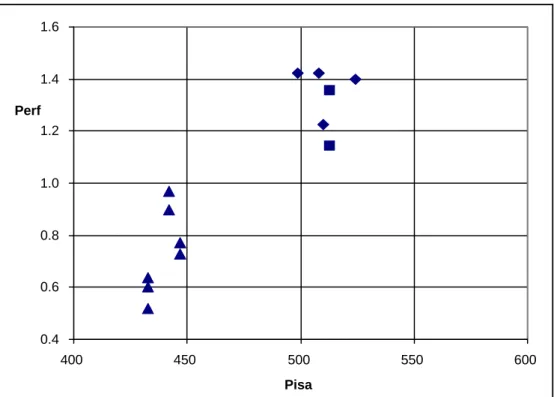
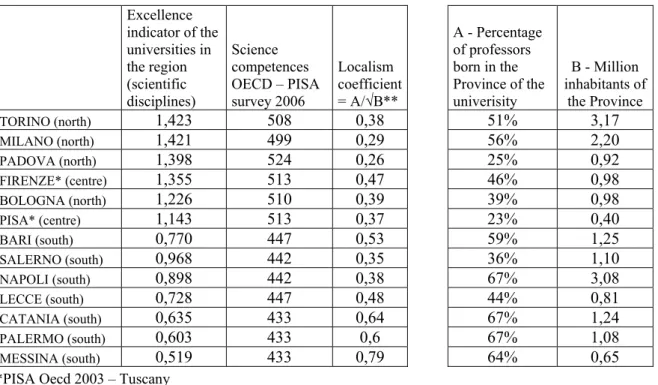
The first factor can be measured by an indicator of the opening up of the recruitment process in universities. Since the early 1990s, Italian universities have been enjoying complete autonomy in the personnel selection process. Nevertheless, recruitment has been heavily affected by the trend to hire personnel within the university: between 2000 and 2006, 93% of the new Full Professors and 75% of the new Associate Professors had already been working in the university that recruited them (Seeber, 2009). Researchers recruited were often born and have studied in the city where the institution is located. Figure 1 considers a sample of Italian universities and maps them according to their performance and their degree of localism in the recruitment process. The ‘localism coefficient’ is calculated by considering the population of the province (see Appendix - Table B). Localism coefficient is higher in the South (0.54) than in the Centre (0.42) and North (0.33).
University in the North University in the Centre
University in the South
Figure 1
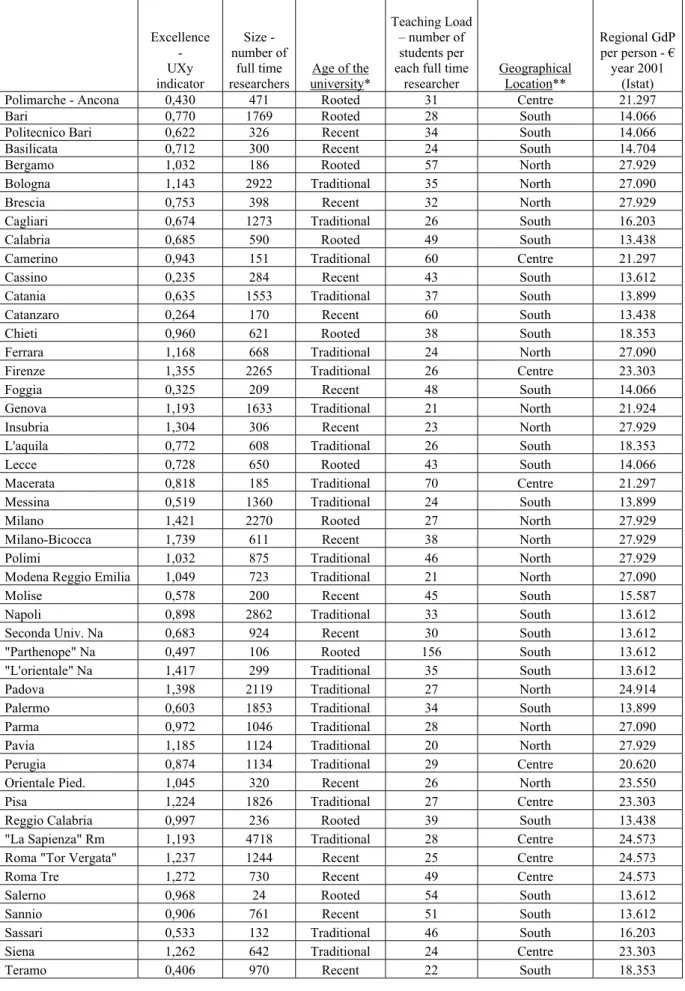
Educational attainment of the young population can be estimated on the basis of student skills as assessed by the PISA survey (OECD, 2006). Italy is indeed characterised by high internal inequality in the skills of students. The PISA survey shows a great gap in scientific skills between students in the North and South of the country: for instance, Friuli has the same score
as Canada, which ranks second among OECD countries, while Sicily is just above the result of Turkey, the second last score. In Figure 2, each university is positioned on a chart according to its performance and to the PISA result of the region where it is located (see Appendix - Table B). PISA results are also a proxy of the quality of the human resource pool from which universities may recruit research personnel.
Figure 2
The linear regression developed in table 6 shows very robust results with both localism and skills of students, which are strongly linked to the performance of the universities. Localism is linked to worse scientific performance (beta -0.36), while good student skills are strongly linked to good performance (beta 0.67). Thus, the lower performance of universities in the South seems to be related to a negative mix of higher localism and worse educated human resource pools, which together indicate a poor social and cultural context.
Table 6
4.3 The influence of the HEIs
For a long time universities in the South of Italy were burdened by heavy teaching load and insufficient personnel. Moreover, economic imbalances were perceived as a major problem for the development of the HE system in the South. Governmental policies tried to fill this gap by providing more resources, especially by increasing the number of universities. A large number of personnel has been recruited: between 1997 and 2009 the research personnel in southern universities grew by 36%, compared to 25% in the North and 22% in the Centre. Recently created universities have experienced a fast expansion, while growth has been moderate in traditional universities. We can compare the performance of recent and traditional universities, in the South and in the North in order to see if the gap has been reduced.
Table 7
Table 7 shows that the creation of new universities in the South and the increase in personnel have further broadened the qualitative gap between North and South. The provision of more resources has not succeeded because the problem goes beyond the gap in the number of universities and researchers. The low performance of universities in the South cannot be ascribed to less public funding either, as general public allocation per full time researchers and even per weighted students has traditionally been higher here than in the North and Centre (table 3 and table C in the appendix).
We can therefore suppose that some important factors have not been considered. At least two of these factors are worth mentioning.
First, the lack of meritocracy both at the system and university level. Public policies have increased resources for universities without introducing incentives for their correct use; this may have increased nepotism and wastes. Gagliarducci et al. (2005) argue that the extreme localism of Italian HEIs and their inability to attract foreign researchers are not due to the lack of financial resources but rather to the lack of proper incentives, such as the link between wages and research and teaching productivity.
Second, the fast growth in the number of researchers. When recruitment rapidly accelerates, then the group of excellent applicants may be exhausted and universities might be compelled to hire less talented applicants (De Marchi and Reale, 1996). Moreover, the literature suggests that in recent years the quality of the recruitment process has decreased (Bonaccorsi and Daraio, 2007; Capano, 2008) and, as a consequence, universities with a recent expansion have probably been affected more severely by this phenomenon. One element seems to support this hypothesis: the correlation between the research personnel growth rate and the performance indicator in 1997-2003 is negative (-0.39). Nevertheless, the fact that recently established universities in the North are still able to achieve good performance shows that localism exacerbates the problem, because some universities do not look for excellent researchers in other regions.
5- Concluding remarks
This paper has investigated the hypothesis that HEIs regulated on the basis of equality assumptions may rather develop substantial inequalities. We have considered the case of Italy, since Italian HE institutions have never been differentiated from one another and differentiation of institutions has not been pursued.
The internal differentiation of the Italian HE system has been studied by examining the results of the national research assessment exercise (VTR). The results show that research performance is better and more homogeneous among universities in the North and Centre of the country, the wealthiest parts of the national territory, while it is worse and more skewed in the South. However a further analysis shows that the scientific performance both at the institutional and discipline level is not correlated to the wealth of the economic contexts: good and bad performances are homogeneously distributed across disciplinary areas, regardless of the importance of the market support.
The results are also consistent with the literature that investigates the impact of the economic development of a given context on academic performance, showing that the context may influence the performance only under certain conditions (i.e. intense patenting activity) and for some disciplines (i.e. engineering), but this influence does not always produce good results in terms of research publications.
During the 1980s and 1990s, the Italian Government tried to fill the gap between the North and the South of the country by setting up new universities. Beside this intervention that led
to a fast growth in research personnel, the difference in the performance of southern and northern universities seems to have increased rather than been reduced. This outcome suggests for further research on whether policies aimed at reducing inequalities may rather increase them, as they do not intervene on the real causes of inequality. Two elements may have influenced public policies in Italy, thus generating counterproductive results: the first is the absence of meritocracy in the recruitment process, which eliminates any incentive to recruit the best researchers. The second element is the educational attainment of the young population, referring to the pool from which future researchers will be picked. Recruitment has been affected by localism (the privilege of the ‘local’ candidates), whose negative effects are particularly severe when combined with a context of poorly skilled human resource pools. In this way, differentiation connected to geographic location is likely to generate inequalities through a vicious circle.
It might be useful to recall the effects of “civicness”, i.e. social capital, on institutional performance of the Italian Regions studied by Putnam (1993), showing that civicness is much more important in explaining performance than the wealth of the economic context. Social capital is enhanced by horizontal, cooperative, and mutually supportive relations, which improve the functioning of complex organizations and society as a whole. Putnam argued that even a highly civic individual behaviour may be negatively affected by the un-civic social context and that path dependency tends to reinforce the negative impact of the lack of civic traditions. Our evidences on higher education do not contradict the Putnam’s assumption about the crucial effect of factors other than the market on institutional performance. This would imply that policies promoting equality might create imbalances rather than eliminate them. Thus, looking for empirical evidences about the effects of low civicness of the Regions located in the South of the country on HEIs performance might be a fruitful approach for further investigation on the causes of inequalities.
Our results allow for one policy recommendation. HE policies aimed at preserving equality in the HE system might have unintended consequences when they do not consider the real sources of inequality. Thus, pursuing differentiation might be a crucial element to strengthen equality, under certain conditions. In this respect, Van Vught’s framework for attaining diversity might be a useful reference.
References
Aksnes, D.W. and Taxt R. E. (2004), ‘Peer review and bibliometric indicators: a comparative study at a Norvegian University’, Research Evaluation 13: 33-41
Audretsch, D. B. and P. Stephan (1996), ‘Company-scientist locational links: the case of biotechnology’, American Economic Review 86(4): 641-652
Bellas Marcia, L.(1999) ‘Faculty Time Allocations and Research Productivity: Gender, Race and Family Effects’ The Review of Higher Education - Volume 22, Number 4, Summer 1999, pp. 367-390 Bonaccorsi, A. and Daraio, C., (2005), ‘Exploring size and agglomeration effects on public research productivity’, Scientometric 63(1): 87-120
Bonaccorsi, A. and Daraio, C. (2007), ‘University autonomy an structural constraints in the Italian system’, in Bonaccorsi A. and Daraio C. (eds), Universities and strategic knowledge creation, Edward Elgar, pp 241-271
Bonaccorsi, A. and Daraio, C. (2008), ‘The differentiation of the strategic profile of higher education institutions. New positioning indicators based on microdata’, Scientometrics 74: 15 - 37
Cammelli, A (2009), ‘XI Rapporto sulla condizione occupazionale dei laureati’. ALMALAUREA indagine 2008
Cammelli, A., Cesetti, S., Cristofori, D. (2006) ‘I servizi per gli studenti: le opinioni dei laureati su università, città e diritto allo studio’
http://www.almalaurea.it/universita/altro/servizi_studenti/servizi_citta-sito.pdf
Capano, G. (2008), ‘Looking for serendipity: the problematic reform of government within Italian universities’, Higher Education, 55: 481-504
De Marchi, M. and Reale, E. (1996) ‘Premi Nobel e analfabeti: due mondi indipendenti?’, il Mulino 1/96: 106-118
Derek J. De Solla Price (1963) Little Science Big Science, Columbia University Press
Dietz, J. and Bozeman, B. (2005) ‘Academic Careers, patents, and productivity: industry experience as scientific and technical human capital’, Research Policy 34: 349-367
Dresch, S. and Janson, K. (1987) ‘Giants, Pygmies, and the Costs of Fundamental Research or Price Revisited’, Technological Forecasting and Social Change 32: 323- 340
Fairweather, J S. (2000), ‘Diversification or homogenization: how markets and governments combine to shape American higher education’, Higher Education Policy 13: 79-98
Figà Talamanca, A. (2000), ‘L'Impact Factor nella valutazione della ricerca e nello sviluppo dell’editoria scientifica’, IV Seminario Sistema Informativo Nazionale Per La Matematica, Sinm 2000; Lecce, Lunedì 2 ottobre 2000
Frank Fox, M. (1992) ‘Research, teaching and publication productivity: mutuality versus competition’, Sociology of Education, 65, 4, 1992, pp. 293-305
Gagliarducci, S., Ichino, A., Peri, G., Perotti, R. (2006) ‘Lo Splendido Isolamento dell’Università Italiana’, in T. Boeri, R. Faini, A. Ichino and C. Scarpa (eds). Oltre il declino, Bologna: il Mulino, 2006 pp 157-222
Geuna, A. (1998), ‘The internationalisation of European Universities: A Return to Medieval Roots’, Minerva, 36, 253-270
Halffman, W. and Leydesdorff, L. (2009) ‘Is Inequality Among universities Increasing? Gini Coefficients and the Elusive Rise of Elite universities’,available at
http://www.leydesdorff.net/UniversityGini/index.htm
Huisman, J. (1998), ‘Differentiation and diversity in Higher Education Systems’, in Smart John, C. (eds). Higher Education Handbook of Theory and Research, Volume XIII, Agathon Press, pp. 75-110 Huisman, J., Meek, V.L., Wood, F. (2007) ‘Institutional Diversity in Higher Education: a Cross-National and Longitudinal Analysis’ Higher Education Quarterly, 0951–5224 Volume 61, No. 4, October 2007, pp 563–577
Jongbloed, B. (2004) ‘Regulation and competition in Higher Education’, in Dill, D., Texeira, P., Jongbloed, B., Amaral, A. (eds). Markets in Higher Education, Kluwer, The Netherlands, p. 87-111 Lindelöf, P. and Löfsten, H. (2004). ‚Proximity as a resource base for competitive advantage: University-industry links for technology transfer’, Journal of Technology Transfer 29, 311–326
Meek, V.L., Goedegebuure, L., Huisman, J. (2000), ‘Understanding diversity and differentiation in higher education: an overview’, Higher Education Policy 13: 1-6
Noser, T. C., Manakyan, H., Tanner, J.R. (1996), ‘Research productivity and perceived teaching effectiveness: a survey of economic faculty’, Research in Higher Education, 37, 3, pp. 199-221
Oecd (2006) PISA survey 2006, Oecd, Paris
Reale E. (1992), Il sistema universitario nel Mezzogiorno, Angeli, Milano
Reale, E., Barbara, A., Costantini, A. (2007), ‘Peer review for the evaluation of the academic research: the Italian experience’, Research Evaluation 16(3): 216-228
Reale, E., Pedron, L., Seeber, M. (2008), ‘Gli squilibri territoriali della ricerca pubblica italiana’, in Reale E. (ed.), La valutazione della ricerca pubblica, Franco Angeli, Milano
Reale, E., Potì, B. (2009), Italy. ‘Legal policy legacy and moving to an “in-between” configuration’, in Paradeise C, Reale E, Bleiklie I and Ferlie E., University Governance: Western European
Comparative Perspectives, Dordrecht, Springer, pp 77-102 Perotti, R. (2008), L’università truccata, Einaudi, Milano
Putnam, R. (1993), Making Democracy Work: Civic Traditions in Modern Italy, Paperback, trad. it. La tradizione civica delle regioni italiane, Il Mulino, Bologna
Rossi, F. (2010) ‘Massification, competition and organizational diversity in higher education: evidence from Italy’, Studies in Higher Education, 1470-174X, Volume 35, Issue 3, First published 2010, Pages 277 – 300
Schiantarelli, F. (2006), ‘Un passo nella giusta direzione’ http://www.lavoce.info/articoli/pagina1984.html
Seglen, P. O (1997), ‘How representative is the journal impact factor?’, BMT, 314, 497. Available at http://bnj.bnjjournals.com/ cgi/content/full/314/7079/497
Seeber, M. (2009) ‘Changes in the governance of the Italian Higher Education system, the role of evaluation and funding as steering tools of research’, PhD Dissertation, Department of Science, University of Chieti-Pescara
Svimez (2009). Rapporto Svimez 2009 sull’economia del Mezzogiorno, Svimez, Roma Teichler, U. (2008), ‘Diversification? Trends and explanations of the shape and size of higher
education’, Higher Education 3: 349-379
Van Raan, A.F.J. (2005), ‘Fatal Attraction: Conceptual and Methodological Problems I the Ranking of Universities by Bibliometric Methods’, Scientometrics, 62, 1, p. 133-143
Van Vught, F. (2008), ‘Mission Diversity and Reputation in Higher Education’, Higher Education Policy, 21, 151-174
Weingart, P. (2005) ‘Impact of bibliometrics upon the science system: inadvertent consequences?’, Scientometrics 62(1): 117–131
Zitt, M. and Filliatreau, G. (2007) ‘Big is (Made) Beautiful – Some comments about the Shanghai ranking of World-Class Universities’, in Sadlak J. and Cai Liu Nian (eds), The World-Class University and Raning: Aiming Beyond status, Bucarest, UNESCO-CEPES, pp. 141-160
Table 1 – Establishment of new universities in Italy
NEW UNIVERSITIES IN THE SOUTH
1990-1999 10 6
1982 5 2
1978-1979 3 1
1972 1 1
1968-1969 4 2
Total public universities 57 24
Source: designed by the authors according to MiUR and CNVSU data
Table 2 – Italian public universities: variations the number of researchers
Full time research personnel 1997-1998 2002-2003 2008-2009 ∆ 1997/8 - 2008/9
North 19,352 22,289 24,210 25%
Centre 12,702 14,382 14,956 18%
South 14,859 18,102 20,250 36%
Italy 46,913 54,773 59,416 27%
Source: designed by the author on the basis of: Cnvsu doc 02/03; Miur Office of statistics
Table 3 – Italian public universities: variations in government lump sum allocation and allocation/researcher per macro region
FFO - government lump sum allocation
(millions of Euros) 1994 1997 2002 2008 ∆ 97 - 08 North 1306 1897 2393 2908 53% Centre 985 1362 1538 1779 31% South 1229 1760 2147 2433 38% Italy 3519 5019 6079 7120 42%
FFO per researcher (thousands of €) 1998 2003 2009
North 98 107 120
Centre 107 107 119
South 118 119 120
Source: designed by the author on the basis of: Cnvsu doc 02/03; Miur Office of statistics
Table 4 – Regression Tests: research quality and relevant features of the universities
Number of obs = 57 F( 7, 50) = 202.97 Prob > F = 0.0000 R-squared = 0.9438 Root MSE = .25142 --- | Robust
excellence | Coef. Std. Err. t P>|t| Beta ---+--- Size | .0000629 .0000394 1.60 0.117 .1637078 Teach_Load | -.0019503 .0012645 -1.54 0.129 -.1140404 NORTH | 1.205785 .122656 9.83 0.000 1.763081 CENTRE | 1.089093 .200852 5.42 0.000 1.290915 SOUTH | .7744367 .1458222 5.31 0.000 1.148433 TRADITIONAL | -.0491779 .1016565 -0.48 0.631 -.0735689 ROOTED | (dropped) RECENT | -.1046602 .118723 -0.88 0.382 -.1438113 --- Source: elaboration by the authors
Table 5 – Economic context and scientific performance: discipline sensitivity
Macro Region
Group 1: more funds from economic context Group 2: less funds from economic context
Number of disciplines (out of 7) with performance better than
the average
Average performance gap (on a 0.2 – 1
scale)
Number of disciplines (out of 7) with performance better than the average (on
a 0.2 – 1 scale) Average performance gap (on a 0.2 – 1 scale) North 6 + 0.23 7 +0.18 Centre 4 -0.07 5 +0.08 South 0 -0.27 0 -0.31
Source: designed by the authors on the basis of Civr-VTR data
Figure 1 – Relationship between Research Performance and Localism
Source: elaborated by the author on the basis of: Civr-VTR data; Perotti, 2008; ISTAT.
0.4 0.6 0.8 1.0 1.2 1.4 1.6 0.2 0.4 0.6 0.8 1.0 Localism Perf
Figure 2 – Relationship between Research Performance and students’ educational attainment
Source: elaborated by the author on the basis of: Civr-VTR data; Perotti, 2008; ISTAT.
Table 6 – Linear regression excellence indicator, students’ scientific skills and localism coefficient
Linear regression Number of obs = 13 F( 2, 10) = 81.59 Prob > F = 0.0000 R-squared = 0.9220 Root MSE = .10347 --- | Robust
exc | Coef. Std. Err. t P>|t| Beta ---+--- pisa | .0060753 .0010395 5.84 0.000 .6789653 localism | -.8141233 .1792549 -4.54 0.001 -.3630232 _cons | -1.493308 .5356125 -2.79 0.019 . --- Source: elaboration by the authors
Table 7 – Performance of universities -UQy indicator
Universities in the South Universities in the North % gap North vs. South
Recently established universities 0.53 1.13 115%
Traditional universities 0.76 1.16 53%
Personnel growth rate: high 0.61 1.14 88%
Personnel growth rate: low 0.89 1.26 42%
The value ‘1.00’ indicates the National average performance. The samples of recent and traditional universities are in appendix A
Source: elaboration by the authors
0.4 0.6 0.8 1.0 1.2 1.4 1.6 400 450 500 550 600 Pisa Perf
APPENDIX
Table A – Italian public universities, excellence in the VTR and main features
Excellence - UXy indicator Size -number of full time researchers Age of the university* Teaching Load – number of students per each full time
researcher Geographical Location** Regional GdP per person - € year 2001 (Istat)
Polimarche - Ancona 0,430 471 Rooted 31 Centre 21.297
Bari 0,770 1769 Rooted 28 South 14.066
Politecnico Bari 0,622 326 Recent 34 South 14.066
Basilicata 0,712 300 Recent 24 South 14.704
Bergamo 1,032 186 Rooted 57 North 27.929
Bologna 1,143 2922 Traditional 35 North 27.090
Brescia 0,753 398 Recent 32 North 27.929
Cagliari 0,674 1273 Traditional 26 South 16.203
Calabria 0,685 590 Rooted 49 South 13.438
Camerino 0,943 151 Traditional 60 Centre 21.297
Cassino 0,235 284 Recent 43 South 13.612
Catania 0,635 1553 Traditional 37 South 13.899
Catanzaro 0,264 170 Recent 60 South 13.438
Chieti 0,960 621 Rooted 38 South 18.353
Ferrara 1,168 668 Traditional 24 North 27.090
Firenze 1,355 2265 Traditional 26 Centre 23.303
Foggia 0,325 209 Recent 48 South 14.066
Genova 1,193 1633 Traditional 21 North 21.924
Insubria 1,304 306 Recent 23 North 27.929
L'aquila 0,772 608 Traditional 26 South 18.353
Lecce 0,728 650 Rooted 43 South 14.066
Macerata 0,818 185 Traditional 70 Centre 21.297
Messina 0,519 1360 Traditional 24 South 13.899
Milano 1,421 2270 Rooted 27 North 27.929
Milano-Bicocca 1,739 611 Recent 38 North 27.929
Polimi 1,032 875 Traditional 46 North 27.929
Modena Reggio Emilia 1,049 723 Traditional 21 North 27.090
Molise 0,578 200 Recent 45 South 15.587
Napoli 0,898 2862 Traditional 33 South 13.612
Seconda Univ. Na 0,683 924 Recent 30 South 13.612
"Parthenope" Na 0,497 106 Rooted 156 South 13.612
"L'orientale" Na 1,417 299 Traditional 35 South 13.612
Padova 1,398 2119 Traditional 27 North 24.914
Palermo 0,603 1853 Traditional 34 South 13.899
Parma 0,972 1046 Traditional 28 North 27.090
Pavia 1,185 1124 Traditional 20 North 27.929
Perugia 0,874 1134 Traditional 29 Centre 20.620
Orientale Pied. 1,045 320 Recent 26 North 23.550
Pisa 1,224 1826 Traditional 27 Centre 23.303
Reggio Calabria 0,997 236 Rooted 39 South 13.438
"La Sapienza" Rm 1,193 4718 Traditional 28 Centre 24.573
Roma "Tor Vergata" 1,237 1244 Recent 25 Centre 24.573
Roma Tre 1,272 730 Recent 49 Centre 24.573
Salerno 0,968 24 Rooted 54 South 13.612
Sannio 0,906 761 Recent 51 South 13.612
Sassari 0,533 132 Traditional 46 South 16.203
Siena 1,262 642 Traditional 24 Centre 23.303
Torino 1,423 192 Traditional 50 North 23.550
Polito 0,951 2019 Traditional 30 North 23.550
Trento 1,186 765 Rooted 31 North 25.839
Trieste 1,038 457 Rooted 32 North 23.739
Tuscia 0,815 952 Recent 25 Centre 24.573
Udine 0,932 302 Rooted 33 North 23.739
Venezia 1,254 648 Traditional 25 North 24.914
Iuav - Venezia 1,482 534 Rooted 32 North 24.914
Verona 0,808 218 Recent 36 North 24.914
* HEIs are classifies as “recent” when created from 1979 onwards, “rooted” if established between 1900 and
1978, and “traditional” if founded before 1900.
** The North of Italy includes the following regions: Piedmont, Liguria, Lombardy, Veneto, Trentino, Friuli, Emilia Romagna; the Centre includes: Tuscany, Umbria, Marche, Lazio; the South includes: Abruzzo, Molise, Puglia, Basilicata, Campania, Calabria, Sicily, Sardinia.
Source: elaboration of the authors on Civr-Vtr data and Istat data
Table B – Students science skills, localism and excellence indicator
Excellence indicator of the universities in the region (scientific disciplines) Science competences OECD – PISA survey 2006 Localism coefficient = A/√B** A - Percentage of professors born in the Province of the univerisity B - Million inhabitants of the Province TORINO (north) 1,423 508 0,38 51% 3,17 MILANO (north) 1,421 499 0,29 56% 2,20 PADOVA (north) 1,398 524 0,26 25% 0,92 FIRENZE* (centre) 1,355 513 0,47 46% 0,98 BOLOGNA (north) 1,226 510 0,39 39% 0,98 PISA* (centre) 1,143 513 0,37 23% 0,40 BARI (south) 0,770 447 0,53 59% 1,25 SALERNO (south) 0,968 442 0,35 36% 1,10 NAPOLI (south) 0,898 442 0,38 67% 3,08 LECCE (south) 0,728 447 0,48 44% 0,81 CATANIA (south) 0,635 433 0,64 67% 1,24 PALERMO (south) 0,603 433 0,6 67% 1,08 MESSINA (south) 0,519 433 0,79 64% 0,65
*PISA Oecd 2003 – Tuscany
** Given two universities with the same percentage of professors born in the province where the university is located, localism is higher when the province is smaller; for instance, we can compare Lecce and Florence: they have a similar number of professors born in the province, but the province of Florence has a much larger population.
Source: elaboration of the authors on data Oecd – Pisa survey; Istat; Civr-Vtr; Perotti, 2008
Table C – Variation in FFO per student: underlying impact of 'riequilibrio' mechanism
1999 : euros of Ffo per
students 2008 : euros of Ffo per students variation 1999-2008
North Venezia - Ist. Architettura 2.352 5.578 137%
North Milano - Politecnico 2.750 5.710 108%
North Piemonte Orientale 2.785 4.877 75%
South Salerno 1.897 3.244 71%
North Trento 2.386 3.914 64%
South Teramo 1.942 3.157 63%
Centre Macerata 2.075 3.346 61%
North Torino - Politecnico 3.143 4.825 54%
North Bologna 3.086 4.611 49%
South Bari 2.657 3.961 49%
North Milano 3.137 4.642 48%
South Bari - Politecnico 2.851 4.141 45%
North Parma 3.567 5.130 44%
North Trieste 4.064 5.708 40%
North Insubria - Varese 2.967 4.094 38%
South Foggia 3.978
North Average 3.379 4.649 38%
North Torino 2.831 3.874 37%
South Cassino 2.182 2.978 36%
North Brescia 3.669 4.994 36%
Centre Roma - La Sapienza 3.212 4.341 35%
North Venezia - Cà Foscari 2.953 3.958 34%
South Sannio -Benevento 2.065 2.718 32%
Centre Roma - Tre 2.837 3.728 31%
South Sassari 4.143 5.376 30%
North Milano - Bicocca 2.967 3.759 27%
North Padova 3.642 4.606 26% South Lecce 2.784 3.489 25% North Verona 3.395 4.243 25% Centre Average 3.576 4.440 24% South Messina 4.623 5.731 24% North Genova 4.394 5.439 24% Centre Ancona 4.020 4.866 21% North Bergamo 2.064 2.472 20% North Pavia 5.081 6.022 19% South Catanzaro 2.608 3.072 18% Centre Firenze 3.746 4.397 17% Centre Pisa 3.721 4.350 17% Centre Camerino 3.762 4.393 17%
South Napoli - Federico Ii 3.664 4.246 16%
Centre Perugia 4.188 4.734 13% South Average 3.395 3.804 12% South Cagliari 3.407 3.771 11% South Molise (Cb) 2.969 3.242 9% Centre Tuscia (Vt) 3.974 4.292 8% North Modena 4.836 5.208 8% North Udine 4.392 4.690 7%
South Napoli - Ist. Orientale 3.204 3.387 6%
North Ferrara 4.385 4.598 5%
South Calabria 2.837 2.970 5%
South Palermo 3.941 4.004 2%
South Catania 3.270 3.176 -3%
South Chieti - G. D'annunzio 3.063 2.803 -9%
Centre Roma - Tor Vergata 5.183 4.440 -14%
South L'aquila 4.415 3.358 -24%
South Basilicata 6.040 4.533 -25%
South Napoli - Ii Università 6.937 4.907 -29%
South Reggio Calabria 4.471 3.017 -33,00%
i The model was applied to the scientific production of the US between the early 1940s and 1985. In the
early ’40s the scientific community was 0.33% of the population and the average IQ was 170, thus the model presumes that 31% of the potential scientific production was actually exploited; in the 1970s the scientific community had risen to 0.91% of the population, the average IQ was down to 158 and 53% of the potential was exploited; in 1985 the scientific community was 3% of the population, while the average IQ was 142 and 75% of the scientific potential was exploited. (Dresch and Janson, 1987; see also De Marchi and Reale, 1996).
ii The product selection process was based on four steps: selection by university researchers of their best
research products and submission to the departments, selection at department level, selection at discipline level, final selection at university level. Worth mentioning is the experience of the University of Modena and Reggio Emilia, which in 2007 commissioned an external committee to provide a research evaluation process based on a VTR-like method. Each department selected its best products (in order to also produce a quantitative evaluation) and peer review was applied to a fixed number of these products, half of which selected by the departments and half selected at random. The average quality of products selected by the departments was significantly superior, thus supporting the overall quality and efficacy of the selection process.
iii Publications year 2005; researchers year 2005, except Switzerland year 2006; US: latest data available
1999 (Source: Oecd - Thomson Scientific, SCI and SSCI,
http://scientific.thomson.com/products/categories/citation/; ipIQ, Inc.; and National Science Foundation, Division of Science Resources Statistics, special tabulations; elaborated by the authors). The indicator is computed under the assumption that ISI publications are authored only by HE and GOV researchers, excluding Business and non Profit sectors’ researchers.