Calhoun: The NPS Institutional Archive
Theses and Dissertations Thesis Collection
2013-12
A business case analysis of pre-positioned
expeditionary assistance kit joint capability
technology demonstration
Lee, Hui Hyang
Monterey, California: Naval Postgraduate School
NAVAL
POSTGRADUATE
SCHOOL
MONTEREY, CALIFORNIA
THESIS
Approved for public release; distribution is unlimited A BUSINESS CASE ANALYSIS OF PRE-POSITIONED EXPEDITIONARY ASSISTANCE KIT JOINT CAPABILITY
TECHNOLOGY DEMONSTRATION
by
Hui Hyang Lee December 2013
Thesis Advisor: Daniel A. Nussbaum
REPORT DOCUMENTATION PAGE Form Approved OMB No. 0704–0188
Public reporting burden for this collection of information is estimated to average 1 hour per response, including the time for reviewing instruction, searching existing data sources, gathering and maintaining the data needed, and completing and reviewing the collection of information. Send comments regarding this burden estimate or any other aspect of this collection of information, including suggestions for reducing this burden, to Washington headquarters Services, Directorate for Information Operations and Reports, 1215 Jefferson Davis Highway, Suite 1204, Arlington, VA 22202–4302, and to the Office of Management and Budget, Paperwork Reduction Project (0704–0188) Washington DC 20503.
1. AGENCY USE ONLY (Leave blank) 2. REPORT DATE December 2013
3. REPORT TYPE AND DATES COVERED
Master’s Thesis
4. TITLE AND SUBTITLE A BUSINESS CASE ANALYSIS OF PRE-POSITIONED EXPEDITIONARY ASSISTANCE KIT JOINT CAPABILITY TECHNOLOGY DEMONSTRATION
5. FUNDING NUMBERS
6. AUTHOR(S) Hui Hyang Lee
7. PERFORMING ORGANIZATION NAME(S) AND ADDRESS(ES)
Naval Postgraduate School Monterey, CA 93943–5000
8. PERFORMING ORGANIZATION REPORT NUMBER
9. SPONSORING /MONITORING AGENCY NAME(S) AND ADDRESS(ES)
N/A
10. SPONSORING/MONITORING AGENCY REPORT NUMBER 11. SUPPLEMENTARY NOTES The views expressed in this thesis are those of the author and do not reflect the official policy or position of the Department of Defense or the U.S. Government. IRB protocol number: N/A
12a. DISTRIBUTION / AVAILABILITY STATEMENT Approved for public release; distribution is unlimited
12b. DISTRIBUTION CODE
A
13. ABSTRACT (maximum 200 words)
The Pre-Positioned Expeditionary Assistance Kit (PEAK) is a Joint Capability Technology Demonstration initiative that is being managed by the Office of the Secretary of Defense, developed in partnership with the National Defense University, and is sponsored by United States Southern Command.
This study analyzes the costs and benefits of implementing the PEAK as a new capability into the Humanitarian Assistance/Disaster Relief Operational community with the objective of building key capacity in partner nations to promote security and stability and focusing on providing effective, low-cost and sustainable capabilities. This thesis conducts a Business Case Analysis (BCA), including a base case analysis and sensitivity analyses focusing on the Return on Investment (ROI) of investing in, and operating and maintaining, the PEAK.
The BCA compares the life-cycle cost estimate of the PEAK with that of the status quo (existing) systems in operational scenarios for a 10-year period. When compared against the estimated investment over the system life-cycle, the results show positive ROI and net present value after the first year. The savings come from the cost of water and transportation.
14. SUBJECT TERMS
Business Case Analysis (BCA), Pre-Positioned Expeditionary Assistance Kit (PEAK), Return of Investment (ROI), Net Present Value (NPV), Life-Cycle Cost Estimate (LCCE)
15. NUMBER OF PAGES 105 16. PRICE CODE 17. SECURITY CLASSIFICATION OF REPORT Unclassified 18. SECURITY CLASSIFICATION OF THIS PAGE Unclassified 19. SECURITY CLASSIFICATION OF ABSTRACT Unclassified 20. LIMITATION OF ABSTRACT UU
Approved for public release; distribution is unlimited
A BUSINESS CASE ANALYSIS OF PRE-POSITIONED EXPEDITIONARY ASSISTANCE KIT JOINT CAPABILITY TECHNOLOGY DEMONSTRATION
Hui Hyang Lee
Lieutenant Commander, Supply Corps, United States Navy B.S., University of Texas at Dallas, 1999
Submitted in partial fulfillment of the requirements for the degree of
MASTER OF SCIENCE IN OPERATIONS RESEARCH
from the
NAVAL POSTGRADUATE SCHOOL December 2013
Author: Hui Hyang Lee
Approved by: Daniel A. Nussbaum
Thesis Advisor
Kevin Maher Second Reader
Robert F. Dell
ABSTRACT
The Pre-Positioned Expeditionary Assistance Kit (PEAK) is a Joint Capability Technology Demonstration initiative that is being managed by the Office of the Secretary of Defense, developed in partnership with the National Defense University, and is sponsored by United States Southern Command.
This study analyzes the costs and benefits of implementing the PEAK as a new capability into the Humanitarian Assistance/Disaster Relief Operational community with the objective of building key capacity in partner nations to promote security and stability and focusing on providing effective, low-cost and sustainable capabilities. This thesis conducts a Business Case Analysis (BCA), including a base case analysis and sensitivity analyses focusing on the Return on Investment (ROI) of investing in, and operating and maintaining, the PEAK.
The BCA compares the life-cycle cost estimate of the PEAK with that of the status quo (existing) systems in operational scenarios for a 10-year period. When compared against the estimated investment over the system life-cycle, the results show positive ROI and net present value after the first year. The savings come from the cost of water and transportation.
TABLE OF CONTENTS
I. INTRODUCTION ... 1
A. PURPOSE OF THE STUDY ... 1
B. THREATS TO STABILITY AND SECURITY ... 2
C. PROBLEM STATEMENT ... 4
D. RESEARCH METHOD AND ASSUMPTIONS ... 7
E. REVIEW OF LITERATURE ... 8
II. REVIEW OF LITERATURE ... 9
III. BACKGROUND ... 13
A. STATUS QUO ... 13
1. Lightweight Water Purifier ... 13
2. Power Generator Set ... 14
3. New Energy System Technologies Raptor Solar Light Trailer ... 15
4. Hastily Formed Network ... 16
B. JOINT CAPABILITY TECHNOLOGY DEMONSTRATION ... 17
C. PRE-POSITIONED EXPEDITIONARY ASSISTANCE KIT ... 19
D. BUSINESS CASE ANALYSIS ... 21
1. Definition ... 22
2. Data Collection ... 22
3. Evaluation Analysis ... 23
4. Results Presentation ... 23
IV. PEAK BUSINESS CASE ANALYSIS ... 25
A. RESEARCH QUESTIONS ... 25
B. METHODOLOGY ... 25
C. SAVINGS OF THE PEAK COST ELEMENTS ... 26
D. PEAK SCENARIO... 28
E. DATA ANALYSIS ... 30
1. Life-Cycle Cost Estimates ... 30
2. Water Savings ... 33 a. Standard Disasters ... 34 b. Non-standard Disasters ... 36 3. Transportation Savings ... 37 4. Total Savings ... 38 a. Standard Disasters ... 39 b. Non-standard Disasters ... 39
c. Total Annual Savings ... 39
5. Quantifiable Benefit Estimates ... 41
6. Net Present Value (NPV) Analysis ... 41
7. Return on Investment Analysis ... 43
b. Number of Standard Disasters per Year ... 46
c. Number of Non-standard Disasters ... 47
d. Investment Cost of the PEAK ... 48
9. Non-quantifiable Benefits ... 49
V. CONCLUSIONS ... 51
APPENDIX A. PEAK DESIRED CAPABILITIES AND METRICS ... 53
APPENDIX B. OFDA FUNDING SUMMARY (FY 2009) ... 61
APPENDIX C. OFDA FUNDING SUMMARY (FY 2010) ... 65
APPENDIX D. 2010 OASN(FM&C) JAPAN EARTHQUAKE RELIEF SUMMARY (FY 12$) ... 69
APPENDIX E. 2012 DHL WARFIGHTERS CONTRACT RATES FOR THEATERS ... 73
APPENDIX F. PEAK SPEND PLAN (FY 2010) ... 75
LIST OF REFERENCES ... 77
LIST OF FIGURES
Figure 1. Integrated System of the PEAK (from Office of the Secretary of
Defense (OSD), 2010a) ... 6
Figure 2. The PEAK Contained in an ISU 60 Container (from Office of the
Secretary of Defense (OSD), 2010a)... 6 Figure 3. Light Water Purifier (from Balling, 2009) ... 14
Figure 4. Generator Set MEP-531A (from United States Marine Corps
Systems Command, 2009) ... 15
Figure 5. The NEST Raptor Solar Light Trailer (from NEST Energy Systems,
2011) ... 15
Figure 6. PEAK Elements (from Office of the Secretary of Defense (OSD),
2010b) ... 20
Figure 7. Business Case Analysis Methodology (from Defense Acquisition
University, 2007)... 22 Figure 8. Classification of Disasters (from Apte, 2009) ... 28
Figure 9. OFDA Funding By Sector (from United States Agency for
International Development Annual Reports, 2010) ... 35
Figure 10. Total Savings of the PEAK Base Case for a Period of One Year
(FY12$K) ... 40 Figure 11. The PEAK Cash Flow for a Period of 10 Years (FY12$K) ... 41
Figure 12. Annual Return on Investment of the PEAK Base Case for a 10-year
Period ... 44 Figure 13. Sensitivity Analysis of ROI with Varying the Number of COCOMs ... 46
Figure 14. Sensitivity Analysis of ROI with Varying the Number of Standard
Disasters ... 47
Figure 15. Sensitivity Analysis of ROI with Varying the Number of
Non-standard Disasters... 48 Figure 16. Sensitivity Analysis of Investment Cost of the PEAK (FY12$K) ... 49
LIST OF TABLES
Table 1. Top-level Specifications of the PEAK System (from National
Defense University, 2011) ... 21
Table 2. Comparison of the Status Quo and the PEAK over a Period of One
Year (FY12$K) ... 31
Table 3. Water Savings of the PEAK for Non-Standard Disasters (FY12$K) ... 37
Table 4. Transportation Costs of the PEAK (FY12$K) ... 38 Table 5. Transportation Costs in the Status Quo (FY12$K) ... 38 Table 6 . Cumulative Savings of the PEAK for a Period of 10 Years (FY12$K) 40
Table 7. Net Present Value (NPV) of PEAK for a Period of 10 Years and
df=2% (FY12$K) ... 43 Table 8. Factors Varied for Sensitivity Analysis ... 44
Table 9. Cumulative Cash Flow of the PEAK for a Period of 10 Years
(FY12$K) ... 45
LIST OF ACRONYMS AND ABBREVIATIONS
AC Alternating Current
ACTD Advanced Concept Technology Demonstration
AOF Area of Focus
AOR Area of Responsibility
ATD Advanced Technology Demonstration
AUC Average Unit Cost
BCA Business Case Analysis
COCOM Combatant Command
CRED Centre for Research on the Epidemiology of Disasters
DAU Defense Acquisition University
DoD Department of Defense
DRC Democratic Republic of Congo
DUSD (AT) Deputy Under Secretary of Defense (Advanced Technology)
EIP End Item Procurement
EM-DAT Emergency Events Database
ESM Energy Surety Microgrid
FEMA Federal Emergency Management Agency
FM&C Financial Management and Comptroller
FYDP Future Years Defense Program
GPS Global Positioning System
HA/DR Humanitarian Assistance / Disaster Response
HFN Hastily Formed Network
HMMWV High-Mobility Multipurpose Wheeled Vehicle
ISU Internal Airlift/Helicopter Slingable-Container Unit
JCIDS Joint Capabilities Integration and Development System
JCS Joint Chiefs of Staff
JCTD Joint Capability Technology Demonstration
JTF-B Joint Task Force - Bravo
LCC Life-Cycle Cost
LCCE Life-Cycle Cost Estimate
LWP Lightweight Water Purifier
MAGIC Medium Altitude Global ISR Communication
NCCA Naval Center for Cost Analysis
NDU National Defense University
NEST New Energy System Technologies
NM Nautical Miles
NPS Naval Postgraduate School
NPV Net Present Value
O&S Operation and Support
OASD (FM&C) Office of the Assistant Secretary of Defense (Financial Management & Comptroller)
OFDA Office of U.S. Foreign Disaster Assistance
OMB Office of Management and Budget
OSD Office of the Secretary of Defense
OUSD Office of the Under Secretary of Defense
PEAK Pre-positioned Expeditionary Assistance Kit
PKO Peacekeeping Operations
POL Petroleum, Oil, and Lubricants
POR Program of Record
PV Present Value
QDR Quadrennial Defense Review
R&D Research and Development
ROI Return on Investment
S&T Science and Technology
SATCOM Satellite Communications
SMS Short Message Service
SPIDERS Smart Power Infrastructure Demonstration for Energy
Reliability and Security
UAV Unmanned Aerial Vehicle
USAID United States Agency for International Development
USAFRICOM United States Africa Command
USPACOM United States Pacific Command
USSOUTHCOM United States Southern Command
WASH Water, Sanitation, and Hygiene
EXECUTIVE SUMMARY
The Pre-positioned Expeditionary Assistance Kit (PEAK) is a Joint Capability Technology Demonstration initiative that is being managed by the Office of the Secretary of Defense, developed in partnership with the National Defense University, and is sponsored by United States Southern Command. This program seeks to enhance stability and promote national security by demonstrating and transitioning an array of capabilities to field distributed essential services including potable water and power generation, communications, and situational awareness during periods of distress.
This study analyzes the costs and benefits of implementing the PEAK as a new capability into the Humanitarian Assistance/Disaster Relief (HA/DR) Operational community with the objective of building key capacity in partner nations to promote security and stability and focus on providing effective, low-cost and sustainable capabilities. This thesis conducts a Business Case Analysis (BCA), including a base case analysis and sensitivity analysis focusing on the Return on Investment (ROI) of investing in, and operating and maintaining, the PEAK.
The BCA compares the Life-Cycle Cost (LCC) and benefit estimates of the status quo (existing) systems with the PEAK over a 10-year base case scenario. The analysis considers both a base case and several sensitivity analyses. The results are:
• PEAK provides enhanced ability of net assessment, supports
HA/DR operations, and promotes security and stability in theater.
• The Life-Cycle Cost Estimate (LCCE) for acquiring and operating
the status quo is $655.5K, while the PEAK system is $1,378.3K.
• The Net Present Value (NPV) of the PEAK in the base case
scenario is $5,211.6K. This positive value indicates the attractiveness of an investment in the PEAK.
• All PEAK investment costs are recouped after the first year of operation. The system has a positive ROI of 559% over 10 years.
• Increased use of the PEAK generates increased savings. These
savings can be achieved by expanding use among Combatant Commands (COCOMs) or by increasing the density of the PEAKs within a COCOM.
• The savings come from cost of water and transportation. Water
savings occur because the PEAK replaces the water costs that would normally occur, under the status quo, during an initial period of a disaster.
LCC and benefit estimates show that the PEAK system offers the U. S. Department of Defense (DoD) positive ROI and NPV after the first year of using one PEAK system in an operational scenario of 10 years. Using the PEAK will save money and reduce time to administer basic services such as water and communications, compared to the status quo. The PEAK provides effective and sustainable services in support of U.S. operations and promotes security and stability in theater.
ACKNOWLEDGMENTS
I would like to thank my thesis advisor, Dr. Daniel A. Nussbaum, for his wisdom, patience, and guidance. Without him, this thesis would not have been possible. In addition, I would like to thank my thesis second reader, CDR (ret) Kevin Maher, USN, for his valuable inputs to this research. Most importantly, I would like to thank my family for their constant support and inspiration. Thank you all very much.
I.
INTRODUCTION
A. PURPOSE OF THE STUDY
The Pre-positioned Expeditionary Assistance Kit (PEAK) is a Joint Capability Technology Demonstration (JCTD) initiative that is managed by the Office of the Secretary of Defense (OSD), developed in partnership with the National Defense University (NDU), and sponsored by United States Southern Command (USSOUTHCOM). The technical manager for this program is NDU's Center for Technology and National Security Policy. This program seeks to enhance stability and promote national security by demonstrating and transitioning an array of capabilities to the field of operation. These capabilities are potable water and power generation, communications, and situational awareness (Office of the Secretary of Defense (OSD), 2010b).
The PEAK program intends to address the challenge that the military faces in providing critical services like clean water, power, and communications in support of distressed populations during a natural or human-made crisis while incorporating renewable energy systems. The PEAK initiative conducted a three-spiral “build – test – demonstrate” program during FY10 and FY12. Spiral 1 focuses on rapidly delivering integrated water filtration and power kits. It provides desalination & power units to USSOUTHCOM, United States Africa Command (USAFRICOM) and United States Pacific Command (USPACOM). Spiral 2 delivers a selection of technical solutions that address the four component capabilities; these components are potable water, power, communication, and situational awareness. Spiral 2 provides an integrated prototype kit to USSOUTHCOM at Joint Task Force-Bravo (JTF-B), Honduras. Spiral 3 delivers an integrated kit that satisfies four objective capabilities. The four objective capabilities are water desalination, information sharing, communications, and hybrid renewable power. Spirals 1 and 2 are identified as an interim capability, while Spiral 3 is identified as a mature capability. This study focuses on Spiral 3,
where the PEAK is integrated in an Internal Airlift/Helicopter Slingable-Container Unit (ISU) 60 container.
The purpose of this study is to analyze the costs and benefits of implementing the PEAK as a new capability into the Humanitarian Assistance/Disaster Relief (HA/DR) Operational community. The objective of the PEAK is to build key capacity in partner nations to promote security and stability. The focus is on providing an integrated kit that satisfies the four objective capabilities. This thesis conducts a Business Case Analysis (BCA), including a sensitivity analysis, focusing on the Return on Investment (ROI) of investing in, and operating and maintaining, the PEAK.
The BCA compares the time-phased, discounted cash flows of the PEAK with that of the status quo (existing) system. The result provides financial evidence of whether it makes business sense to proceed with investing in, and operating and sustaining, the PEAK. The PEAK is unique because it combines multiple capabilities, and there is no current single device which provides the PEAK-like capability. However, there are individual existing devices that provide only one of the PEAK’s capabilities. Therefore, this combination of current devices is used as the base case from which to quantify the improvement provided by investing in and operating the PEAK.
B. THREATS TO STABILITY AND SECURITY
Within the United States government, the Department of Defense (DoD) is a key organization with the global reach and breadth of capabilities to provide an immediate response to distressed populations. The DoD has been involved in disaster responses in the past, but now has decided to take a leading role in disaster response efforts throughout the globe. DoD has become a leader in initial response efforts (Chairman of the Joint Chiefs of Staff, 2011). Current policy states that, “stability operations are a core U.S. military mission that the DoD shall be prepared to conduct with proficiency equivalent to combat operations” (Department of Defense Instruction 3000.05, 2009). HA/DR
operations is one of six expanded core capabilities for the Navy, Marine Corps, and Coast Guard enumerated in "A Cooperative Strategy for 21st Century Seapower" (Department of the Navy, 2007). This represents a strategic shift from traditional hard power assets to the soft power effects.
Building security and stability with partner nations is vital in today's military power. The Quadrennial Defense Review (QDR) Report identified "building the security capacity of partner states" as a mission area growing in importance (Secretary of Defense, 2010). The PEAK is the first attempt to address United States defense capability shortfalls identified in the QDR within the “building security capacity” key mission area. Additionally, the 2011 National Military Strategy of the United States of America calls for the Combatant Commands to pursue security cooperation and to help strengthen the defense capabilities of allies and regional partners to support and advance United States interests (Chairman of the Joint Chiefs of Staff, 2011).
The unpredictable nature of disasters poses a challenge to the HA/DR process. The HA/DR process begins with the Combatant Commanders in coordination with United States Agency for International Development (USAID). First, the United States commits to a formal disaster relief operation when the disaster is beyond the ability of the host nation to handle on its own. Second, the host nation formally requests assistance from the United States. Third, the United States approves the request if it is in the strategic interests of the United States. Finally, USAID Office of United States (U.S.) Foreign Disaster Assistance (OFDA) provides the ambassador $50,000, with the option to increase the amount to $100,000. Additionally, the COCOM authorizes the immediate response of DoD units deployed in the area (Department of Defense Instruction 3000.05, 2009).
HA/DR operations includes facilitating the distribution and restoration of basic human services, providing medical support, conducting critical engineering operations, and providing necessary enabling security in order to alleviate human suffering and provide the foundation for the long term recovery of the disaster
area. Synchronizing DoD support to OFDA, USAID, and United Nation HA/DR efforts to mitigate human suffering and accelerate recovery in the affected area is the key to success of the HA/DR process. Without the knowledge of when or where disasters will occur, it is necessary to predict needs and to dedicate assets to service those needs. Without these dedicated assets during periods of distress, the security and stability of partner nations can be undermined by the lack of capacity to provide or maintain essential services.
Notwithstanding the increasing effort to build security capacity of partner states, there is still a gap in capabilities to support the United States and enhance partner nations in carrying out key missions (Horn, 2011). Some capabilities can be pre-positioned to help provide sustainable and essential services in time sensitive events. The PEAK project was initiated to address part of this gap. The project will contribute to DoD and other United States government efforts in building security capacity through collaboration with foreign authorities.
The PEAK services can be provided in support of a variety of missions, including support for HA/DR activities, peacekeeping operations (PKO), and assistance to civil law enforcement and first responder authorities.
C. PROBLEM STATEMENT
The capacity of USSOUTHCOM, USPACOM, and USAFRICOM for promoting security and enhancing stability within their respective geographic Area of Responsibility (AOR) is constrained by a limited capacity for enabling scalable critical services during time-sensitive HA/DR events (United States Southern Command, 2010a). USSOUTHCOM’s Area of Focus (AOF) is a region comprising 41 countries and territories across Central America, South America, and the Caribbean partner nation military and security forces. This area requires a wide range of capabilities to ensure security and enhance stability. One pervasive area of need in which to build partner nation capacity is distributed essential services. Regional security and stability can be threatened by the
absence of critical services that are enabled by potable water and power generation, information sharing, and communications. Additionally, the lack of appropriate U.S. response may create a national strategy gap and opportunities for potential adversaries.
Authority in-theater often lacks the capacity to develop essential services in times of crisis. DoD and partner nations can improve their ability to provide critical services for targeted purposes during the first days of a natural crisis through a structured process. Additionally, the DoD can help partner nations enhance their capabilities to carry out key missions through proactive military-to-military engagement. These collaborative efforts can contribute to regional stability.
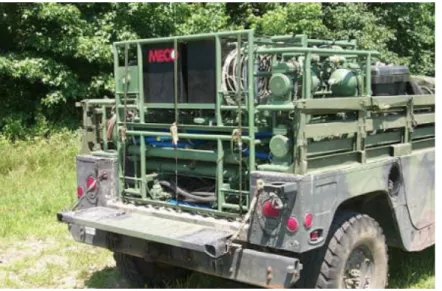
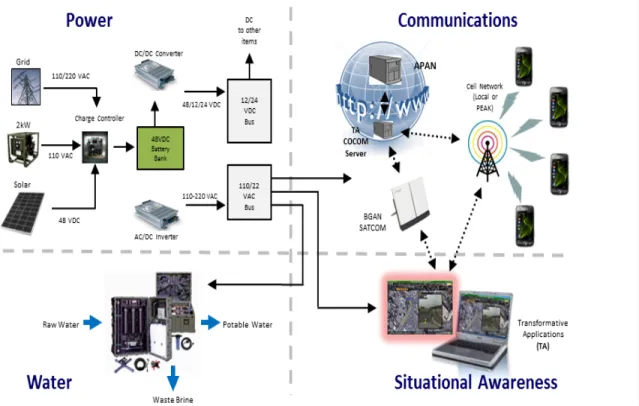
The objective of the PEAK is to demonstrate and transition an array of capabilities to the field of operations. Demonstrating the PEAK's capabilities is the solution to ensuring security and enhancing stability. Each component of the PEAK can be used separately or as part of an integrated system designed to be deployed quickly to disaster environments, where the relevant services are not otherwise immediately available. An integrated PEAK is shown in Figure 1; the integrated PEAK contained in an ISU 60 container is shown in Figure 2 (Office of the Secretary of Defense (OSD), 2010a). The integrated PEAK system contained in an ISU 60 container is transportable via military and civilian air, sea, and land modes. The complete kit and associated consumables are able to fit on a single 463L Cargo Air Pallet.
Figure 1. Integrated System of the PEAK (from Office of the Secretary of Defense (OSD), 2010a)
Figure 2. The PEAK Contained in an ISU 60 Container (from Office of the Secretary of Defense (OSD), 2010a)
The benefit of this thesis and BCA is to provide decision makers in OSD with an objective, quantitative analysis of the cost-benefits of the PEAK JCTD and its status quo alternative. In addition, this thesis will support the decision process for OSD as it embarks on an effort to provide effective, low-cost, and sustainable services in support of US operations, and will help build key capacity in partner nations to promote security and stability in the theater. The BCA will
evaluate the costs, benefits, and ROI of the PEAK JCTD, as compared to the current systems.
Implementing the PEAK capabilities as a support to the HA/DR operations is vital to the DoD's mission. For these reasons, estimating the quantifiable and non-quantifiable benefits of the PEAK will help the DoD make effective and efficient decisions in implementing the PEAK capabilities.
D. RESEARCH METHOD AND ASSUMPTIONS
To achieve the purpose set out in Section A, the thesis
• Develops an analytical structure for performing BCA.
• Conducts a BCA for the PEAK based on this structure including:
Develops Life-Cycle Cost Estimates (LCCEs) for the PEAK and the status quo;
Develops savings in a base case scenario, from a comparison of the PEAK and the status quo;
Computes the ROI in a base case scenario;
Develops sensitivity analysis of ROI and important programmatic variables.
The comprehensiveness of the BCA is limited by the data and information made available to the author. Key assumptions in this analysis are:
• A conservative approach was adopted. Whenever a choice is to be
made between higher and lower costs due to ambiguity in the data, the higher cost is used. Sensitivity analysis is used to test the robustness of the assumption.
• Where information is not available, or is not made available, a "worst case" assumption is made.
• The Joint Inflation Calculator (Naval Center for Cost Analysis,
E. REVIEW OF LITERATURE
We begin the study with a review of literature in Chapter II. Chapter III develops the background of the key technologies currently employed for HA/DR response by all of the Services. Chapter IV forms the model and develops the BCA of procuring and deploying the PEAK system with comparison to the status quo system. Chapter V formulates conclusions and recommendations.
II.
REVIEW OF LITERATURE
The purpose of this study is to analyze the costs and benefits of implementing the PEAK as a new capability into the HA/DR operational community with the objective of building key capacity in partner nations to promote security and stability, and focus on providing effective, low-cost, and sustainable capabilities. The literature listed below addresses the objectives of HA/DR and discusses the operational, planning, and legal framework of military support for HA/DR.
Concepts for the employment of military forces have expanded beyond the traditional paradigm of wartime operations. Military operations now include Stability Operations, which are becoming a more prevalent aspect of military operations. The Chairman of the Joint Chief of Staff defines "Stability Operations" as various missions, tasks, and activities conducted outside the U.S., in coordination with other instruments of power, to maintain or reestablish a safe and secure environment and to provide essential government services, emergency infrastructure reconstruction, and humanitarian relief (Office of the Chairman of the Joint Chiefs of Staff, 2011).
Joint Publication 3–07, “Stability Operations,” provides doctrine for the conduct of stability operations during joint operations within the broader context of U.S. Government efforts. It provides guidance for operating across the range of military operations to support U.S. Government agencies, foreign governments, intergovernmental organizations, and activities until it is feasible to transfer lead responsibility (Office of the Chairman of the Joint Chiefs of Staff, 2011). HA/DR is one of the five military functions of Stability Operations. The others are security, economic stabilization and infrastructure, rule of law, and governance and participation.
National Maritime Strategy, “A Cooperative Strategy for 21st Century Seapower,” identifies an approach that integrates seapower with other elements of national power, as well as national power of our friends and allies. It notes that
preventing wars is as important as winning wars. The strategy demonstrates the importance of asserting the DoD national power through contingency operations. The strategy provides guidance for strengthening international and regional security. As a global power, the United States' interests are intertwined with the security and stability of the broader international partnerships. HA/DR activities employ joint forces to address partner needs and sometimes provide opportunities to build confidence and trust between past adversaries. HA/DR activities help the U.S. government gain access and relationships that support U.S. national interests (Chairman of the Joint Chiefs of Staff, 2011).
The Quadrennial Defense Review (QDR) Report provides guidance for building the security capacity of partner states. Since the United States assumed the role as the global security provider after World War II, DoD has worked actively to build the defense capacity of allied and partner states. This has given the U.S. military opportunities to train with and learn from their counterparts, and to further the U.S. objective of securing a peaceful and cooperative international order. In order to ensure that improvements in partner security forces are sustained, seeking to enhance the capabilities and capacity of security institutions that support fielded forces is essential (Secretary of Defense, 2010).
A source for disaster data is the Federal Emergency Management Agency (FEMA). FEMA defines a disaster as an event which results in a minimum of 100 deaths/injuries, or results in over $1 million worth of damage. In other words, there must be some form of substantial damage or high impact in order for relief efforts to be granted (Federal Emergency Management Agency, 2010). Another source of data is the International Disaster Database, known as Emergency Events Database (EM-DAT). The EM-DAT website, run by the Centre for Research on the Epidemiology of Disasters (CRED), undertakes research and provides an evidence base on the burden of disease and health issues arising from disasters and conflicts to improve needs-based preparedness and responses to humanitarian emergencies (Emergency Events Database, 2011).
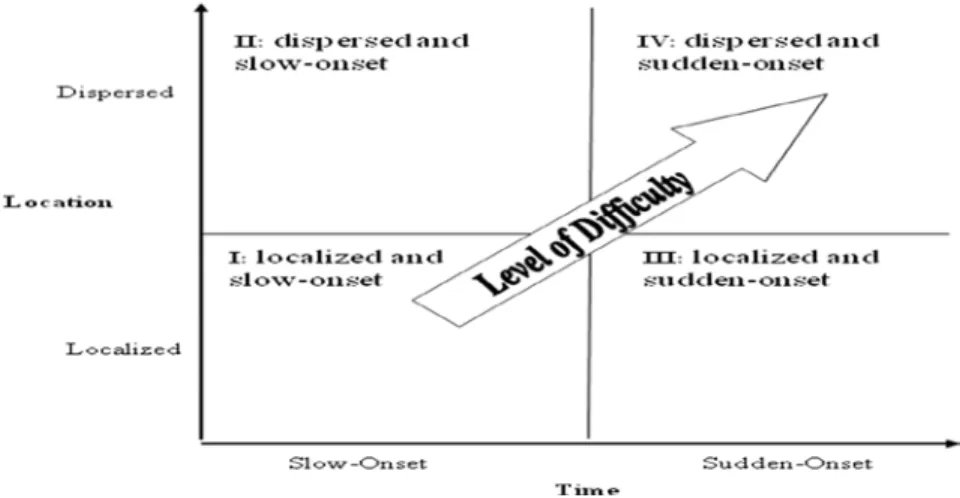
The book, “Humanitarian Logistics: A New Field of Research and Action,” provides the disaster classifications, which includes the nature of the location of the disaster (localized or dispersed), as well as the onset rate (fast or slow). The disaster classifications provide a useful structure for classifying disasters in considering the difficulties that may be associated with aid response. Localized disasters that occur slowly provide responders with more time to prepare and spread resources across a smaller area, which makes responding to these types of disasters much easier than responding to dispersed disasters that occur suddenly (Apte, 2009).
Department of Defense Instruction 5000.02 directs the development of Business Case Analyses (BCA), especially for new systems. The BCA assesses each alternative and weighs total time-phased, discounted costs against total benefits to arrive at the preferred solution (Defense Acquisition University, 2007). Similar studies examining the cost and benefits of new technology have been completed in the past, including the following four Naval Postgraduate School (NPS) theses:
• The Cost Benefit Analysis of the Smart Power Infrastructure
Demonstration for Energy Reliability and Security (SPIDERS) is a comprehensive analysis of the costs and benefits of an Energy Surety Microgrid (ESM) facility to the Navy (Leewright, 2012).
• The Impact Of Rechargeable Batteries: Quantifying The Cost And
Weight For A Marine Infantry Battalion examines the viability, cost savings, and operational weight associated with the use of rechargeable batteries in USMC Infantry battalions (Brown, 2011).
• Cost Benefit Analysis of a Utility Scale Waste-to-Energy/
Concentrating Solar Power Hybrid Facility at Fort Bliss is a comprehensive analysis of the costs and benefits of a waste to energy facility to the Army (Clement, 2012).
• A Business Case Analysis of a Medium Altitude Global ISR
The PEAK JCTD Management Plan describes the management approach for executing the PEAK JCTD. It provides guidance for the PEAK team and serves as an agreement among the signatory parties (Office of the Secretary of Defense (OSD), 2010a).
The sources above underscore the importance of today's U.S. military operations taking a leading role in disaster response efforts throughout the globe. Stability Operations are a core U.S. military mission, which is critical in keeping our alliances and in preventing war.
III.
BACKGROUND
This chapter addresses the key technologies currently employed for HA/DR response by all of the Services. In order to form a meaningful understanding of the field of HA/DR, it is first necessary to understand the current technologies used in the field. A summary of the status quo, Joint Capability Technology Demonstration (JCTD) program, and the PEAK is provided. The chapter concludes with an overview of this study's BCA methodology.
A. STATUS QUO
Four existing components of providing essential and sustainable services during HA/DR responses are (1) Lightweight Water Purifier, (2) Power Generator, (3) New Energy System Technologies (NEST) Raptor Solar Light Trailer, and (4) Hastily Formed Network (HFN). These services are described below.
1. Lightweight Water Purifier
The Lightweight Water Purifier (LWP) provides water purification and storage to small units during HA/DR operations. It produces potable water from freshwater, brackish water, and saltwater sources. The characteristics are (Balling, 2009):
• Produces 75 gallons per hour on seawater (45,000 ppm) and 125
gallons per hour on freshwater
• Generates treatment by settling, ultrafiltration, and reverse osmosis
• Is man-portable and modular
• Is transportable in High-Mobility Multipurpose Wheeled Vehicle
(HMMWV) and medium tactical helicopter
• Is air-droppable
Figure 3. Light Water Purifier (from Balling, 2009)
2. Power Generator Set
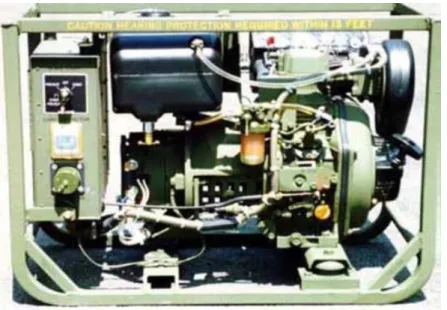
The 2KW Military Tactical Generator Set, MEP-531A, is a self-contained, skid mounted, and portable unit. It is equipped with controls, instruments and accessories necessary for operation (Marine Corps Systems Command, 2008). The MEP-531A consists of a diesel engine, direct drive AC alternator, speed governing system, fuel system, 24VDC auxiliary cold weather starting system (23°F or below), and generator control system. The MEP-531A can be used with any equipment requiring a small source of Alternating Current (AC) power. It is shown in Figure 4.
Figure 4. Generator Set MEP-531A (from United States Marine Corps Systems Command, 2009)
3. New Energy System Technologies Raptor Solar Light Trailer
The New Energy System Technologies (NEST) Raptor Solar Light Trailer, shown in Figure 5, is a remote lighting capability that does not require external power. It consists of four 10-foot-by-10-foot solar panels, rated at 175 watts per piece, a solar controller, and eight lead acid batteries.
Figure 5. The NEST Raptor Solar Light Trailer (from NEST Energy Systems, 2011)
4. Hastily Formed Network
Hastily Formed Network (HFN)’s mission is to support the United States government and military by bringing satellite-enabled rapid wireless communications to the most critical areas and functions, working with Joint Task Forces. The first priority after the disaster event is for the responders to communicate. The ability to form multi-organizational networks rapidly is crucial to humanitarian aid, disaster relief, and large urgent projects. The responders want to pool the knowledge and interpretations of the situation, understand what resources are available, plan responses, and coordinate. Without emergency communications, the responders cannot coordinate and operate (Denning, 2006).
A HFN is a rapid response wireless communications system from military, civilian government, and non-government organizations. The tasks performed by HFN participants are:
• Set up mobile communication and sensor systems
• Conduct interagency operations
• Collaborate on action plans and coordinate the response team’s
execution
• Lead a social network where communication and decision-making
are decentralized and there is no hierarchical chain of command HFN equipment includes:
• Four Broadband Global Area Network satellite units which connect
to the Internet via the International Maritime Satellite Network in five minutes and generate 100-meter wireless clouds
• Four foldable 10-foot-by-10-foot solar panel tarps that generate 800 watts of power from sunlight or a wind turbine (same solar panel tarps used in NEST Raptor Solar Light Trailer)
• Global Positioning System (GPS) devices and visualization
systems which provide situational awareness in a command-center-like configuration
The benefit of using emergency communications is the quicker response to emergency medical situations. For example, during the Haiti Earthquake HA/DR response, the Naval Postgraduate School's HFN team used the emergency communications system to arrange a medivac of an injured child. The child suffered a life-threatening femur fracture where an infection set in. The child was medivaced to the United States Ship Comfort, a floating hospital ship, where he was properly treated. His life was saved; other lives were saved during the HA/DR response. (Hastily Formed Network, 2010)
The cost of the four components of the status quo listed above is less than the cost of the PEAK, mainly because the ISU 60 container trailer is not included. The disadvantage of the status quo is the separate arrivals of components for operations; this is because the components are not integrated into one system. The problem arises because the HFN could arrive later than the LWP or power generators, which would create the delay of emergency communication.
B. JOINT CAPABILITY TECHNOLOGY DEMONSTRATION
The Joint Capability Technology Demonstration (JCTD) program evolved from the Advanced Concept Technology Demonstration (ACTD) Program, which had its inception in 1994 under the sponsorship of the DoD. The program is led by the Deputy Under Secretary of Defense (Advanced Technology) (DUSD(AT)), who works with a team of ACTD/JCTD oversight executives to interact with the various AT divisions to harvest capabilities for COCOMs. In 2006, the JCTD program was initiated to update the successful ACTD program to meet the DoD’s transformational goal of becoming capability-based, rather than threat-based, in its focus. The JCTD program includes many of the positive aspects of the ACTD program, as well as improvements to meet new and evolving defense challenges. The process integrates the ACTD program with the new Joint Integration and Development System (JCIDS) developed by the Joint Chiefs of Staff (JCS). The JCTD process focuses on joint and transformational
technologies that are initiated in Science and Technology (S&T) and carried through the difficult transition stage (Seng, 2008).
The mission of the JCTD program is to find, demonstrate, transition, and transfer the best operational concepts and technology solutions for transformational, joint, and coalition warfare. The JCTD program directly addresses Joint, Coalition, and Interagency capability needs expressed by the COCOMs. Based on significant successes since inception of the program, the COCOMs now view the JCTD program as a primary means to develop, assess, and transition needed capabilities (Joint Capability Technology Demonstrations, 2011).
The JCTD and Advanced Technology Demonstration (ATD) are used to expedite the transition of maturing technologies from the developers to the users. The JCTD program emphasizes technology assessment and integration rather than technology development. The goal of the JCTD program is to provide a prototype capability to the warfighter and to support him in the evaluation of that capability. Warfighters evaluate the capabilities in military exercises at a scale sufficient to fully assess military utility. The developers allow the warfighter and material developer to jointly experiment with the application of technologies and new operational concepts in a field environment prior to committing to formal acquisition. The JCTD concepts are nominated, approved, and funded by the Joint Staff. The assessment will address the operational effectiveness and operational suitability of the proposed solution. The sponsor will develop the appropriate Joint Capabilities Integration and Development System (JCIDS) proposal if the concept is to transition to an acquisition program. (Department of the Army, 2009).
The JCTD program offers three possible post demonstrations transition models as described below (Seng, 2008).
• Transition to Program of Record (POR). The military utility of the
program has been successfully demonstrated, and the concepts will be adopted by the warfighters. Products will be transferred to a
new/current POR or Government Services Administration schedule. The acquisition of additional capability will also be funded.
• Interim Capability to Meet Needs of the Warfighter. Same as above. However, the products may or may not have been sent to a POR. This interim capability fully meets the warfighter’s needs and is being maintained.
• Return to Technology Base. The military utility is deemed to be not successfully demonstrated. Relevant components or capabilities may be incorporated into other systems, returned to the technology base, or terminated.
C. PRE-POSITIONED EXPEDITIONARY ASSISTANCE KIT
In March 2010, the OSD, USSOUTHCOM, and the National Defense University selected the Pre-Positioned Expeditionary Assistance Kit (PEAK) as a JCTD candidate to address the current operational gap for capabilities that can be pre-positioned to help provide sustainable and essential services in time sensitive events (Office of the Secretary of Defense (OSD), 2010a). The PEAK aims to lower logistics costs, as well as to provide responsiveness during a crisis event.
The PEAK is designed to be forward staged and deployable to a disaster response area within 12 hours of a disaster event. It provides immediate vital services in the first 72 hours to disaster response teams. The operators of the PEAK equipment are U.S. military and government personnel, as well as foreign military and government personnel with U.S. assistance, as required. The primary recipients of the PEAK services are the PEAK operators, the local populace, and local first responders.
Components of the PEAK are shown in Figure 6 (Office of the Secretary of Defense (OSD), 2010b) and described below.
Figure 6. PEAK Elements (from Office of the Secretary of Defense (OSD), 2010b)
USSOUTHCOM has identified four primary desired capabilities for the PEAK. These desired capabilities focus on providing essential services early in a crisis, while building interagency and joint cooperation with partner nations (National Defense University, 2010). Top-level PEAK capabilities are described below. Detailed high-level PEAK capabilities and specifications are provided in Appendix A.
• Water purification to produce potable water from fresh, brackish, or salt water
• Reliable power from primarily renewable sources for the PEAK
• Situational awareness and information sharing on threats, local
populace, services, environment, infrastructure, and other support personnel to enable first responders and decision makers to respond effectively to a time-sensitive event
• Regional and international communication to transmit and receive voice, data, and images
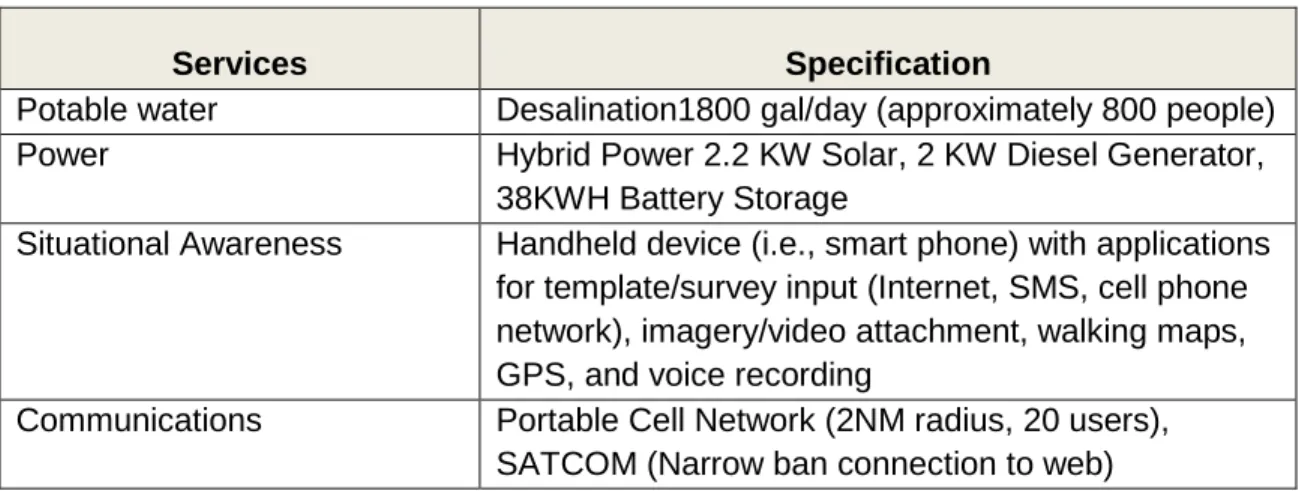
The top-level specifications of each PEAK system are listed in Table 1.
Services Specification
Potable water Desalination1800 gal/day (approximately 800 people)
Power Hybrid Power 2.2 KW Solar, 2 KW Diesel Generator,
38KWH Battery Storage
Situational Awareness Handheld device (i.e., smart phone) with applications for template/survey input (Internet, SMS, cell phone network), imagery/video attachment, walking maps, GPS, and voice recording
Communications Portable Cell Network (2NM radius, 20 users), SATCOM (Narrow ban connection to web)
Table 1. Top-level Specifications of the PEAK System (from National Defense University, 2011)
D. BUSINESS CASE ANALYSIS
A Business Case Analysis (BCA) is a basic financial tool used by decision makers to evaluate alternative approaches and to decide on the best courses of action, with due regard for allocation of scarce resources. The BCA is a structured, systematic method, which provides a best value analysis that considers time-phased costs and other factors that are relevant to the investment decision (Defense Acquisition University, 2007).
The decision to pursue a BCA is directed by policy in DoD Instruction 5000.02. The BCA assesses each alternative and weighs total time-phased, discounted costs against total benefits to arrive at the preferred solution. A BCA should include:
• An introduction
• The objectives of the case
• The methods, assumptions , and constraints
• An alternative
• The costs and benefits of an alternative
• Sensitivity analysis
• Conclusions
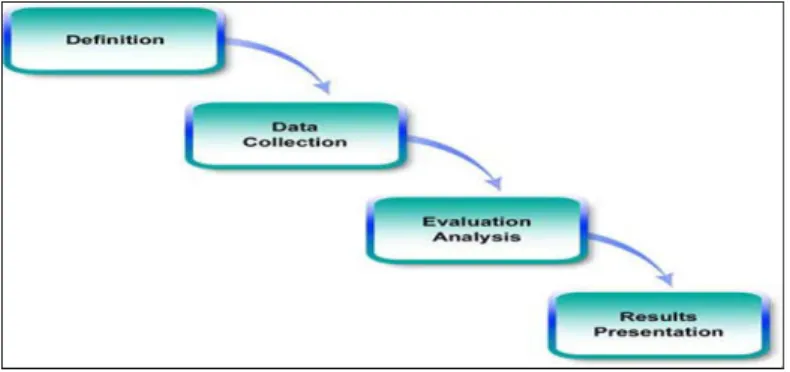
A generic BCA methodology can be described as a four-phase process, as shown in Figure 7 (Defense Acquisition University, 2007).
Figure 7. Business Case Analysis Methodology (from Defense
Acquisition University, 2007)
The phases in the process are listed and described below.
1. Definition
The first phase in the BCA process, the scope, assumptions and constraints, will guide the analysis. This phase also identifies the alternatives the BCA will consider.
2. Data Collection
In the second phase, a data collection plan is devised so that the types of data required, data sources, and how they can be obtained can be mapped out. Models must also be developed so that the data can be categorized and stored while preserving its integrity. Data normalization is also applied where required. Where the data is not available, estimates can be made, as long as they can be justified, and the methodology adopted is explained clearly.
3. Evaluation Analysis
In the third phase, Cost models are developed, parameters are calculated, and results are assessed. Data analysis is performed to build the case for each alternative using the data collected in phase two. Results of alternatives are compared to determine the alternative that provides the best cost-benefit combination. Sensitivity analysis is performed to provide insights as to how changes in key input parameters, underlying assumptions that were made, and constraints influence the outcome of the analysis.
4. Results Presentation
In the fourth phase, results are summarized, and presented in graphs and tables, and delivered to the decision-maker. The information presented should be concise, with relevant supporting evidence from the previous phases. A conclusion is also provided to the decision-maker based on the objectives defined in the first phase.
For this study, we produce a BCA in accordance with the BCA methodology above. We assess the Life-Cycle Cost (LCC) of the status quo and then assess the LCC of the PEAK to determine the alternative that provides the best cost-benefit combination. We perform the sensitivity analysis to provide insights as to how changes in key input parameters, and constraints influence the outcome of the analysis. We summarize and present the results in the graphs and tables. Finally, we recommend the best alternative to the decision-maker based on the outcome from the comparison of the LCC assessment.
IV.
PEAK BUSINESS CASE ANALYSIS
This chapter develops the BCA of procuring and deploying the PEAK system, and compares it with the cost of the status quo systems. The analysis starts by developing a scenario of an earthquake in Latin America and the Caribbean region. Within the context of this scenario, we compute and compare net savings, Net Present Value (NPV), and Return on Investment (ROI), as well as a sensitivity analysis on the key results obtained.
A. RESEARCH QUESTIONS
The primary objective of this thesis is to analyze the cost savings and the benefits of implementing the PEAK capability. In addition, this thesis answers the following secondary questions.
• What are the cost differences in Research and Development
(R&D), Investment, and Operations and Support (O&S), between the status quo and the PEAK?
• What are other quantified benefits, such as water and
transportation savings, of using the PEAK?
• Will the PEAK provide benefits in support of United States
operations and promote security and stability in the theater? These questions are answered in section D in this chapter.
B. METHODOLOGY
We evaluate the financial attractiveness of the PEAK by:
• calculating LCC of the status quo and the PEAK
• comparing LCC of the status quo and the PEAK
• calculating NPV and ROI over a 10-year, base-case scenario for a
fixed period time. We choose ten years because major weapons systems use a 20-year scenario, and since the PEAK is not a major
weapons system, we expect an enhanced result by analyzing a 10-year scenario.
• evaluating the robustness of the answers obtained above with
sensitivity analysis of the important input variables
In particular, the NPV and ROI analyses consider the expected savings that the PEAK enables, compared with the status quo. Savings are assessed from the integrated capabilities that the PEAK has (i.e., water, transportation, HFN). Interestingly, the savings actually come from the costs of water and transportation. Water savings occur because the PEAK replaces the water costs that would normally occur under the status quo, during an initial period of a disaster. Transportation savings occur because once a PEAK system is in theater, there are no additional costs to move it within theater.
These ideas, as well as the scenario in which our analyses will take place, will be explained in section D, paragraphs 3 and 4 of this chapter.
C. SAVINGS OF THE PEAK COST ELEMENTS
The cost of using HA/DR expeditionary assistance kits depends on their operational use. This thesis develops the cost estimates of using the PEAK in an operational scenario. The results from these analyses should not be considered definitive, but rather useful for comparing the costs and benefits of the status quo and the PEAK. The results may aid decision makers in their evaluation of short-term and long-short-term effects of employing the status quo versus the PEAK.
PEAK enables savings in two areas:
• Costs of water as part of the disaster relief effort • Transportation of the PEAK into the disaster area
For each of these areas, we develop estimates of the savings from using the PEAK, compared to the status quo, as a function of the type and number of disasters. We begin with a taxonomy for disasters, as developed by Apte in "Humanitarian Logistics" (Apte, 2009). Apte defines a disaster as a natural or man-made hazard resulting in an event of substantial extent causing significant
physical damage or destruction, loss of life, or drastic change to the environment. Disaster events include earthquakes, floods, catastrophic accidents, fires, or explosions that can cause damage to life and property, and destroy the economic, social and cultural life of people (Federal Emergency Management Agency, 2010).
The classification of disasters is based on location (whether it is localized or dispersed) and the arrival time (whether it has slow or sudden onset). Apte includes the nature of the location of the disaster, localized or dispersed, as well as the onset rate, to provide a more useful structure for classifying disasters to help consider the difficulties that may be associated with aid response. Classification moves from slow to sudden onset, and from a localized to a dispersed area, as the difficulty of the response increases. This classification scheme provides a useful structure for classifying disasters (Apte, 2009) and is displayed in Figure 8.
The level of difficulty for the relief effort is greater when disasters are dispersed. The reason for this is that effectiveness and efficiency of transportation and distribution of critical supplies and services suffer. The large and scattered geographical area takes a substantial amount of cost and coordination among responders. In addition, the level of difficulty for the relief effort is greater if disasters have sudden-onset of arrival time due to challenging problems for response since no organization can prepare well for such an event (Apte, 2009).
Figure 8. Classification of Disasters (from Apte, 2009)
For the analyses, we leverage this taxonomy to create "large" and "small" disasters or, as we call them, "standard" and "non-standard" disasters. They are defined by:
• Standard Disaster—quadrants I, II, and III, or response cost under $25M
• Non-standard Disaster—quadrant IV, or response cost greater than
$25M
D. PEAK SCENARIO
USSOUTHCOM is the area of interest for deployment of the PEAK systems to help provide sustainable and essential services in time-sensitive events. USSOUTHCOM provides the tasking requirements for the operational scenario in Latin America and the Caribbean region in support of its HA/DR mission.
We use the base case scenario of positioning two PEAK systems with Joint Task Force-Bravo (JTF-B) located at Soto Cano Air Base, Honduras. Upon receipt of the kits, members of JTF-B receive one day of training from members of the USSOUTHCOM headquarters, followed by one day of exercises with trainer support. The day after the training and exercise, an earthquake of magnitude 8.0 strikes a region in Central America outside of Honduras.
USSOUTHCOM tasks JTF-B to deploy within 12 hours to provide disaster relief support to the region for 72 hours until a larger force provides additional relief. JTF-B deploys one PEAK and six operators via air and land transport to the affected region no later than 12 hours following receipt of the deployment order. Once JTF-B employs the PEAK, they provide situational awareness of the affected region to coordinate and facilitate the disaster relief efforts. Additionally, JTF-B provides fresh water to the affected population and to disaster relief personnel. JTF-B returns to Soto Cano Air Base within 72 hours after employment of the PEAK. The PEAK returns to Soto Cano Air Base with JTF-B.
The key assumptions of the base case are the following:
• The PEAK operates or is employed for 72 hours until USAID or
other agency begins its operations
• USSOUTHCOM invests in one PEAK for the operations
• 13 standard and 2 non-standard disasters occur in a one- year
period in USSOUTHCOM AOR. These numbers are extrapolated from the data below:
There were 55 standard and 7 non-standard worldwide
disasters in 2009 (See Appendix B)
There were 68 standard and 5 non-standard worldwide
disasters in 2010 (See Appendix C)
Average of 2009 & 2010 disasters - 62 standard and 6 non-standard disasters
One-fourth of the average disasters (13 standard and 2
non-standard disasters) is derived from the fact that the 2009/2010 data is compiled from four regions in the world and the PEAK scenario is based on a single region, USSOUTHCOM AOR
• The actual data of the length of standard-disasters is not available. Therefore, we use an arbitrary number of 25 days as the length for a standard disaster relief.
E. DATA ANALYSIS
The following sections develop and compare LCCE for the status quo and the PEAK. Data sources of the LCCE are required to get the correct comparison of estimates between two systems. The following data sources provided information to support the development of the LCCEs.
• The PEAK Management and Implementation Plan (National
Defense University, 2010)
• The PEAK demonstration plan (United States Southern Command,
2010a)
• Telephone interviews with the PEAK program manager, Russell
Horn from Naval Sea Systems Command
• Disaster response cost statistics from the USAID annual report in 2010 (United States Agency for International Development, 2010) • Japan Earthquake Relief Cost Report (Office of Assistant Secretary
of Navy Financial Management and Comptroller, 2011). The data was collected from the PEAK Management and Implementation Plan (National Defense University, 2010)
1. Life-Cycle Cost Estimates
The Defense Acquisition University (DAU) defines Life-Cycle Cost Estimates (LCCE) as the total cost to the government for a system over the lifetime of a defense acquisition program (Defense Acquisition University, 2008a). A Work Breakdown Structure (WBS) is the structure that encompasses an entire program at a summary level. It defines and groups a project's discrete work elements in a way that helps organize and define the total work scope of the project. A WBS provides the necessary framework for detailed cost estimating along with providing guidance for schedule development and control. In general, to estimate the life-cycle costs of a system, the following WBS is used.
• Research and Development (R&D)–cost of all research and development from initiation through the production decision
• Investment (aka Procurement–total cost of procuring the system
and related support equipment
• Operations and Support (O&S)–cost of operating and supporting
the fielded system (personnel, training, and maintenance)
• Disposal–costs associated with demilitarization and disposal of a
military system at the end of its useful life
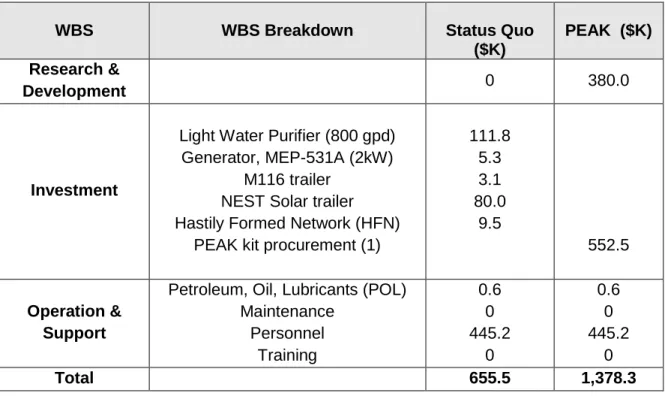
In this study, we follow the general life-cycle WBS above cost noted. However, disposal costs of the status quo and the PEAK are negligible, and therefore are not included in the WBS. Table 2 summarizes the cost of one set of status quo equipment with the cost estimate of one PEAK.
WBS WBS Breakdown Status Quo
($K)
PEAK ($K) Research &
Development 0 380.0
Investment
Light Water Purifier (800 gpd) Generator, MEP-531A (2kW)
M116 trailer NEST Solar trailer Hastily Formed Network (HFN)
PEAK kit procurement (1)
111.8 5.3 3.1 80.0 9.5 552.5 Operation & Support
Petroleum, Oil, Lubricants (POL) Maintenance Personnel Training 0.6 0 445.2 0 0.6 0 445.2 0 Total 655.5 1,378.3
Table 2. Comparison of the Status Quo and the PEAK over a Period of One
Year (FY12$K)
Secretary of Defense, 2010a). This PEAK spend plan describes the PEAK kit deliverables in three spirals. The first spiral includes six prototype water desalination and power generation kits to USSOUTHCOM, USPACOM, USAFRICOM in September 2010. The second spiral includes a selection of technical solutions that address water filtration power generation, communications and situational awareness and capabilities in December 2010. The third spiral includes two complete and integrated kits that satisfy the four component capabilities in August 2011.
• PEAK R&D estimate is from the 2010 PEAK Spend Plan (See
Appendix F). It includes project management, technical support, knowledge repository, contracting and related costs, analysis of alternatives, and kit design costs for FY 11 and FY 12 only (FY 10 cost is not included because it is a sunk cost). The LCCE for R&D is $380K.
• Status Quo Light Water Purifier (LWP) estimate per unit is from the End Item Procurement (EIP) and Average Unit Cost (AUC) for Enhanced Reverse Osmosis Water Purification Unit (Marine Corps Systems Command, 2003)
• Status Quo Generator, MEP-531A estimate is from Bidlink.net,
NSN 6115–01–435–1565
• Status Quo M116 trailer estimate is from Bidlink.net, NSN 2330–
01–101–8434. This is not the ISU 60 trailer which is only included in the PEAK.
• Status Quo NEST Energy Systems Solar Trailer estimate is from
the NPS HFN team estimate report, 2012
• Status Quo HFN equipment estimate is from the NPS HFN Haiti
expense report
• PEAK kit estimate is from the 2010 PEAK Spend Plan (See
Appendix F). The estimate is based on kit procurement of the third spiral, which includes two complete and integrated kits that satisfy
the four component capabilities in August 2011. The cost of one PEAK is $552.5K (See Appendix F).
• POL estimate is based on $1.03 per gallon and a consumption rate
of 0.33 gallons per hour for 72 operational hours per disaster (Marine Corps Systems Command, 2009).
• Yearly personnel cost (E-5 is assumed) is $74,207 from DoD
military composite standard pay and reimbursement rates (Office of Under Secretary of Navy Comptroller, 2010). The number of operators is six per PEAK management plan, 2010
• Training cost is zero dollars due to the assumption that no operator travel is required, and initial training cost is already covered in personnel cost
While the annual O&S costs for the status quo and the PEAK are the same, it is important to note that the PEAK permits other benefits and savings to accrue to the DoD. These are listed below and discussed in the subsequent paragraphs.
• Quantifiable benefits – water savings, transportation savings
• Non-quantifiable benefits
Support HA/DR operations
Promote security and stability in theater
2. Water Savings
In this section, water savings is estimated from using the PEAK compared to the status quo. By design, and as described in paragraph C in Chapter III, the PEAK provides potable water for the first three days (72 hours) of a disaster. Under the status quo scenario, there is no water generated during the first three days of an HA/DR operation because water generating/purification equipment could not be brought into the theater during the first three days. The PEAK, on the other hand, begins purifying water on day one. The PEAK, then, is considered a benefit. We assume for this BCA that this benefit is a "savings" and
that the value of the savings is the cost of generating/purifying water under the status quo for three days.
Water costs in the status quo are taken from the compilation of disaster response cost statistics for Water, Sanitation, and Hygiene (WASH) obtained from the Office of U.S. Foreign Disasters Assistance (OFDA) funding summary of FY 2010 (United States Agency for International Development Annual Reports, 2010). The OFDA is an organizational unit within the USAID that is charged by the President of the United States with directing and coordinating international U.S. government disaster assistance. The OFDA maintains expenditure data for all HA/DA crisis that the U.S. government participates in. The OFDA publishes a summary of these expenses in HA/DA crisis events. The OFDA funding summaries for FY 2009 and FY 2010 are listed in Appendices B and C, respectively. For standard and non-standard disasters, we estimate the total savings in water costs that result from using the PEAK by using the average of the 13 standard and 2 non-standard disasters from the OFDA data set. The assumption of using 13 standard and 2 non-standard disasters is described in section D.
a. Standard Disasters
OFDA funding data is used for our analyses. Figure 9 below shows the OFDA funding percentages by sector. The sectors are:
• disaster response programs to support agriculture and food
security
• economic recovery and market systems
• health, nutrition, protection, shelter and settlements, and
WASH interventions
• humanitarian coordination and information management
programs
• search and rescue efforts
• logistical support and emergency relief commodities
• natural and technological risks
Figure 9. OFDA Funding By Sector (from United States Agency for International Development Annual Reports, 2010)
Figure 9 indicates that 12% of relief expenses incurred during FY 2010 for all disaster responses were attributed to WASH. We assume that these expenditures are made uniformly during the disasters. The 12% figure is used to estimate the cost of water during the first three days of a standard disaster. This cost is the water savings.
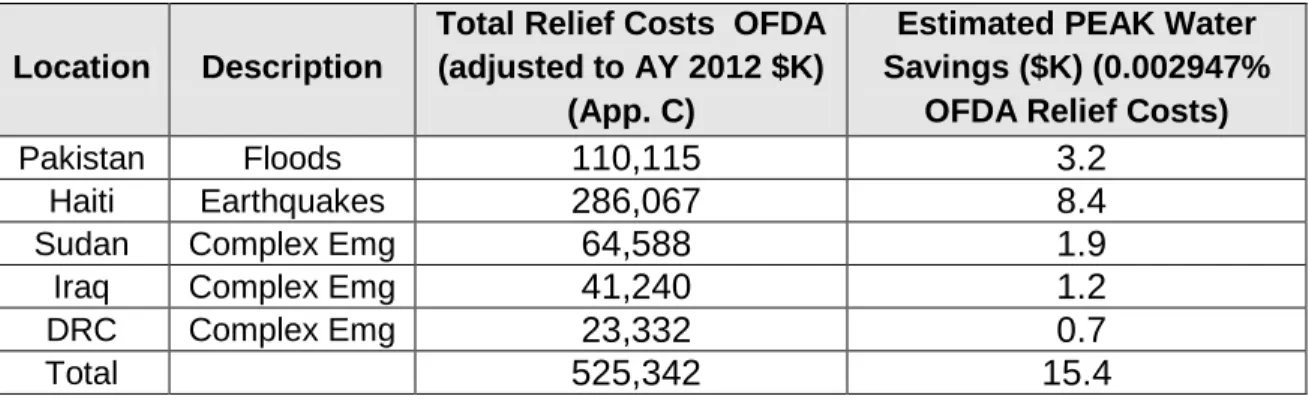
To estimate the cost of water, we first extract the data from the OFDA Funding Summary (FY 2010) provided in Appendix C. The total disaster response expenditure is $656.7M. This included a "prior year disaster cost" of $1.9M, which is removed to determine current cost of $654.8M. We then remove the expenses of the five non-standard disasters; the non-standard disasters are Pakistan's floods, Haiti's earthquakes, Sudan's complex emergency, Iraq's complex emergency, and Democratic Republic of Congo's (DRC's) complex emergency. The result for removing these is a total expenditure of $143.4M on standard disasters. Applying the 12% to this number yields an estimated cost of
water for all 63 standard disasters in FY10 to be $17.2M. The cost of water per standard disaster would then be $17.2M/63 = $273.1K.
Because we assume that expenses are consumed uniformly, and that the average length of a standard disaster is 25 days, the estimate of three days' worth of water consumption is $273.1K * 3 / 25 = $32.8K in Fiscal Year 2010 dollars ($FY10). Using a 2% discount rate we convert this number to $FY12. Thus, the estimated water savings by using the PEAK system is $33.7K per standard disaster.
b. Non-standard Disasters
The variations between standard and non-standard disasters are too large to use the same cost factor to estimate the water savings. Therefore, we derive a different cost factor from a recent non-standard disaster expense report. Appendix D, from the Office of the Assis