* Corresponding author. Tel. +989133591263 +
E-mail addresses: [email protected] (S. M. Hosseini) © 2011 Growing Science Ltd. All rights reserved. doi: 10.5267/j.msl.2011.04.004
Contents lists available atGrowingScience
Management Science Letters
homepage: www.GrowingScience.com/msl
A data mining method for service marketing: A case study of banking industry
Mohammad Reza Taghvaa, Seyed Mojtaba Hosseini Bamakanb*and Samrand Toufanic
aDepartment of IT Management,University of Allameh Tabatabaee, Tehran, Iran bDepartment of IT Management,University of Allameh Tabatabaee, Yazd, Iran cDepartment of Ecommerce and Marketing, Tarbiat Modares University, Tehran, Iran
A R T I C L E I N F O A B S T R A C T
Article history:
Received February 15 2011 Received in Revised form April, 8, 2011
Accepted 9 April 2011 Available online 10 April 2011
One of the most important objectives of any modern organization is to gain competitive advantage of customers' data. In order to find hidden patterns or models from data, application of modern and steady methodologies is a necessity. Banking industry is not exceptional from this trend and they may often wish to make more profit by providing appropriate services to potential customers. Analyzing databases to manage customer behaviors seems difficult since databases are multi-dimensional, comprised of monthly account records and daily transactional records. Therefore, to analyze databases, we propose a methodology by considering human factors and building an integrated data utilization system. Moreover, self-organizing neural network map is used to identify groups of customers based on repayment behavior, recency, frequency, and monetary behavioral scoring predicators. We also perform more analysis using Apriori association rule to make marketing strategies for services used by banks.
© 2011 Growing Science Ltd. All rights reserved. Keywords:
Service marketing Self-organizing map Apriori association rule Bank Industry
1. Introduction
The new target of database marketing in banking and financial services is to provide the right product to the right customer at the right time (Cohen, 2004). However, a realistic and impressive execution of this goal is not easy to achieve. What has made this idea intricate is that companies have multiple products and operate under a complex set of business constraints. Therefore, what is knotty is to choose appropriate product to offer to a group of customers to maximize the marketing return on investment and meet the business impediment (Cohen, 2004). The aim of data mining is to obtain useful, non-explicit information from data stored in large repositories (Frawley& Piatetsky, 2001). Not only can data mining improve decision making by searching for relationships and patterns from extensive data collected by organizations, but also it can reduce information overload (Premkumar et al., 2001) and it is often applied to extract and uncover the hidden truths behind very large quantities of data (Ngai et al., 2010).
This paper outlines a framework for solving this problem. The banking industry regularly mounts campaigns to improve customer value by offering new products to existing customers. In recent years, this approach has gained significant momentum because of the increasing availability of customer data and the improved analysis capabilities in data mining. We try to present a solution, which answers the question of what products in banking industry, if any, to offer to each customer to maximize the marketing return on investment.
In order to increase the admission rate of accepting right bank products via right customers, based on a framework we will categorize customers by using self-organizing map (SOM), which transform customers to homogeneous clusters, in a way that we could explore the interrelationships of used services for each cluster.
2. Literature review
2.1Data mining in banking industry
Data mining has become a widely accepted process for organizations to improve their organizational performance and gain a competitive advantage and as a relatively new concept; it has been defined in various ways by various authors in recent days.
Data mining is used as a tool to realize automatic collection, automatic transmission, integrated query and analysis via integrating and appraising information from customers. It is also called as knowledge discovery in database (KDD)(Turban et al., 2007). Besides, data mining can be defined as a process of identifying interesting patterns in databases, which can be used in decision-making (Bose & Mahapatra, 2001). Moreover, in this process useful information and knowledge, which are implicit and unknown in advance, are extracted from a number of uncompleted, noisy, vague, and random data of the practical application. Data mining can also be defined as a process that uses statistical, mathematical, artificial intelligence, and machine learning techniques to obtain and identify valuable information and subsequently gain knowledge from a large database (Turban et al., 2007). There are some differences among all the descriptions of data mining given but there is a common issue, which is to extract important information from existing data and enable better decision making throughout an organization. In recent years, a number of data mining models and frameworks associated with banking industry have been developed by different organizations. Table 1 summarizes some the most popular ones.
Table 1
Different models
Year Research Area Indications Methods References
2003 Predictive Models for e-Banking Services
Payment Orders, SWIFT Payment Orders, Funds Transfers
Association Rules and Decision Trees
(Aggelis &Christodoulakis, 2003)
2004 data mining and behavioral scoring model in Bank Industry repayment behavior and RFM*
self-organizing map neural network and Apriori
association rule (Hsieh, 2004) 2005 customer time-variant pattern for improving recommender systems active user at different timeframes Collaborative approach, Self-organizing map filtering (Min& Han, 2005)
2007 Direct Marketing in Bank Industry by Response Modeling Purchase Behavior and RFM SVM** (Javaheri, 2008)
2008 behavioral scoring model in Bank Industry
Repayment behavior, Delay In Repayment, financial behavior
self-organizing map neural
network (Minaee & Asghari, 2008) 2008 Decision Support System in Bank Industry Capital, Collateral, Capacity in repayment, Loan Condition Decision Tree and Genetic Algorithm (Nadeali & Khanbabaees, 2008) 2010 The market of online shopping industry in Taiwan RFM/RFMD***model association rules (Supervised
Apriori algorithm) (Chiang, 2010)
2010 credit card fraud Credit Card Transactions
Logistic regression support vector machines
random forests ( Siddhartha et al., 2010)
*Recency, Frequency, Monetary ** Support Vector Machines
Based on the results reported on Table 1, we can observe that a framework which organizes the customers' data based on their profile and transactions is one of the most popular ones and this framework is adopted for the propose of this study. Furthermore, we adopt the best strategy for service marketing based on the rules between the services used by the customers in a specific cluster based on association rules. However, to categorize customers, we need to describe clustering and its indicators which will be defined in the next subsection.
2.2Marketing segmentation
Enterprises can choose only those customers who meet certain profitability criteria based on their individual needs or purchasing behaviors instead of targeting all customers equally or providing the same incentive offers to all customers (Dyche & Dych, 2001). In fact, companies segment the markets based on specific criteria of their customers and one of the most commonly way for market segmentation is clustering. By grouping several similar vectors, clusters are formed. Vectors within the same cluster include several similar features while vectors belonging to different clusters have their own features. Therefore, clusters are the results of market segmentation and clustering is commonly used for market segmentation
.
In terms of a computer-based clustering approach, it isnecessary to transform input data into numerical vectors (Chihli & Chih-Fong, 2008).
Unlike the task of classification, clustering is a data-driven task, which usually uses an unsupervised learning approach (Jain et al., 1999). RFM is one of the most important elements for clustering (Aggelis & Christodoulakis, 2005). RFM is a three-dimensional way of ranking customers to determine the top 20%, or best, customers. It is based on the 80/20 principle where 20% of customers bring in the 80% of revenues. RFM Analysis is a marketing technique that uses three features includes recency, frequency and monetary values of customers to predict whether they are likely to buy again or not. Essentially, RFM analysis suggests that the customer with high RFM score should normally conduct more transactions and lead to higher profit for the bank (Aggelis & Christodoulakis, 2005; Aggelis, 2004). The following features are calculated for this specific period.
• Recency(R) is the date of the user’s last transaction.
• Frequency(F) defines the number of financial transactions that user conducted within
specific period.
• Monetary(M)is the total value of financial transactions that user made within the above stated period.
There are two main clusters in terms of visualized market segmentation approaches, The first group is the traditional statistical method, such as the hierarchical cluster analysis (Dillon, 1984). This approach builds a dendrogram by comparing each vector and therefore is able to present the visualized market segmentation process by cutting the dendrogram. The second group is the neural network approach, such as the self-organizing map (SOM) (Kohonen, 1995; Kohonen, 2001), which projects and clusters high-dimensional input vectors into a low-dimension visualized map, usually in forms of two-dimension for visualization. Inspired by the organization of biological neural systems, in which neurons with similar functions are located together, SOM is able to map similar input vectors into the same or similar output units based on two dimensional map. Therefore, output units will self-organize to an ordered map and those output units with similar weights are also placed nearby after training. Until now, most existing data mining approaches have been discovering general rules (Setiono et al., 1998), predicting personal bankruptcy (Desai et al., 1996) and credit scoring (Kim et al., 2004) in bank databases. Few works have studied the mining of bank databases from the viewpoint of customer behavioral scoring. More specifically, we would rather look at both the account data of the customers and their account transactions. With these data, the aim is to discover interesting patterns in the data that could provide clues about what incentives a bank could offer as better marketing strategies to its customers. However, to cluster customer and pattern recognition, we use self-organizing map, which discussed in the next section.
2.3 Self organizing map(SOM)
The self-organizing map (SOM), proposed by Kohonen (2001) has been widely used in many industrial applications such as pattern recognition, biological modeling, data compression, signal processing, and data mining. It is an unsupervised and nonparametric neural network approach. The most important characteristic of SOM algorithm lies in its simplicity, which makes it easy to understand, simulate and use in many applications. The basic SOM consists of a set of neurons usually arranged in a two-dimensional structure such that there are neighborhood relationships among the neurons. After completion of training, each neuron is attached to a feature vector of the same dimension as the input space. By assigning each input vector to the neuron with the nearest feature vector, the SOM is able to divide the input space into regions with common nearest feature vectors. Clustering algorithms attempt to organize unlabeled input vectors into clusters or “natural groups” such that points within a cluster are more similar to each other than vectors belonging to different clusters (Pal et al., 1993).
The SOM consists of M neurons located on a regular low dimensional grid, usually one or two dimensions. Higher dimensional grids are possible, but they are not generally used since their visualization is problematic and the lattice of the grid is either hexagonal or rectangle.
The basic SOM algorithm is iterative where each neuron i has a d-dimensional feature vector wi =
[wi1,….,wid]. At each training step t, a sample data vector x(t) is randomly chosen from the training
set. Distances between x(t) and all the feature vectors are computed. The winning neuron, denoted by c, is the neuron with the feature vector closest to x(t)(Sitao & Tommy, 2003):
}. , , 1 { , ) ( min arg x t w i M c= − i ∈ L (1)
A set of neighboring nodes of the winning node is denoted as Nc. We define hic(t) as the
neighborhood kernel function around the winning neuron c at time t. The neighborhood kernel function is a non-increasing function of time and of the distance of neuron i from the winning neuron c. The kernel can be taken as a Gaussian function (Sitao & Tommy, 2003) with the following,
c t pos pos ic t e i N h c i ∈ = − − , ) ( 2 2 ) ( 2δ (2) Where posi is the coordinates of neuron i on the output grid and σ (t) is kernel width. The weight
update rule in the sequential SOM algorithm can be written as follows,
⎩ ⎨ ⎧ + − ∀ ∈ = + otherwise. ) ( ), ( )) ( )( ( ) ( ) ( ) 1 ( t w n i t w t x t h t t w t w i c i ic i i
ε
(3)Both learning rate (t) and neighborhood σ (t) decrease monotonically with time. During training, the SOM behaves like a flexible net those folds onto a “cloud” formed by the training data. Because of the neighborhood relations, neighboring neurons are pulled to the same direction, and thus feature vectors of neighboring neurons resemble each other. Data analyzed from clustering of customers will be used as an entry to identify the favorite services of each cluster. However, to find and to understand the relationships among different variables, we need to use associate rules. In the next, associate rules and their indicators will be described in details.
2.4Association rules mining
Association rules (Agrawal & Swami, 1993) are applied to discover relationships between variables in transaction databases. Analyses based on association rule mining have been conducted on a wide variety of datasets and they are particularly useful for the analysis of big datasets.
Given a non-empty set I, an association rule is a statement of the formA⇒B, where A,B⊂ I such that A≠ , B ≠ and A ∩ B =A ≠ . The set A is called the antecedent of the rule and the set B is named the consequent of the rule. The set I is called the itemset and note that the usage of ‘itemset’ differs from some other definitions that may consider all subsets of I as ‘itemsets’ (Wu & Chow, 2003). Association rules are mined over a set of transactions, denoted as , , … . , . The interestingness of an association rule is commonly characterized by functions called ‘support’, ‘confidence’ and ‘lift’(McNicholas & Murphyb, 2008).
The notation P (A) represents the proportion of times that the set A appears in a transaction set . Similarly, P(A,B)represents the proportion of times that the sets A and B coincide in transactions and P(B|A) =P(A,B)/P(A)denotes the proportion of times that the set B appears in all of the transactions involving the set A. So If A and B are two different items, A→ B is an associate rule that include functions listed below:
• Support means the number of times where the rule A→ B appears in data transaction.
• The minimum support of the rule, which is the minimum support of the rule is defined by user
in advance. For example a Support=50%means that A and B are bought in 50 percent of transactions.
• Confidence shows the number of times that if the antecedent of the rule happens, the
consequent of the rule will occur too. Confidence shows the validity of the rule. For example, Confidence=85% means that in 85%of the cases who buy A will buy B too (McNicholas & Murphyb, 2008). Also, like minimum support, Minimum confidence, which is the minimum support of the rules, is defined by user in advance:
• Lift is used as an indicator to appraise how important is the existence of one rule. The formula to estimate lift is represented by Lift= Confidence (X⇒Y)/ Support (Y) or as Eq. (4) as follows, . ) ( ). ( ) ( P(Y) X) | P(Y Lift Y P X P Y X P I = = (4)
If lift is greater than one, it will be more likely that X and Y happen simultaneously than independently. In addition, if lift is equal to 5, it shows that if X is in the item list, 5Y times more it will be put in the item list than when it is not in the item list.
3. Research methodology
To discover associate rules among services of banks and offering services to right customers, we use the data of an Iranian bank named Parsian as one of the best private banks in Iran. This is one of the pioneer private banks, which started its activities in 2001.
3.1Research questions
We try to find the relationship among indicators and make a new knowledge by discovering the information and scrutinizing the pattern behavior of past customers. This study uses a systematic approach to answer the research questions. Therefore, the framework of this research is based on two sectors. First, we attempt to segment the customers and then we try to discover the associate rules among services in each cluster. The following summarizes the necessary questions of this proposed study,
i. How could we provide a suitable service for potential customers with data mining
techniques?
3.2Research constructs
In this research, three group indicators are used
.
iii. Profile data: This indicator consists of sex, age, education, marital status, job, etc. iv. Presentation of services via bank. Such services are available in e-banking business.
v. Financial transactions of banks: These services include receipt of withdrawing money in a specific period via customers. All indicators are listed in Table 2.
Table 2
Definition of variables
Definition Variable
Row
Number assigned to each customer ID 1 Customer's age Age 2 Birth Location Birth-L 3 Gender Sex 4 Education Education 5 Job Job 6
the time period of last purchase during an analyzing time period R
7
The number of purchases during an analyzing time period F
8
The amount of spent money during an analyzing time period M
9
Use ATM to withdraw money ATM-WM
10
Use of ATM to announce inventory ATM-AI
11
Using ATM to transfer funds ATM-TF
12
Using ATM to receive account transactions ATM-RT
13
Using ATM to pay bills ATM-PB
14
Using the Internet to purchase goods Int-PB
15
Using the Internet to announce inventory Int-AI
16
Using the Internet for money transferring Int-MT
17
Using Internet to receive account transactions Int-RT
18
Using the Internet for activities related to Check Int-Ch
19
Using the Internet to pay bills Int-PB
20
Using the Phone to announce inventory Phone-AI
21
Using the Phone for money transferring Phone-MT
22
Using the Phone to pay bills Phone-PB
23
Using the Phone for activities related to Check Phone-Ch
24
Using the Mobile to announce inventory Mobile-AI
25
Using the Mobile to pay bills Mobile-PB
26
Using Mobile to receive account transactions Mobile-RT
27
Using POS to Purchase goods POS-PG
28
Using the POS to announce inventory POS-AI
29
Using POS to receive account transactions POS-RT
30
4. Analyzing data
Behavioral variables are used to analyze the behavior of customers and they are considered as input for SOM technique. In neural network, indicators should be first normalized.As describe in 2.2, self organizing map (SOP) is used as a technique to cluster customers. Customers will be segmented based on their characteristics. We cannot only use this segmentation to find preference of customers but also find common characteristics of customers. Nevertheless, indicators must be normalized in the network and the normalization can be done using max-min technique based on Eq. (5).This method is
based on the distance between minimum and maximum dots and make this measurement by the difference between these two dots.
. ) min( ) max( ) min( * X X X X X i − − = (5)
Normalizing variables to segment customers are implemented using SPSS Clementine and SOM module. The output of network is 5*3 matrixes in which customers are clustered based on the average of each section of matrix and on their common characteristics. Clustering of customers in this part helps us evaluate characteristics of similar customers and find the preference of each group (Table3). Table 3
Clustering of customers found from SOM
In the next, to find the best cluster, which has more customers and the best average grade of financial variables with the highest frequency, we investigate the behavioral pattern and discover the associate rules of each cluster. Therefore, cluster with coordinate X=0, and Y=2 which consists of 981 is considered superior to the others and it is chosen for our investigation case.
4.1Identification of associate rules
In this section, Data analyzed from clustering of customers will be used as an entry to identify the favorite services of each cluster. To discover the relationship between different groups of customers and their favorite services, Apriori algorithm will be used(Aggelis, 2004).One of the earliest algorithms used to find the association rules is Apriori algorithm (Aggelis, 2004). The algorithm is an influential method for mining frequent item sets according to boolean association rules. In this stage, before analyzing customers of each cluster, customers will be put in two groups of test and supervisory. Test group is used to evaluate the correctness of relationship of associate rules and verification of results. Therefore, based on the cluster found in section IV, 80% of customers are used as data of supervisory and 20% of them as data of test group. Based on data of supervisory group, the Apriori algorithm with support level of 20% and confidence level of 70% is used to identify the relationship among services used in our selected cluster. Some of these rules are summarized in Table 4.The discovered rules demonstrate the relationship of different services for our selected cluster.
R: 0.482 F: 0.613 M: 0.423 Records:357 R: 0.354 F:0.556 M:0.504 Records: 181 R:0.392 F:0.523 M:0.464 Records: 354 R:0.415 F:0.439 M:0.466 Records: 189 R:0.453 F:0.5 M:0.446 Records: 981 2 $KY-Kohnen R:0.419 F: 0.57 M:0.493 Records:27 R: 0.642 F: 0.307 M: 0.537 Records:30 R:0.514 F:0.325 M:0.5 Records:91 R:0.535 F:0.457 M:0.467 Records: 142 1 R: 0.449 F: 0.503 M: 0.45 Records: 863 R:0.444 F:0.492 M:0.445 Records:823 R:0.526 F:0.329 M:0.485 Records:133 R: 0.54 F: 0.481 M: 0.431 Records: 829 0 4 3 2 1 0 $KX-Kohnen
Table 4
Rules made from services used by selected cluster
Based on results found from rules, we found that customers prefer 12 services to other services, which are listed below:
ATM-WM: Use ATM to withdraw money ATM-AI: Use of ATM to announce inventory ATM-PB: Using ATM to pay bills
ATM-TF: Using ATM to transfer funds
Mobile-AI: Using Mobile to announce inventory
Mobile-RT: Using Mobiles to receive account transactions Phone-PB
:
Using Phone to pay billsPhone-AI: Using Phone to announce inventory POS-PG: Using POS to Purchase goods
Int-RT: Using Internet to receive account transactions Int-PB: Using Internet to purchase goods
Int-PB
:
Using the Internet to pay billsTo evaluate the correctness of recommendation, we use MAE statistic variables on test and supervisory. The mean absolute error (MAE) is the average of the absolute value of the residuals (error). The MAE is similar RMSE but it is less sensitive to large errors (Min & Han, 2005).MAE is evaluated viaEq. (2). In this equation, Pi is suggestion of system or predicted values by system and Ti is actual value of data. We have two different groups: Test and Supervisory. Test Group is a group of customers who did not enter the favorite services after clustering. Therefore, to obtain the MAE, the sums of the differences between the absolute values of the predicted data of the association rules in one cluster with the actual results are computed. Finally, you can average these errors across all compared items. Consequently, to estimate MAE, first, based on the discovered services for this cluster of customer in supervisory database, some suggestion from system for this group are presented. Next, the MAE values for test and supervisory groups are estimated via Eq. (6) as follows,
. 1 1 ∑ − = = N i i i i P T n E (6)
The results shown in table 6 indicate that the difference between the test and supervisory groups is trivial (0
.
493885-0.
492308=0.001).Row Consequent Antecedent Support % Confidence %
1 POS-PG ATM-WM and Int-RT and ATM-AI 11.51 68.70
2 POS-PG ATM-WM and Phone-PB and Int-RT 11.41 68.42
3 Int-RT ATM-PB and ATM-WM 8.21 68.29
4 Mobile-RT Int-PB 8.91 66.29
5 ATM-WM Int-PB and POS-PG 10.61 66.04
6 POS-PG ATM-WM and Int-RT and ATM-AI 13.21 65.91
7 Phone-PB Int-PB 11.71 65.81
8 POS-PG ATM-WM 11.71 65.81
9 Phone-PB Int-RT and ATM-AI 13.11 65.65
10 Phone-PB POS-PG and ATM-AI 12.51 65.60
11 Int-PB ATM-PB and ATM-WM and Phone-AI 9.31 65.59
12 ATM-TF Int-PB and Phone-AI 8.71 65.52
13 ATM-WM POS-PG and Int-RT 11.21 65.18
14 ATM-WM Int-PB and POS-PG and Int-RT 11.91 64.71
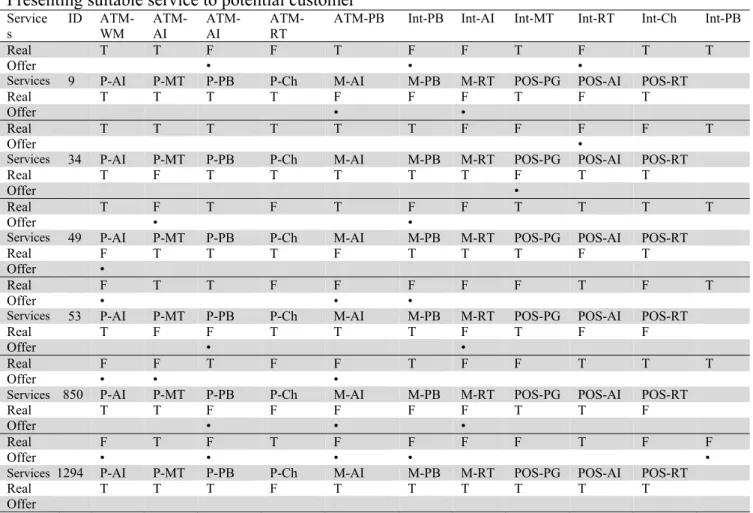
Table 5
Presenting suitable service to potential customer
Service s ID ATM-WM ATM-AI ATM-AI ATM-RT
ATM-PB Int-PB Int-AI Int-MT Int-RT Int-Ch Int-PB
Real T T F F T F F T F T T
Offer • • •
Services 9 P-AI P-MT P-PB P-Ch M-AI M-PB M-RT POS-PG POS-AI POS-RT
Real T T T T F F F T F T
Offer • •
Real T T T T T T F F F F T
Offer •
Services 34 P-AI P-MT P-PB P-Ch M-AI M-PB M-RT POS-PG POS-AI POS-RT
Real T F T T T T T F T T
Offer •
Real T F T F T F F T T T T
Offer • •
Services 49 P-AI P-MT P-PB P-Ch M-AI M-PB M-RT POS-PG POS-AI POS-RT
Real F T T T F T T T F T
Offer •
Real F T T F F F F F T F T
Offer • • •
Services 53 P-AI P-MT P-PB P-Ch M-AI M-PB M-RT POS-PG POS-AI POS-RT
Real T F F T T T F T F F
Offer • •
Real F F T F F T F F T T T
Offer • • •
Services 850 P-AI P-MT P-PB P-Ch M-AI M-PB M-RT POS-PG POS-AI POS-RT
Real T T F F F F F T T F
Offer • • •
Real F T F T F F F F T F F
Offer • • • • •
Services 1294 P-AI P-MT P-PB P-Ch M-AI M-PB M-RT POS-PG POS-AI POS-RT
Real T T T F T T T T T T
Offer
P-AI: Phone-AI, M-PB:Mobile-PB
Therefore, we can conclude that, the framework designed to present a favorite service to potential customers is an acceptable one.
Table 6 MAE result
5. Conclusion
In this paper, we have presented a data mining approach to study the behavior of bank industry customers. The study consists of two groups of variables, 30 variables for investigating the behavioral pattern of customers were found and by using Kohonen neural network, the output neuron of 5*3 matrix was extracted and customers were perched into 13 clusters. This clustering was based on behavioral pattern of each cluster where one cluster with coordinates X=0 and Y=2 among all which consisted of 981 customers and with variable R: 0.453,F: 0.5 and M: 0.446 were selected to investigate more to recognize the associate rules among all services of this group. In the second phase of the research, we look to find out about the present suitable service to potential customer. Our results indicate that 12 out of 21 services were used more often and the results were also approved by associate rule.
References
Aggelis, V., & Christodoulakis, D. (2003). Association Rules and Predictive Models for e-Banking Services. In 1stBalkan Conference on Informatics.
Test Group Supervisory Group Test 0
.
492308 0.
493885 MAEAggelis,V., & Christodoulakis, D. (2005). RFM analysis for decision support in e-banking area.WSEAS Transactions on Computers Journal. ISSN 1109-2750.
Aggelis, V. (2004). RFM analysis with data mining. scientific yearbook, Technological Education Institute of Piraeus.
Agarwal, R., Imielinski, T., & Swami, A. (1993). A mining association rules between sets of items in large databases. ACM SIGMOD International Conference on Management of Data. Washington DC, USA. Bose, I., & Mahapatra, R. K. (2001). Business data mining-a machine learning perspective. Information
Management, 39(3), 211-225.
Bhattacharya, S., Jha, S., Tharakunnel, K., Westland, J. C. (2010). Data mining for credit card fraud: A comparative study. Decision Support Systems, 50(3), 602-613.
Cohen, M. D. (2004). Exploiting response models-optimizing cross-sell and up-sell opportunities in banking. Information Systems, 29, 327–341.
Chiang, W. Y. (2011). To mine association rules of customer values via a data mining procedure with improved model: An empirical case study. Expert Systems with Applications, 38(3), 1716-1722.
Desai, V. S., Crook, J. N., & Overstreet, G. A. (1996). A comparison of neural networks and linear scoring models in the creditunion environment. European Journal of Operational Research, 95, 24-37.
Dillon, W. R. & Goldstein, M. (1984). Multivariate analysis. John Wiley & Sons Inc.
Dyche, J., & Dych, J. (2001). The CRM handbook: a business guide to customer relationship management. Reading, MA: Addison-Wesley.
Frawley, W. J., Piatetsky-Shapiro, G., & Matheus, C. J. (2001). Knowledge discovery in databases: an overview. AI Magazine, 13(3), 57–70.
Hsieh, N. C. (2004). An integrated data mining and behavioral scoring model for analyzing bank customer. Expert Systems with Applications, 27, 623–633.
Hung C., Tsai, C. F. (2008). Market segmentation based on hierarchical self-organizing map for markets of multimedia on demand. Expert Systems with Applications, 34, 780–787.
Jain, A. K., Murthy, M. N., & Flynn, P. J. (1999). Data clustering: a review. ACM Computing Surveys. 31(3), 264–323.
Javaheri, H. (2008). Response modeling in direct marketing, A data mining based approach for target selection. Master Thesis, Department Industrial Engineering, Tarbiat Modares University.
Kim, Y. S., & Sohn, S. Y. (2004). Managing loan customers using misclassification patterns of credit scoring model. Expert Systems with Applications, 26, 567–573.
Kohonen, T. (2001). Self-organizing maps (3rded.). Berlin, Heidelberg,New York: Springer-Verlag.
Kotler, Ph., & Keller K. (2008). Marketing Management (13th Edition). Prentice Hall.
McNicholas, P.D., Murphy B., & O’Regan M. (2008). Standardising the lift of an association rule. Computational Statistics and Data Analysis, 52, 4712–4721.
Min, S. H. & Han, I. (2005). Detection of the customer time-variant pattern for improving recommender systems. Expert Systems with Applications, 28, 189–199.
Minaee, B., & Asghari, F. (2008). An integrated data mining and behavioral scoring model for analyzing bank customers, 2ndIran Data Mining Conference (IDMC2008), 11- 12 NOV, Amir Kabir University.
Nadeali, A., & Khanbabaees, M. (2008). Implementing of decision tree and genetic algorithm for crediting banks’ customers in decision support system. 2nd Iran Data Mining Conference (IDMC2008), 11- 12 NOV, Amir Kabir University.
Ngai E.W.T., Hu, Y., Wong Y. H., Chen Y., & Sun X. (2010). The application of data mining techniques in financial fraud detection: A classification framework and an academic review of literature. Decision Support Systems, 50(3), 559-569.
Pal, N. R., Bezdek, J. C., & Tsao, E. C. K. (1993). Generalized clustering networks and Kohonen’s self-organizing scheme. IEEE Transaction on Neural Networks, 4(4), 549–557.
Setiono, R., Thong, J. Y. L., & Yap, C. S. (1998). Symbolic rule extraction from neural networks—an application to identifying organizations adopting IT. Information and Management, 34(2), 91–101.
Turban, E., Aronson, G. E., Liang, T. P., & Sharda, R. (2007). Decision support and business intelligence systems (Eighth ed.). Pearson Education.
Wu, S., & Chow, T. W. S.(2003). Clustering of the self-organizing map using a clustering validity index based on inter-cluster and intra-cluster density. Pattern Recognition, 37, 175 – 188.
Zhu, D., Premkumar, G., Zhang, X., & Chu, C.Fall. (2001). Data mining for network intrusion detection: A comparison of alternative methods. Decision Sciences, 32(4), 635–660.