Article
Energy Efficiency and Network Performance:
A Reality Check in SDN-Based 5G Systems
†
Adriana Fernández-Fernández * ID, Cristina Cervelló-Pastor ID and Leonardo Ochoa-Aday ID Department of Network Engineering, Universitat Politècnica de Catalunya (UPC), Esteve Terradas, 7, 08860 Castelldefels, Spain; [email protected] (C.C.-P.); [email protected] (L.O.-A.) * Correspondence: [email protected]; Tel.: +34-93-413-7027
† This paper is an extended version of our paper published in Fernández-Fernández, A.; Cervelló-Pastor, C.; Ochoa-Aday, L. Evaluating the Impact of Energy-Aware Routing on Software-Defined Networking Performance. In Proceedings of the XIII Jornadas de Ingeniería Telemática (JITEL 2017), Valencia, Spain, 27–29 September 2017.
Received: 14 November 2017; Accepted: 11 December 2017; Published: 14 December 2017
Abstract: The increasing power consumption and related environmental implications currently generated by large data networks have become a major concern over the last decade. Given the drastic traffic increase expected in 5G dense environments, the energy consumption problem becomes even more concerning and challenging. In this context, Software-Defined Networks (SDN), a key technology enabler for 5G systems, can be seen as an attractive solution. In these programmable networks, an energy-aware solution could be easily implemented leveraging the capabilities provided by control and data plane separation. This paper investigates the impact of energy-aware routing on network performance. To that end, we propose a novel energy-aware mechanism that reduces the number of active links in SDN with multiple controllers, considering in-band control traffic. The proposed strategy exploits knowledge of the network topology combined with traffic engineering techniques to reduce the overall power consumption. Therefore, two heuristic algorithms are designed: a static network configuration and a dynamic energy-aware routing. Significant values of switched-off links are reached in the simulations where real topologies and demands data are used. Moreover, the obtained results confirm that crucial network parameters such as control traffic delay, data path latency, link utilization and Ternary Content Addressable Memory (TCAM) occupation are affected by the performance-agnostic energy-aware model.
Keywords:5G; software-defined networking; energy-aware routing; in-band control traffic
1. Introduction
Over the last decade, the exponential demand growth and the ever-increasing number of connected
devices have forced the necessity to look to the next evolution of wireless data communications [1].
The adoption of 5G networks, expected by 2020, will allow handling more traffic in dense environments,
providing higher data rates and reduced end-to-end latency [2]. In this scenario, achieving energy
efficiency becomes even more concerning and challenging. For instance, according to [3], by 2025,
the global Internet will be responsible for more than 10% of the world’s electricity consumption. To face this steadily rising power consumption, a strongly related Key Performance Indicator (KPI)
to be addressed by the 5G generation is precisely the energy efficiency [4]. Accordingly, an effective
energy management, as well as enhanced network performance, are essential design goals to fulfill the requirements of future 5G systems for heterogeneous applications and services. However, some of these requirements may be in conflict, and specific strategies must be developed. Precisely, the existing trade-off between energy efficiency and network performance was investigated as part of a conference
paper in [5] and is now further expanded in this article.
Energy consumption concern in 5G system has currently attracted a great deal of attention from networking researchers. Several papers have been proposed with solutions enabling significant energy
efficiency gains in the mobile networks division [6–8]. Although 5G is mostly perceived as wireless
access by the user, different communication facilities and users need to be connected through backhaul networks—either using optical fiber networks or radio links—and backbone networks. Apart from being key enablers for a successful deployment of this complex architecture, these network segments are of paramount importance to reduce the energy consumption of 5G systems. Therefore, this paper is conceived to tackle the energy consumption problem in 5G backbone networks.
Software-Defined Networking (SDN) is expected to play a major role in 5G systems in order to
provide a more intelligent use of the underlying transport networks [9]. Moreover, this technology,
together with Network Function Virtualization (NFV), can provide the required tools to support network slicing in order to accommodate the wide range of demanded services over a common
infrastructure simultaneously [10–12]. The basic idea of SDN [13]—control and data planes
separation—makes network environments more manageable. The logically centralized control plane in SDN provides global knowledge of the network state information, which allows for end-to-end visualization. Moreover, it can manage network tasks and perform device programming without needing any additional software or hardware-based intelligence in each one of the switching elements. Meanwhile, interconnection devices follow the rules set by the controller to forward the traffic. Consequently, the use of an underlying SDN architecture will facilitate the introduction and deployment of new applications and services, making it easier than with classical hardware-dependent standards. Another advantage of exploiting SDN is the possibility to dynamically adapt control decisions to comply with diverse QoS requirements to handle heterogeneous application-driven networks.
Given that in practice, the energy consumption of network equipment is not in proportion with their traffic load, the reduction of the number of active elements is an effective and widely-accepted
strategy to decrease the consumption of data networks [14]. This feature can be implemented by
putting into sleep mode (i.e., a low-power state) unused networks elements such as line cards or port interfaces. Although turning off entire interconnection devices improves the energy efficiency, this possibility is not considered in this work given the resilience concerns in the case of network events. Nevertheless, due to the link over-provisioning typically considered in the design and operation of backbone networks, substantial energy can still be saved putting into sleep mode port interfaces that are not transferring data. Within this context, SDN architecture is very well-suited to perform an energy-aware routing and to manage the state of unused switch interfaces in a coordinated and centralized way. Therefore, the implementation of an energy-aware solution in the control plane is a valuable opportunity to solve the power consumption problem in data networks.
Despite consistent efforts to improve the network power efficiency, energy-aware techniques may
lead to performance degradations if QoS requirements are neglected [15,16]. Inspired by this reality,
this paper introduces a new energy-aware strategy and evaluates its impact on different performance metrics. Instead of restricting the path selection and potential improvements in terms of energy efficiency to meet some specific metric bound, this work aims to gain insight into potential energy savings and to quantify the existing trade-off between power consumption and several performance indicators, as one crucial issue for communication systems nowadays.
Throughout this work, we consider an SDN architecture with multiple controllers and, similar to
previous works [17–19], in-band control traffic. In this operational mode, links are shared between data
and control plane traffic. Hence, control messages are exchanged without the need for additional links. In this way, the proposed energy-aware routing can be applied when implementing a dedicated control network is not feasible either for physical or cost-related restrictions. In large backbone networks, this is a more realistic scenario since additional links dedicated to directly connect controllers and forwarding devices are impractical and cost-inefficient.
• An Integer Linear Problem (ILP) is formulated to optimize the number of active links in SDN, considering multiple controllers and links shared between data and control plane traffic.
• For large network topologies, we propose a novel energy-aware mechanism that reduces the time
complexity of our approach and allows allocating the traffic demands in real time as it comes.
• Two solution modules were conceived of in this mechanism, exploiting knowledge of the network
topology and traffic engineering techniques to reduce the overall power consumption.
• Using real topologies and traffic demands, we provide a performance comparison analysis of our
proposal with another routing approach.
The remainder of this paper is structured as follows. In Section2, previous related studies about
different strategies to tackle the problem of power consumption are discussed. In Section3, the energy
consumption optimization problem is formalized through a general mathematical formulation fully
compatible with SDN environments using multiple controllers and in-band control traffic. In Section4,
we explain the main characteristics of our low-complexity energy-aware approach together with a detailed description of its two comprised modules. The simulations strategies and the obtained
results are presented and analyzed in Section5. Finally, in Section6, we provide the conclusion of our
work and outline future research guidelines.
2. Related Works
Energy-aware techniques based on the reduction of active network elements can be divided into traffic-based and topology-based solutions, according to the elements considered in the model. In this section, we analyze in more detail works that deal with each one of these two approaches.
2.1. Traffic-Based Solutions
Under some assumption of expected traffic behavior, traffic-based solutions are routing mechanisms that aggregate traffic over a network subset in over-provisioned systems, in order to switch off the unused network components.
For instance, Zhang et al. [20] propose an intra-domain, centralized traffic engineering mechanism,
called GreenTE, that finds a set of links that can be turned off under a given traffic load or matrix. The approach is based on a Mixed-Integer Linear Programming (MILP) formulation where traffic demands are routed using a set of pre-computed k-shortest paths. Performance requirements such as Maximum Link Utilization (MLU) and network delay are considered as constraints in the problem. However, the implementation of such a coordinated strategy is a difficult task given the distributed nature of network control in traditional networks.
More recently, in [21], the authors introduced a state-of-the-art study including different energy
efficiency strategies in SDN. This paper addresses the importance of implementing green routing methods in SDN, taking advantage of the flexible control provided by dynamic configuration and centralized network view capabilities. A summary of some existing energy-aware techniques in SDN with their key properties (benefits and drawbacks) is presented.
The problem of saving energy in partially deployed SDN is addressed by the authors of [22].
They formulated an optimization problem to determine network subsets in these hybrid systems
with minimum power consumption. Giroire et al. [23] proposed an energy-aware routing approach
considering as a constraint of the model the limited rule space of Ternary Content Addressable Memory (TCAM) in SDN devices. For this purpose, an ILP formulation, as well as an efficient heuristic are
proposed. The authors of [24] provided two greedy algorithms to reduce the power of used line-cards
and integrated chassis. To do so, they used the connections between forwarding devices to derive an
expanded network topology. Markiewicz et al. [25] formulated an MILP model that aims to switch on
a minimum number of routers and links to handle the traffic. To solve the problem for large networks, they present a heuristic method, called Strategic Greedy Heuristic (SGH), that iteratively selects a pre-computed shortest path for each request, according to four different strategies of processing order
of requests. Nevertheless, in all these works, a dedicated network for control plane communications was considered.
In [26], the authors proposed a model for controller-switch associations, called GreCo, which improves
the energy efficiency of the network. In this work, the routing of control traffic is included. However, they considered that controllers act as well as forwarding devices, allowing that data plane communications are routed through network controllers. In this way, only links belonging to control paths are activated while data traffic demands are routed using these links under a given MLU bound. In our work, the routing of data plane traffic through network controllers is avoided, since this will represent an additional unnecessary load in these devices.
The work in [27] addressed the problem of minimizing the number of required links in large-scale
SDN considering an in-band operation mode. To accomplish this, an ILP model and a heuristic algorithm are presented, integrating the routing requirements for data and control traffic. In this model, the distribution of switches between controllers is also optimized in terms of energy efficiency
and load balancing. In [28], a distributed routing algorithm optimizing the energy consumption in
large-scale SDN with multiple domains is proposed. This solution, called Distributed Energy-Aware Routing (DEAR), finds the minimum number of links needed to satisfy a given traffic matrix. Despite being efficient models, the complexity of considering the entire topology for the selection of the most suitable routes can be very expensive in networks with major path redundancy. To the contrary, in this work, after pruning the network topology, the number of paths and the consequent computation complexity are significantly reduced.
2.2. Topology-Based Solutions
The lack of awareness of traffic conditions in typical operative networks has led to several research works that, in order to reduce the number of active links, are oriented to control the network topology. Basically, these approaches modify the existing topology considering different requirements such as the resulting connectivity.
In [29], the authors present an Open Shortest Path First (OSPF)-based routing mechanism that
considers the topological information exchanged among routers. The proposed EAR algorithm is based on the definition of the “exportation” mechanism where a Shortest Path Tree (SPT) is shared between neighbor nodes. The routers with the highest node-degree, called “exporters”, calculate the SPTs that are used to route the traffic and force the use of these paths to all their neighbors, which reduces the
overall set of active links. The exportation mechanism is enhanced in [30], where the concept of “move”
was introduced turning the energy saving routing problem into a formulation of the well-known maximum clique problem in an undirected weighted graph.
The authors in [31] proposed a routing algorithm denoted as Energy Saving based on Algebraic
Connectivity (ESACON), using the algebraic connectivity as a metric to control the resulting network topology. Based on this metric, ESACON is able to identify and switch off the network links that affect the network connectivity less, keeping this value over a given threshold.
Similarly, the topology-based solution reported in [32] also takes into account the algebraic
connectivity as a requirement to preserve the overall network connectivity. This work also considers the edge betweenness as a metric to measure the links role in the network, placing the links least frequently used as the first candidates to be pruned. However, this approach is conceived of to be implemented in a distribute way into each IP router.
The work in [33] also aims to improve the energy efficiency reducing the number of links that will
remain active. For this purpose, the authors propose four different versions of the algorithm called Energy Saving based on Occurrence of Links (ESOL) that show the trade-off between complexity and efficiency in putting into sleep mode a great number of links. The parameters used in this approach to select the network interfaces to be switched off are the occurrences of nodes and links in shortest paths, extracted from the network topology by using the classical Dijkstra algorithm.
The analysis of including QoS requirements in an energy-aware topology-based solution is
discussed by the authors of [34]. Their approach, called Energy Saving IP Routing (ESIR), is also
based on the concepts of SPT exportation and move, but constrained to a maximum load boundary on network links in the traffic-aware scenario. However, in their study, fixed requirements are considered, which is impractical and limits the suitability of their work for dynamic and heterogeneous network services.
All the previously-described works mainly tend to minimize the number of active network elements in the current topology restricting the path selection to meet some specific metric bound or connectivity rate and fail to extensively examine the impact of energy-aware routing on SDN performance. Moreover, their lack of awareness about the requirements of incoming connection requests can lead to performance degradations, which is highly undesired.
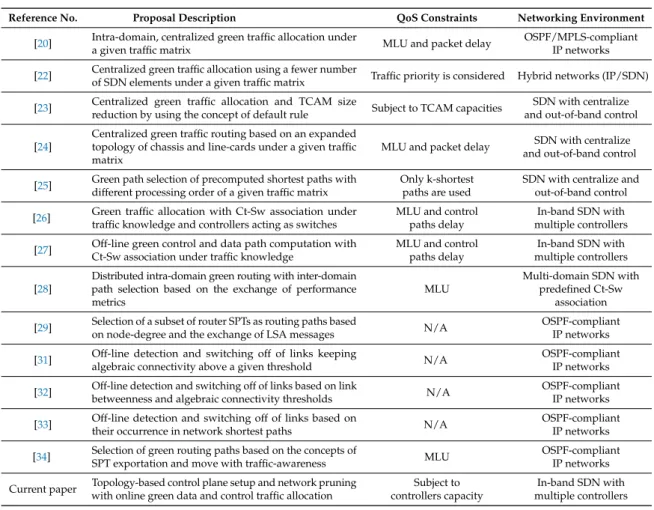
A summary of the discussed energy-aware proposals is presented in Table1. Each row in the table
refers to a different approach. Meanwhile, columns refer to a particular feature: proposal description, performance metrics used as constraints and networking scenario considered. Our approach is also included in the table, where a novel point of view, fully compatible with current dynamic networking environments, is exploited.
Different from the aforementioned works, the aim of this paper is to provide a low-complexity energy-aware strategy, which will be used to evaluate its impact on crucial performance metrics, considering an SDN architecture with multiple controllers and in-band control traffic.
Table 1.Comparison between the proposed approach and other existing related works. MLU, Maximum Link Utilization; OSPF, Open Shortest Path First; MPLS, Multiprotocol Label Switching; TCAM, Ternary Content Addressable Memory; SPT, Shortest Path Tree; LSA, Link State Advertisements.
Reference No. Proposal Description QoS Constraints Networking Environment
[20] Intra-domain, centralized green traffic allocation under
a given traffic matrix MLU and packet delay
OSPF/MPLS-compliant IP networks [22] Centralized green traffic allocation using a fewer numberof SDN elements under a given traffic matrix Traffic priority is considered Hybrid networks (IP/SDN) [23] Centralized green traffic allocation and TCAM size
reduction by using the concept of default rule Subject to TCAM capacities
SDN with centralize and out-of-band control [24]
Centralized green traffic routing based on an expanded topology of chassis and line-cards under a given traffic matrix
MLU and packet delay and out-of-band controlSDN with centralize
[25] Green path selection of precomputed shortest paths withdifferent processing order of a given traffic matrix Only k-shortestpaths are used SDN with centralize andout-of-band control [26] Green traffic allocation with Ct-Sw association under
traffic knowledge and controllers acting as switches
MLU and control paths delay
In-band SDN with multiple controllers [27] Off-line green control and data path computation with
Ct-Sw association under traffic knowledge
MLU and control paths delay
In-band SDN with multiple controllers [28]
Distributed intra-domain green routing with inter-domain path selection based on the exchange of performance metrics
MLU
Multi-domain SDN with predefined Ct-Sw
association [29] Selection of a subset of router SPTs as routing paths based
on node-degree and the exchange of LSA messages N/A
OSPF-compliant IP networks [31] Off-line detection and switching off of links keeping
algebraic connectivity above a given threshold N/A
OSPF-compliant IP networks [32] Off-line detection and switching off of links based on linkbetweenness and algebraic connectivity thresholds N/A OSPF-compliantIP networks [33] Off-line detection and switching off of links based on
their occurrence in network shortest paths N/A
OSPF-compliant IP networks [34] Selection of green routing paths based on the concepts of
SPT exportation and move with traffic-awareness MLU
OSPF-compliant IP networks Current paper with online green data and control traffic allocationTopology-based control plane setup and network pruning controllers capacitySubject to multiple controllersIn-band SDN with
3. The Energy-Aware Routing Problem in SDN
To formalize the energy consumption optimization problem, we consider an SDN represented by
a directed graphG= (V,E,C), beingV,EandCthe set of nodes, links and controllers respectively,
whereC⊂V. We useci,jto denote the capacity of a link(i,j)∈ E. The set of interconnection devices
is defined asS={n|n∈V∧n∈/C}.
ConsideringFas the entire set of traffic flows existing in the network between any pair of nodes,
we useDto denote the subset of data plane communications. For the control plane, letTdenote the
subset of communications between network controllers and switches, whileHis used as the subset of
communications between controllers. Accordingly,F=D∪T∪H. Each flow f ∈Ffrom sourcesf to
destinationtf, has its associated throughput, denoted bybf.
To minimize the number of links needed to route a given traffic demand matrix, we develop an ILP model, according to the following binary variables:
xi,j: describes the state of a link(i,j)∈E.
xi,j=
(
1 if(i,j)is active,
0 otherwise.
tif,j: describes the selection of a link(i,j)∈Eto route a flow f ∈F.
tif,j= (
1 if(i,j)is selected to routef,
0 otherwise.
λn,c: describes the association of each forwarding devicen∈Swith a controllerc∈C.
λn,c=
(
1 ifnis associated withc,
0 otherwise.
Considering the complete set of demands fixed and known in advance, a global optimization process can jointly compute all the required optimal control and data paths minimizing the energy efficiency. Using the aforementioned binary variables, the optimization model can be formulated as:
minimize
∑
(i,j)∈E
xi,j (1)
To manage each forwarding device in the networkn∈S, a single controller is selected.
∑
c∈C
λn,c=1 ∀n∈S (2)
Additionally, the number of switches associated with each controller cannot exceed the controller
capacity. In this expression, we useRcto denote the computational and networking resources, in terms
of number of devices that can be supported for a controllerc∈C.
∑
n∈S
λn,c≤Rc ∀c∈C (3)
To avoid additional traffic load through network controllers, data plane communications
(i.e., f ∈ D) cannot be routed through these devices. Furthermore, control traffic between controllers
and switches (i.e., f ∈ T) will not pass through any other controller (i.e., except for those being the
(i.e., f ∈ H). In these constraints, we useN(i)to denote the set of neighbors of a nodeiandnf to
identify the forwarding device involved in the source/target pair of traffic flowf ∈T.
∑
j∈N(i) tif,j≤ 0 λnf,i 0 ∀f ∈D,∀i∈C ∀f ∈T,∀i∈C ∀f ∈ H,∀i∈C\ {sf,tf} (4)The routing of data plane communications and control traffic exchange between controllers follows the traditional flow conservation constraints.
∀i∈V,∀f ∈D∪H:
∑
j∈N(i) tif,j−∑
j∈N(i) tjf,i= 1 −1 0 ifi=sf ifi=tf otherwise (5)Meanwhile, for the subset of communications between controllers and switchesf ∈T, these constraints
are modified to assure that every switch exchanges control messages only with its controller. Similarly,
the forwarding device and controller involved in the source/target pair of traffic flowf ∈T, are denoted
withnf andcf, respectively.
∀i∈V,∀f ∈T:
∑
j∈N(i) tif,j−∑
j∈N(i) tjf,i= λnf,cf −λnf,cf 0 ifi=sf ifi=tf otherwise (6)A link(i,j)is active if it is used by some traffic flow f ∈F. Furthermore, the total traffic in each
active link must be less than its assigned capacity.
∑
f∈F
tif,jbf ≤ci,jxi,j ∀(i,j)∈E (7)
Using this model, the centralized controller can determine all the optimal routes and set the corresponding flow rules on each interconnection device in the network before the traffic arrival. Although this formulation allows the attainment of optimal solutions for the energy consumption problem in SDN, it becomes highly challenging to solve on large or even medium-scale topologies.
This is because the complexity of the energy-aware routing problem is NP-hard [35], so the required
computational time and resources grow exponentially with the network size.
4. Energy-Aware Approach
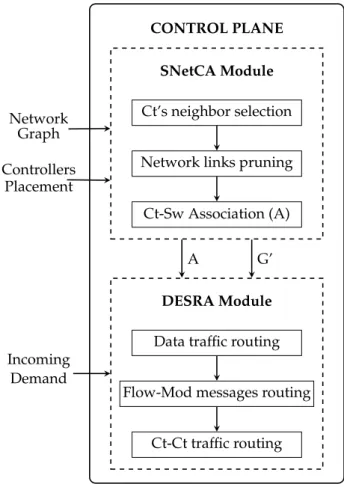
Given the high complexity of the proposed optimization problem in large real-world networks, in this section, we present a hybrid solution for the energy efficiency problem in SDN comprising the main advantages of the two aforementioned solution types. More precisely, we exploit specific network topological properties combined with the use of traffic engineering to reduce the overall power consumption.
An illustrative diagram of this strategy is shown in Figure1. The first component, denoted
as Static Network Configuration Algorithm (SNetCA), is a topology-based solution intended to be statically activated at specific instances as a planned operation. On the other hand, the traffic-based module, denoted as Dynamic Energy Saving Routing Algorithm (DESRA), is activated by the arrival of each incoming traffic demand. Therefore, an accurate prediction of incoming traffic is not needed.
In essence, this approach finds the routes between network elements that minimize the number of active links used, being the links shared between data and control plane traffic (i.e., in-band mode). Therefore, control paths between controllers and switches (in both senses) and between controllers are also established.
Additionally, given the controllers placement in the network topology, an ideal distribution of switches between controllers is determined by our model. This is done in terms of energy efficiency, while considering as well the controllers capacity to support forwarding devices. Moreover, our energy-aware approach avoids the routing of additional traffic load through controllers. Therefore, admissible control paths do not traverse any other controller, but the source or target of the traffic and data plane communications cannot be routed through any of these devices.
The two main parts enclosed within the proposed energy-aware approach are described in more details in the following subsections.
CONTROL PLANE SNetCA Module
Ct’s neighbor selection
Network links pruning
Ct-Sw Association (A) Network Graph Controllers Placement DESRA Module
Data traffic routing
Flow-Mod messages routing
Ct-Ct traffic routing Incoming
Demand
A G’
Figure 1. Illustrative diagram of the proposed approach. SNetCA, Static Network Configuration Algorithm; DESRA, Dynamic Energy Saving Routing Algorithm.
4.1. Static Network Configuration Algorithm
By considering the typical link redundancy of backbone networks, we design a Static Network Configuration Algorithm, denoted as SNetCA, which aims to prune as many links as possible in order to stress the importance of energy saving. Additionally, the most favorable switch-controller associations in terms of energy efficiency and load balance are determined in this stage.
The algorithm, described in the Algorithm1pseudo-code, is composed of three steps:
1. selecting one of the controller’s neighbors, as the node that will remain connected to it in the
outcome topology;
3. associating each node with one controller and computing the control path between them.
Algorithm 1SNETCA
Require: G= (V,E,C) Ensure: G0= (V,E0,C),A,Psc
1: Nc←Set of neighbors of controllerc∈C
2: Sel_N←NULL .Array of selected switch for each controller
3: G0←G 4: forc∈Cdo
5: B←NULL .Array of betweenness values
6: SPc←Set of shortest paths from controllerc∈C
7: forn∈ Ncdo 8: ifn∈Cthen 9: continue 10: end if 11: Bn=0 12: forp∈SPcdo 13: ifn∈ pthen 14: Bn =Bn+1 15: end if 16: end for 17: end for
18: L←Nc_Sortedaccording to decreasing order ofB 19: fors∈Ldo
20: ifcnot already inSel_Nthen
21: Sel_N=Sel_N∪(s,c) 22: end if
23: Remove links(s,c)and(c,s)fromG0
24: end for 25: end for 26: fori,j∈E0do 27: ifi∈Corj∈Cthen 28: continue 29: end if 30: G00←G0
31: Remove controllersc∈CfromG00
32: Remove linki,jfromG00
33: ifG00remains strongly connectedthen
34: Remove linki,jfromG0
35: end if
36: end for
37: fors,c∈Sel_Ndo
38: ifsis already associated with anotherc06=cthen
39: continue
40: end if
41: PATHSELECTOR(s,c)
42: UpdatePsc,A,X,U
43: end for
44: forthe rest ofs∈Sdo
45: PATHSELECTOR(s,C)
46: UpdatePsc,A,X,U
The input of Algorithm1is the network topology with controllers’ placement, and its outputs are
a pruned network with a reduced number of links, denoted asG0, an array keeping the controller-switch
associations, denoted as A, and the control paths from each node to its controller, denoted asPsc.
Additionally, we use X to denote the set of active links X ⊆ Eand Uto store the utilization of
network links.
In the first step, the algorithm iterates over the set of network controllers in order to evaluate each one of its neighbors. The selection of one neighbor node for each controller is based on the
betweenness centrality (Bn), which measures the intermediary role of a node in the network. In the
proposed approach, we use a simplified version of this metric considering only the shortest paths from a controller to every switch.
In particular, after computing the shortest paths from one controller as the single source,
the algorithm determines whether a neighbor node belongs to each path and increases theBnassociated
with that node (Lines7–17). For each controller, a list of neighbor devices, sorted in decreasing order
ofBn, is stored inL. This list is used to identify the neighbor with the highest betweenness centrality.
This will be the node that will remain connected to the controller in the resulting pruned topology.
Thus, the controller considered in the current iteration and the selected neighbor, are stored inSel_N.
For the remaining nodes inL, the links between them and the controller are removed from the
resulting network graph. This means that they are put into sleep mode in the original graph. Notice that when a controller’s neighbor is another controller, the link between them is not considered as
a candidate to be pruned (Lines8–10).
In the next step, the algorithm iterates over the set of directional links in the pruned network that do not have any controller as its extreme nodes. At each iteration, the algorithm attempts to increase the number of switched-off edges.
A new link is removed only when the resulting graph remains being strongly connected, i.e., at least one path exists between every pair of nodes in the network. To accomplish this, a temporal graph
without any controller, denoted asG00, is created. This graph is used to check the required connectivity
between all the forwarding devices. After validating that the possibility to reach any node in the network is not affected, the considered link is removed from the resulting graph.
The last step of the algorithm is intended to determine a control path from each forwarding device to one controller. To achieve this goal, the algorithm starts evaluating the pairs of controller-switch
already stored inSel_N(Line37). For each pair, the algorithm first determines whether the considered
switch is still available. If this is the case, an admissible control path minimizing the number of
active links is computed using the method PATHSELECTORdescribed in Algorithm2, which will be
further explained below. As stated previously, admissible control paths do not pass through any other controller that does not act as the source or target of the considered traffic. The remaining forwarding devices are then considered. Notice that in this case, the algorithm takes into account the control paths
to all controllers in the network. Precisely, the path computed by the PATHSELECTORin this step
defines the controller for the rest of forwarding devices.
Using this initial control plane configuration, switches send to the controller packet_in requests when a new traffic flow arrives, as well as statistics and failure notifications. Consequently, there is an initial set of active links in the network before the ingress of traffic flows, as well as some link utilization.
The PATHSELECTORmethod, described in Algorithm2, performs the energy-aware path selection.
In essence, this function is used to select the best admissible route between a pair of nodes, aiming to minimize the total number of active links in the network. The key idea of this function is to perform a low-complexity greedy evaluation between all the admissible paths to select the most suitable route in terms of energy-efficiency, while guaranteeing a balanced load of switches between controllers and capacity constraint of links. Since this method works over the pruned network with a reduced number
of links (i.e.,G0), the set of admissible paths considered is significantly smaller than in the original
topology, and the solution can be found after fewer iterations. When this function is asked to find the path between each forwarding device and one controller (i.e., using the set of controllers as the traffic
destination), the controller load is considered (Line4–8). In addition, a candidate path is selected as long as it has sufficient link capacity to route the required traffic volume.
Algorithm 2PATHSELECTOR(a,b)
1: L←∞ 2: SeP←None
3: forp∈Get_All_Admissible_Paths(G0,a,b)do
4: ifb=Cthen
5: ifpis to an already loaded controllerthen
6: continue
7: end if
8: end if
9: off ←number of links inpthat are not inX
10: ifoff <Landphas sufficient bandwidththen
11: L←off
12: SeP←p
13: end if
14: end for
4.2. Dynamic Energy Saving Routing Algorithm
When a new traffic demand arrives, a routing request is sent from the input node to its associated controller using the path between both devices previously computed during the static network configuration phase. Based on its global knowledge of the network topology, this controller calculates the required data path minimizing the number of links that need to be activated for this connection request and creates the flow forwarding rules.
The proposed dynamic energy-aware routing is shown in Algorithm3. For an incoming demand
dfrom sourcesdto destinationtd, the algorithm starts storing inCt1the controller associated with the
source node. This controller is the main responsible of managing this traffic request.
Using the PATHSELECTORmethod, the most favorable admissible data path in terms of energy
consumption is computed. This is done considering that admissible paths do not go through any controller in the network. Then, a loop is used to establish the required control plane communications for each node along this path.
Algorithm 3DESRA
Require: G0,A,dincoming traffic request
Ensure: Pss,Pcs,Pccdata and control paths,Xactive links,Ulinks utilization 1: Ct1←A[sd] 2: p=PATHSELECTOR(sd,td) 3: UpdatePss,X,U 4: forn∈ pdo 5: Ct←A[n] 6: PATHSELECTOR(Ct,n) 7: UpdatePcs,X,U 8: ifCt16=Ctthen 9: PATHSELECTOR(Ct1,Ct) 10: UpdatePcc,X,U 11: end if 12: end for
After identifying the controller associated with each node in the data path, a control path is computed between them. These paths are used to set the flow forwarding rules in each switch using the flow_mod messages. Given the multi-domain scenario considered, the nodes traversed by the
data traffic may be associated with different controllers. When a node is not associated withCt1,
an additional control message is sent from this controller to the other, in order to inform the second controller of the flow forwarding rule that needs to be installed in one of its managed nodes.
4.3. Complexity Analysis
Considering that the computation of the shortest paths from each single controller is done in
O(NlogN)using the Dijkstra algorithm, the selection of one controller’s neighbor in the fist step of
Algorithm1has a worst run-time complexity equal toO(NlogN+N2+SlogS+S), whereNis the
number of total network nodes andSis the number of forwarding devices. Given that this operation
is performedCtimes, beingCthe number of controllers, the complexity of Step 1 becomesO(N2C).
Pruning as many links as possible without disconnecting the network graph during the second step
has a complexity equal toO(E(N+E)), whereEis the number of links andO(N+E)refers to the
connectivity checking process [36]. The complexity of last step is determined byO(SM), whereM
indicates the worst-case complexity of Algorithm2. It should be noticed that after pruning the network
topology, the number of admissible paths and the consequent computation complexity of this method are significantly reduced with respect to the original graph. Therefore, the SNetCA complexity can be
expressed asO(N2C).
The overall complexity of the proposed dynamic routing solution, mixing together both
Algorithms2and3, isO(SM2)since the maximum length of a data path is precisely the number of
forwarding devices given the routing restriction avoiding data traffic through network controllers.
Given that M is usually a small number after pruning the network topology and will not grow
rapidly along with the network topology size, running the algorithm upon each flow request is a reasonable approach.
5. Simulations and Results
In this section, we describe the evaluation of our energy-aware approach and analyze the achieved
results. We used the linear programming solver Gurobi Optimizer [37] for the ILP model. Meanwhile,
the proposed control framework described in Section4was implemented using the programming
language Python to develop the heuristic algorithms. A computer with 3.30 GHz Intel Core i7 and 16GB RAM was used to carried out all computations. To conduct our simulations, we use real-world
network topologies and traffic demands collected from SNDlib [38]. Each router in the network was
considered as an SDN node or as a tentative controller location. Since the topologies used in our experiments are backbone networks, for the sake of simplicity and without loss of generality, we opted to compute the communications delay as the propagation latency.
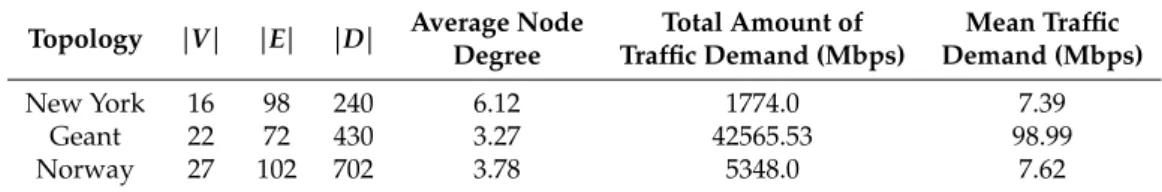
Specifically, we use three of the most link-redundant network topologies in SNDlib in order to assess the effectiveness of the proposed scheme. The mentioned topologies are New York, Geant and
Norway, and their main characteristics are summarized in Table2.
Table 2.Main characteristics of considered topologies.
Topology |V| |E| |D| Average Node Total Amount of Mean Traffic Degree Traffic Demand (Mbps) Demand (Mbps)
New York 16 98 240 6.12 1774.0 7.39
Geant 22 72 430 3.27 42565.53 98.99
Norway 27 102 702 3.78 5348.0 7.62
Table2presents, apart from the topological properties, a general description of the provided
matrices provided, while for Geant, we select the subset of available traffic matrices measured at 00:00 on 5 May 2005.
As we are considering an in-band scenario, after placing the controllers in each simulation instance, we have deleted the data traffic demands from/to them. The network load being an important parameter that impacts the efficiency of any energy-aware solution, we also compute the average
network loadρ, defined as follows:
ρ= ∑ (i,j)∈Ef∑∈D tif,jbf ∑ (i,j)∈E xi,jci,j (8)
Where the traffic flowing on each link was obtained routing each traffic demand using the shortest path. Results from this early analysis confirm that the real scenarios considered present a low network traffic load. More in detail, the average network loads of the three network topologies are less
than 0.05, New York links being particularly lightly loaded (i.e.,ρ <0.01). This behavior is typical
in real backbone topologies where capacity planning strategies aim to always ensure a significant over-provisioning in core links relative to the offered average load. This is done as an attempt to avoid the congestion in case of peak load and to allow the fulfillment of Service Level Agreement (SLA) requirements. Intuitively, low loaded networks are suitable scenarios for deploying energy-aware solutions that concentrate traffic and turn off unused network links. Therefore, this analysis suggests that substantial energy savings are possible. Moreover, we can deduce that potential energy benefits will be more limited by the required connectivity and topological properties than by the network traffic load.
An average rate of 1.7 Mbps was assumed for the control traffic [39]. Considering a homogeneous
scenario, where all controllers have the same computational and networking capabilities, in our simulations, we set the maximum number of forwarding devices that can be associated with each controller as follows: Rc= |S| |C| ∀c∈C (9)
In this way, switches are evenly distributed, and the load of switches is balanced among controllers.
To analyze the performance of our energy-aware approach, five groups of evaluations are
presented varying the number of controllers in the considered topologies. In the first part,
the performance of our heuristic algorithms with respect to the optimal model is analyzed in order to fix an upper bound for the energy saving capabilities of proposed solutions. In the second part, the potential of SNetCA to prune a network topology is investigated. Then, we compare our solution with the four strategies of another energy-aware method proposed in the literature. Next, we analyze the impact of our model on crucial network performance metrics, such as latency, link utilization and TCAM occupation. Finally, we provide an initial analysis exploring the existing trade-off between energy savings and network resilience.
5.1. Optimal vs. Heuristic Solutions
To assess the performance of proposed heuristic algorithms against the optimal solution achieved
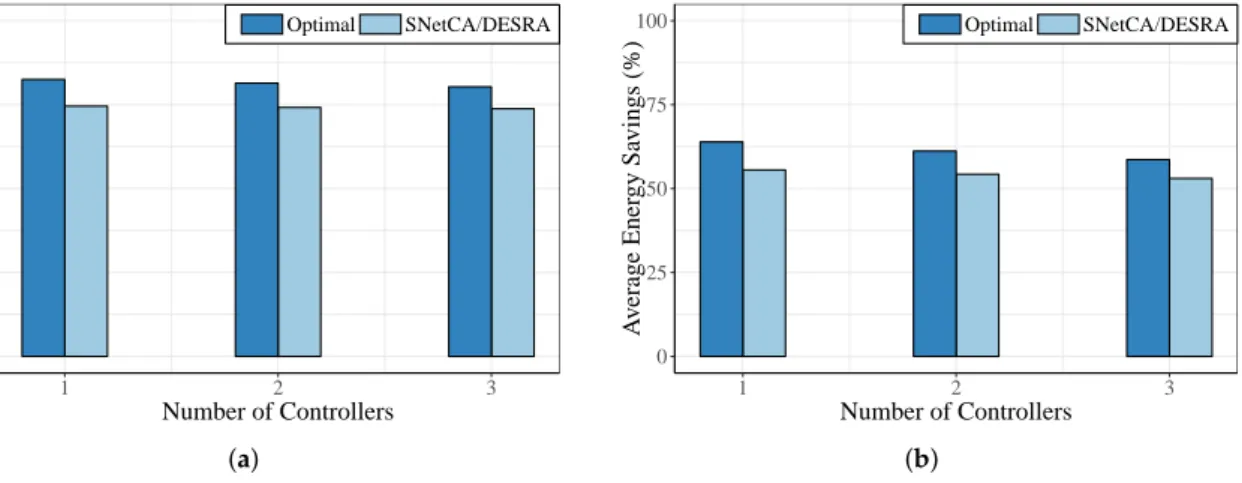
by the ILP model, we show their behaviors in Figure2using the New York and Geant topologies.
In both networks, we consider all admissible controller placements and compute the average energy savings for different numbers of controllers. Notice that a controller placement is admissible when the assumptions established in this proposal to avoid the routing of additional traffic load through network controllers can be kept (i.e., the network graph without any controller is strongly connected). We compute energy savings as the proportion of links in sleep mode with respect to the total amount of network links.
As shown in Figure2, the energy savings reached by the optimization model are up to 64% and 83% in Geant and New York topologies, respectively. On the other hand, the heuristic strategy (denoted in the figure as SNetCA/DESRA) allows attaining close-to-optimal energy savings, with a maximum gap of 9%.
We can also see that while the number of controllers grows energy savings decrease. This is due to the fact that in our approach data plane communications are not routed through network controllers. Therefore, as the number of network controllers is increased, a higher number of links (i.e., links directly connected to the controllers) is likely to be used to route control traffic, but not for data plane communications. A similar decreasing behavior can be noticed in the gap between optimal and heuristic results since, as the amount of network controllers grows, a lesser number of feasible possibilities can be considered by the linear solver.
0 25 50 75 100 1 2 3 Number of Controllers A v erage Ener gy Sa vings (%) Optimal SNetCA/DESRA (a) 0 25 50 75 100 1 2 3 Number of Controllers A v erage Ener gy Sa vings (%) Optimal SNetCA/DESRA (b)
Figure 2.Average energy savings comparison between optimal and heuristic solutions for different numbers of controllers in: (a) New York topology and (b) Geant topology.
Table3shows the average execution times of the optimal model and heuristic algorithms in the
three network topologies considered in our experimental simulations. While the SNetCA column shows the execution times required to prune the network, the two others contains how many seconds are spent by each routing approach to compute all the required control and data paths according to the incoming traffic. As is shown, in both approaches, computation times mostly tend to decrease as the number of controllers grows. The reason for this is that in these energy-aware approaches, the routing of additional traffic load through network controllers is avoided. Therefore, an increase of network controllers implies that fewer alternate paths between each pair of nodes are considered in the simulation.
Table 3.Average execution time (s) using different numbers of controllers on real topologies.
Topology |C| Optimal SNetCA DESRA
New York 1 172.76669 0.06118748 0.7708125 2 191.75141 0.05415126 0.6329832 3 78.89208 0.04126375 0.5140916 Geant 1 114.88002 0.05245455 2.4348636 2 91.40695 0.05004147 1.9789217 3 49.54307 0.04750903 1.5744784 Norway 1 9946.57420 0.10151852 8.9833704 2 5227.32024 0.09847852 7.2682321
Although in all cases, the proposed strategy outperforms the optimal model in terms of computation time, a higher improvement is achieved as the network size grows. For instance, in the Norway topology, the processing times required by the optimal model increase dramatically. The ILP model in this topology can take more than two hours on average to find a solution, which is a great limitation in current networking environments. Meanwhile, it is always less than 10 s for the heuristic strategy, i.e., almost a three order of magnitude improvement. This comparison validates the improvements achieved by the heuristic proposal in terms of computation time and clearly justifies its necessity.
For the Norway topology, only the case of having one and two controllers is shown. The required convergence time for solving the exact model beyond this limit became unfeasible, since the number of possible combinations of nodes as controllers’ placement grows exponentially.
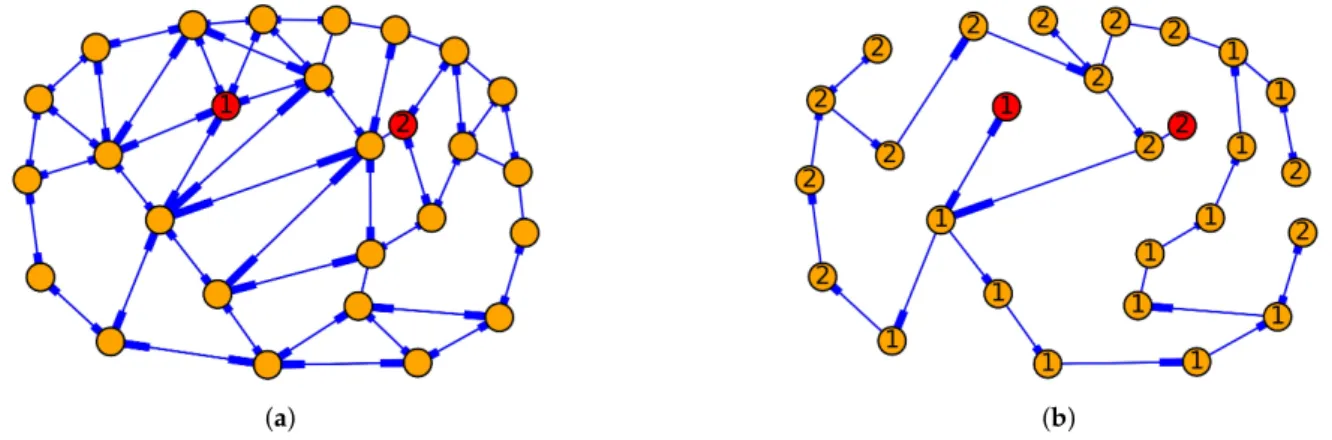
5.2. SNetCA Performance
In order to evaluate the effectiveness of the proposed topology-based module, Figure3shows an
example of the performance of SNetCA on the Norway topology, considering two network controllers placed at nodes denoted as 1 and 2 and emphasized with a different color in the figure. The distribution of switches between controllers is depicted through the use of labels in each node, indicating the controller number to which the node is associated. Here, we focus our attention on the Norway topology, but similar results have been obtained for the two remaining topologies considered.
(a) (b)
Figure 3.(a) Original Norway graph. (b) Resulting Norway graph after applying SNetCA.
A comparison between the original network and the resulting graph illustrated in Figure3a,b
respectively, shows a difference of 67 edges, which represents more than 65% of total network links. These links are pruned by our algorithm guaranteeing that the resulting graph remains strongly connected and avoiding additional traffic load through network controllers.
Additionally, as a result of applying SNetCA on the Norway topology, switches are distributed between controllers minimizing the number of required active links and ensuring a balanced controllers load. For instance, 12 switches are associated with Controller 1, while the remaining 13 are managed by Controller 2.
To provide a more general perspective, Figure4shows, for the three considered topologies,
the average number of links pruned by SNetCA, which contribute directly to the energy efficiency achieved by this proposal. In this analysis, we also consider all the admissible placements of one to three controllers.
As is shown, an important number of links is pruned in all the topologies considered, but the highest energy savings are achieved in the New York topology. The reason for this is that New York has much more link redundancy than Geant and Norway. Therefore, a higher number of links can be
pruned while guaranteeing the network connectivity. In general, the more redundant the network, the higher number of links are put into sleep mode applying this strategy.
0 25 50 75 100 1 2 3 Number of Controllers A v
erage Number of Pruned Links (%)
New York Norway Geant
Figure 4.Average number of pruned links in the three topologies varying the number of controllers.
5.3. Assessment of Energy Saving Potential
SGH [25] is an energy-aware routing solution based on knowledge of the incoming traffic requests.
This proposal selects, using a pre-calculated set of shortest paths, the most suitable path in terms of energy savings to allocate each traffic demand, as long as it has enough capacity. To do so, traffic demands are ordered according to the following four different strategies:
• Node pairs with the shortest Shortest Path First (SPF)
• Node pairs with Longest shortest Paths First (LPF)
• Node pairs with Smallest Demand First (SDF)
• Node pairs with Highest Demand First (HDF).
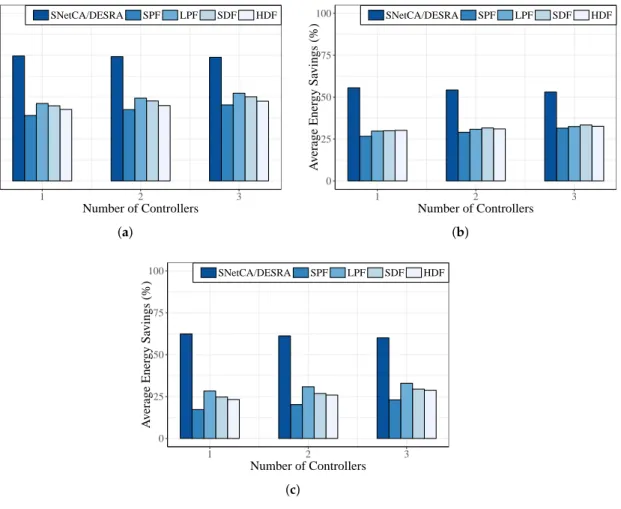
Figure5shows the average performance in terms of energy savings of the two-module based
strategy SNetCA/DESRA with respect to the four different versions of SGH in the three real topologies analyzed for different amounts of controllers.
As we are considering an in-band SDN with multiple controllers, the traffic matrix provided to SGH includes, together with the data demands, a control traffic flow for each pair of associated controller-switch and for each pair of controllers in the network. In this way, required control plane communications are also established by SGH. This is done taking into account the distribution of switches between controllers obtained from SNetCA. Additionally, the routing restrictions established in this proposal to avoid additional traffic load through network controllers are considered in the computation of the pre-calculated shortest paths. On the other hand, given that DESRA is an online routing strategy, the connection requests are sequentially allocated as they appear in the considered traffic matrix.
In Figure5a–c, we can see that SNetCA/DESRA performs better than the remaining algorithms.
While similar results are obtained by the four different versions of SGH, the proposed strategy achieves notable improvements in the three considered topologies. For instance, differences up to 35%, 29% and 45% of energy savings are reached in the New York, Geant and Norway topologies, respectively. Such significant differences are mostly due to the operation of SNetCA before the traffic arrival, which is able to prune a great number of links without affecting the network capabilities to manage the incoming requests. Additionally, the routing decisions performed by SGH are limited to a predefined number of pre-computed shortest paths and fail to extensively exploit the energy saving potential of each topology. Therefore, even without a prior arrangement of demands based on accurate knowledge
about the incoming traffic, the proposed scheme in this paper puts to sleep mode a higher percentage of links, being able to save substantially more energy.
0 25 50 75 100 1 2 3 Number of Controllers A v erage Ener gy Sa vings (%) SNetCA/DESRA SPF LPF SDF HDF (a) 0 25 50 75 100 1 2 3 Number of Controllers A v erage Ener gy Sa vings (%) SNetCA/DESRA SPF LPF SDF HDF (b) 0 25 50 75 100 1 2 3 Number of Controllers A v erage Ener gy Sa vings (%) SNetCA/DESRA SPF LPF SDF HDF (c)
Figure 5.Average energy savings comparison between proposed strategy and SGH solutions for different numbers of controllers in the: (a) New York topology; (b) Geant topology; and (c) Norway topology. 5.4. Impact on Network Performance
It is to be emphasized that in our energy-aware approach, Quality of Service (QoS) constraints and performance metric boundaries are not considered. This is not a limitation, but a choice; since we intend to measure the impact of our proposal on the network performance metrics as a trade-off with the energy saving improvements. In fact, we are presenting an effective and easy to implement green routing mechanism that emphasizes the importance of energy efficiency in the operation of current data networks.
In order to assess the impact of our energy-aware approach on the network performance, we adapt two well-known state-of-the-art routing algorithms: Shortest Path Routing (SPR) and Load Balancing (LB) for their use in the considered in-band SDN environment. Additionally, the rule space being a significant issue of concern in SDN, we include in this analysis an algorithm balancing the number of rules installed in each forwarding device, denoted here as TCAM Occupation Balancing (TOB).
In general, these algorithms are greedy heuristics that follow the procedure described in Algorithm4.
More precisely, these algorithms will evaluate every candidate admissible path and find the one prioritizing some performance metric such as: traffic latency, link utilization or TCAM occupation. According to the approach used, the selected path will be:
SPR The one minimizing the propagation latency
LB The one minimizing the maximum link utilization
TOB The one minimizing the maximum TCAM occupation
It is clear that, in each of these metrics, the corresponding baseline algorithm will have better performance than our energy-aware approach. However, the purpose of this evaluation is to use these algorithms as a reference point to illustrate the energy-aware solution impact on network performance. All of them follow the assumptions established in this proposal to avoid the routing of additional traffic load through network controllers. Similarly, SNetCA is still used to determine the distribution of switches between controllers. Although we may focus our attention on some specific network for the different performance metrics, the derived conclusions are general and independent of the specific considered topology. Thus, they hold whichever network is examined.
Algorithm 4GREEDY_BASELINES
Require: G,A,D 1: ford∈Ddo
2: pd=Find_Best_Data_Path
3: Update network metrics
4: fors∈ pddo
5: ifno control path is already established betweensand its controller inAthen
6: pc=Find_Best_Control_Path
7: Update network metrics
8: end if
9: end for
10: end for
5.4.1. Traffic Latency
In the first set of simulations, we analyze how the data and control paths latency is affected by routing decisions made.
To evaluate the impact of our algorithm on control path delay, we collect, for each traffic demand, the length of its associated control paths and the corresponding shortest paths. The notation Maximum Over-length is used to denote the maximum number of additional hops (with respect to the length of the corresponding shortest path) among the routing solutions for the required control paths. For instance, when this value is equal to zero, it means that every control traffic is routed using exactly the shortest path.
Figures6–8show this behavior for the three studied topologies considering all possible placements
for different amounts of controllers.
As is shown, in all cases when the number of controllers grows, the control traffic is routed using a larger number of hops for a higher fraction of demands. Norway being the largest one in terms of network size (number of nodes and links), control paths in this topology are increased by a higher number of hops.
0 25 50 75 100 4 5 6 7 8 9 10
Maximum Over−length (Hops)
Fraction of demands (%) (a) 0 25 50 75 100 4 5 6 7 8 9 10
Maximum Over−length (Hops)
Fraction of demands (%) (b) 0 25 50 75 100 4 5 6 7 8 9 10
Maximum Over−length (Hops)
Fraction of demands (%)
(c)
Figure 6.Distribution of maximum control traffic over-length in the New York topology for: (a) 1 controller, (b) 2 controllers and (c) 3 controllers.
0 25 50 75 100 3 4 5 6 7 8 9 10 11 12 13 14
Maximum Over−length (Hops)
Fraction of demands (%) (a) 0 25 50 75 100 3 4 5 6 7 8 9 10 11 12 13 14
Maximum Over−length (Hops)
Fraction of demands (%) (b) 0 25 50 75 100 3 4 5 6 7 8 9 10 11 12 13 14
Maximum Over−length (Hops)
Fraction of demands (%)
(c)
Figure 7.Distribution of maximum control traffic over-length in the Geant topology for: (a) 1 controller, (b) 2 controllers and (c) 3 controllers.
0 25 50 75 100 11 12 13 14 15 16 17 18
Maximum Over−length (Hops)
Fraction of demands (%) (a) 0 25 50 75 100 11 12 13 14 15 16 17 18
Maximum Over−length (Hops)
Fraction of demands (%) (b) 0 25 50 75 100 11 12 13 14 15 16 17 18
Maximum Over−length (Hops)
Fraction of demands (%)
(c)
Figure 8.Distribution of maximum control traffic over-length in the Norway topology for: (a) 1 controller, (b) 2 controllers and (c) 3 controllers.
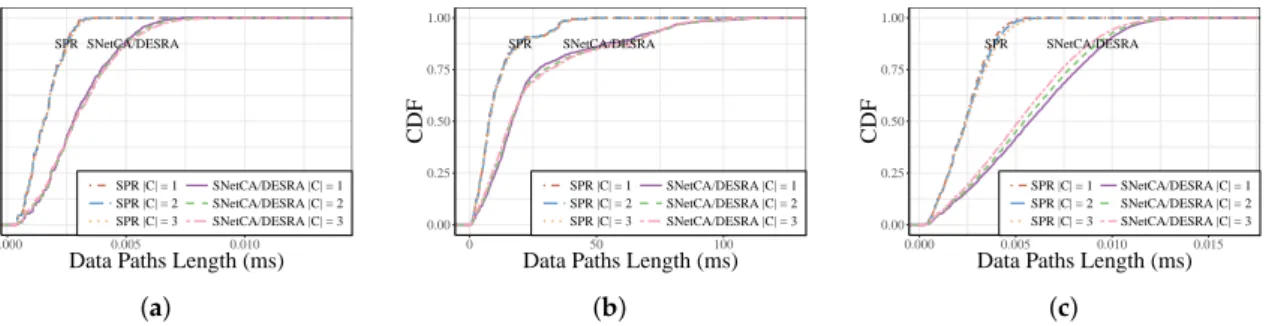
To take a closer look at the data plane, we draw in Figure9the Cumulative Distribution Function
(CDF) of data paths’ latency for the three topologies considering all possible locations of one to three controllers.
SPR SNetCA/DESRA 0.00 0.25 0.50 0.75 1.00 0.000 0.005 0.010
Data Paths Length (ms)
CDF SPR |C| = 1 SPR |C| = 2 SPR |C| = 3 SNetCA/DESRA |C| = 1 SNetCA/DESRA |C| = 2 SNetCA/DESRA |C| = 3 (a) SPR SNetCA/DESRA 0.00 0.25 0.50 0.75 1.00 0 50 100
Data Paths Length (ms)
CDF SPR |C| = 1 SPR |C| = 2 SPR |C| = 3 SNetCA/DESRA |C| = 1 SNetCA/DESRA |C| = 2 SNetCA/DESRA |C| = 3 (b) SPR SNetCA/DESRA 0.00 0.25 0.50 0.75 1.00 0.000 0.005 0.010 0.015
Data Paths Length (ms)
CDF SPR |C| = 1 SPR |C| = 2 SPR |C| = 3 SNetCA/DESRA |C| = 1 SNetCA/DESRA |C| = 2 SNetCA/DESRA |C| = 3 (c)
Figure 9.Cumulative distribution function of data paths latency varying the amount of controllers in the: (a) New York topology; (b) Geant topology; and (c) Norway topology.
As shown in Figure9a–c, the CDFs of data paths’ latencies for different amounts of controllers
are quite similar. However, we can see that under the energy-aware routing, data path delay is affected since larger data paths are used in order to minimize the number of active links. For instance,
in Figure9b, only 87% of data paths exhibit delays lower than 50 ms, meanwhile all control paths
in the SPR case are under this value. This performance degradation is less critical in the two other topologies, which are deployed in smaller geographic areas compared to Geant. In general, the larger the network (in terms of geographic length), the more increase in latency is incurred.
Despite the presented latency degradations with respect to SPR, the solution performances
observed in Figure9a,c are suitable for supporting latency critical services in 5G networks demanding
end-to-end delays lower than 10 ms [40], such as robotics and telepresence, virtual reality, health
care, among others. Likewise, less demanding applications and use case scenarios to be addressed in 5G networks, such as intelligent transport systems and smart grid, with latency requirements up to
100 ms [40], could be conceived of and deployed in Geant-like environments.
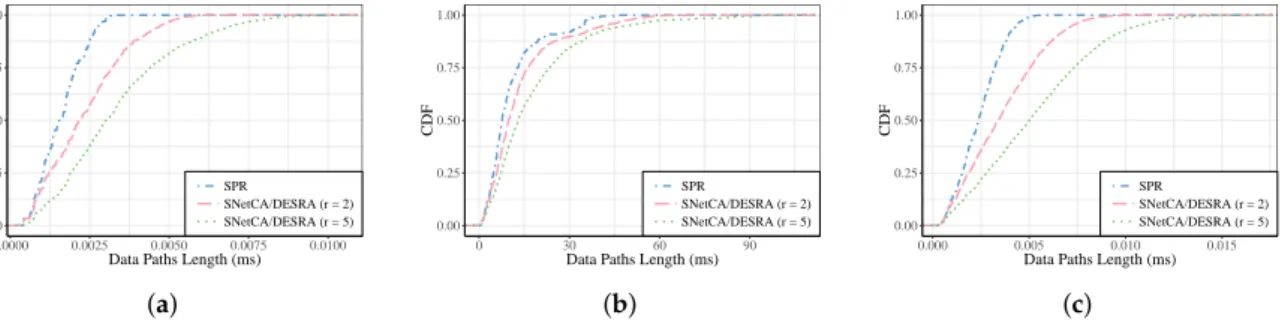
These latency degradations confirm that, according to traffic requirements, specific performance bounds may be required. In order to ensure the suitability of the proposed algorithm for delay-critical services, we include in this analysis the evaluation of a delay-constrained version. To do so, we now restrict the number of links that can be initially pruned by SNetCA. Specifically, network links belonging to the shortest path between any pair of nodes are not removed during the static network configuration phase. In this way, the shortest path will always be available if it is needed for allocating the incoming traffic with DESRA. In both modules, the path latency is now taken into account for the PATHSELECTORmechanism in order to satisfy given delay bounds.
Figures10and11show the performance of the delay-constrained version considering data and
control paths latency bounded by the factorr. This latency threshold is used to denote the relation
among the delay requirement and the shortest path propagation latency for every established path.
For instance, whenr=2 every path latency will be, at most, twice that of the shortest path.
0 25 50 75 100 2 3 4 5 6 7
Maximum Over−length (Hops)
Fraction of demands (%) r = 2 r = 5 (a) 0 25 50 75 100 0 1 2 3 4 5 6 7 8
Maximum Over−length (Hops)
Fraction of demands (%) r = 2 r = 5 (b) 0 25 50 75 100 4 5 6 7 8 9 10 11 12 13 14
Maximum Over−length (Hops)
Fraction of demands (%)
r = 2 r = 5
(c)
Figure 10.Distribution of maximum control traffic over-length for one controller under delay constraint in the: (a) New York topology; (b) Geant topology; and (c) Norway topology.
0.00 0.25 0.50 0.75 1.00 0.0000 0.0025 0.0050 0.0075 0.0100
Data Paths Length (ms)
CDF SPR SNetCA/DESRA (r = 2) SNetCA/DESRA (r = 5) (a) 0.00 0.25 0.50 0.75 1.00 0 30 60 90
Data Paths Length (ms)
CDF SPR SNetCA/DESRA (r = 2) SNetCA/DESRA (r = 5) (b) 0.00 0.25 0.50 0.75 1.00 0.000 0.005 0.010 0.015
Data Paths Length (ms)
CDF
SPR SNetCA/DESRA (r = 2) SNetCA/DESRA (r = 5)
(c)
Figure 11. Cumulative distribution function of data paths latency for one controller under delay constraint in the: (a) New York topology; (b) Geant topology; and (c) Norway topology.
As is shown in Figure10under the delay-constrained approach, the control traffic can be routed
incurring smaller over-lengths with respect to the performance-agnostic approach. Similarly, Figure11
shows that the data paths latency are less compromised when more restrictive possibilities in terms
of latency (r= 2 and 5) are considered. In general, the more restrictive is the latency bound used,
the better the performance in terms of delay can be achieved.
On the other hand, considering a latency restriction during paths’ selection will negatively impact the potential improvements in terms of energy efficiency. To validate this affirmation, the energy
savings achieved by the delay-constrained version usingr= 2 are shown in Table4. In this table,
optimal and heuristic values are depicted as well as the energy saving differences between the
performance-agnostic results shown in Figure2and the delay-constrained version.
Table 4.Energy savings with paths’ delay constrained tor=2.
Topology |C| Optimal Delay-Constrained Heuristic Difference
New York 1 58.16327 39.92347 34.63010 2 61.40456 41.11645 33.05608 3 62.37759 42.04418 31.74105 Geant 1 29.67172 17.67677 37.87879 2 33.81976 18.65719 35.61828 3 34.72549 19.85249 33.16422
Optimal values were obtained after adding to the ILP model presented in Section3the following
constraint, wheredi,j and Lf denote the link propagation delay and the traffic maximum latency
bound, respectively.
∑
(i,j)∈E
tif,jdi,j ≤Lf ∀f ∈F (10)
Significant reductions in terms of achieved energy saving values can be seen in Table4for the both
considered topologies as a consequence of restricting the path selection to meet the delay requirements. However, even considering such restricted thresholds, where no traffic can be routed using a path longer than twice the shortest path length (in terms of propagation delay), substantial energy savings can still be reached by the proposed heuristic strategy.
5.4.2. Links Utilization
The selection of routing paths minimizing the energy consumption has a direct influence on the traffic load of all the network links. To better showcase this situation, we use the New York and Geant
topologies and the LB algorithm. Figure12provides the CDF of link utilization under both algorithms
0.00 0.25 0.50 0.75 1.00 0 5 10 15 Link Utilization (%) CDF LB |C| = 1 LB |C| = 2 LB |C| = 3 SNetCA/DESRA |C| = 1 SNetCA/DESRA |C| = 2 SNetCA/DESRA |C| = 3 (a) 0.00 0.25 0.50 0.75 1.00 0 20 40 60 Link Utilization (%) CDF LB |C| = 1 LB |C| = 2 LB |C| = 3 SNetCA/DESRA |C| = 1 SNetCA/DESRA |C| = 2 SNetCA/DESRA |C| = 3 (b)
Figure 12.Cumulative distribution function of link utilization varying the amount of controllers in the: (a) New York topology; and (b) Geant topology.
As expected, the fairness of traffic distribution is altered by the energy-aware routing, since under this approach, traffic is concentrated in a fewer number of links. Therefore, there is a subset of active
links that is more overloaded than the others. For instance, in Figure12b, the link utilization of some
links in Geant is increased to more than twice the value achieved by the LB algorithm. Nevertheless, even in the more loaded cases, the link utilization in this topology is under 60%. A less concerning
situation can be observed in Figure12a since the given traffic load in the New York topology is
very low.
5.4.3. TCAM Occupation
Intuitively, energy-aware routing would affect the allocation of flow rules, a practical constraint in OpenFLow devices, given that traffic flows are redirected to minimize the number of active links.
In Figure13, we evaluate the impact of our approach on TCAM occupation with respect to the TOB
algorithm using the Geant and Norway topologies and all possible locations of two network controllers.
0 100 200 300 1 2 3 4 5 6 7 8 9 10 11 12 13 14 15 16 17 18 19 20 21 22 Node ID
Maximum Allocated Rules
SNetCA/DESRA TOB (a) 0 100 200 300 400 500 1 2 3 4 5 6 7 8 9 101112131415161718192021222324252627 Node ID
Maximum Allocated Rules
SNetCA/DESRA TOB
(b)
Figure 13.Average TCAM occupation with|C|=2 in the: (a) Geant topology; and (b) Norway topology.
As expected, the number of installed rules is raised by the energy-aware routing since new paths are more likely to be allocated over the most loaded devices instead of activating a new one. For instance, this increase is observed in all network devices in Norway topology and in 17 out of 22 nodes in Geant topology, in some cases being more than twice the value obtained by the TOB algorithm. However, an accurate explanation about these numbers is difficult since the energy-aware
proposal does not care at all about the use of rule capacity. Furthermore, the SNetCA/DESRA performance in both topologies is still physically acceptable considering that a routing table can
support around a few thousands of rules [23].
5.4.4. Energy Savings
Finally, to get a sense of the other side of the trade-off between energy efficiency and network
performance, Figure14shows the average energy performance of all the considered routing models in
the New York and Norway topologies for the case of one centralized controller in the network.
● ● ● ● ● ● ● ● 0 25 50 75 100 0 50 100 150 200 Number of Demands A v erage Ener gy Sa vings (%) ● SNetCA/DESRA SPR LB TOB (a) ● ● ● ● ● ● ● ● 0 25 50 75 100 0 200 400 600 Number of Demands A v erage Ener gy Sa vings (%) ● SNetCA/DESRA SPR LB TOB (b)
Figure 14.Average energy savings with|C|=1 in the: (a) New York topology; and (b) Norway topology.
As expected, in all cases, energy savings decrease while the number of demands grows. This is due to the fact that new paths need to be established to accommodated such traffic. The flat tendency of energy savings achieved by the power-aware solution despite the increase in allocated demands is possible given the low network load discussed at the beginning of this section. Moreover, the proposed strategy greatly outperforms SPR, LB and TOB in terms of energy saving. In general, SNetCA/DESRA is able to achieve significant energy savings, but bigger improvements with respect to the other approaches are reached when the traffic grows.
5.5. Resilience Concerns
While SNetCA allows important gains in terms of energy efficiency by pruning as many links as possible and leaving available only the minimum number of links needed to support the incoming traffic, the remaining subnetwork is more vulnerable to resource failures and sudden traffic bursts. To ensure an adequate network reliability while keeping low energy consumption, resilience constraints should be taken into account.
Given that the largest Laplacian eigenvalue of a graph is a widely-accepted metric to assess
network robustness with respect to link and node removals [41], we use it (referred to here asλmax)
to control the resulting resilience after applying SNetCA. Several papers about graph theory [42,43]
sustain that a network is more resilient the higher the largest eigenvalue of its Laplacian matrix. In general, these networks are more robust since they have small diameters, higher numbers of nodes and link disjoint paths and are likely to expand faster.
In order to provide an initial investigation exploring the existing trade-off between energy savings and network reliability, in this analysis, we evaluate a resilience-constrained version of
SNetCA, which enables us to limit the admissibleλmaxreduction rate due to the link removal process.
Additionally, to improve the redundancy for the control paths, the amount of neighbors that will remain connected to the controller is relaxed using different bounds (from one to the controller degree).