Price Dynamics
Plamen Ch. Ivanov1,2,3*, Ainslie Yuen4, Pandelis Perakakis1,5,6
1Center for Polymer Studies and Department of Physics, Boston University, Boston, Massachusetts, United States of America,2Harvard Medical School and Division of Sleep Medicine, Brigham and Women’s Hospital, Boston, Massachusetts, United States of America,3Institute of Solid State Physics, Bulgarian Academy of Sciences, Sofia, Bulgaria,4Signal Processing Laboratory, Department of Engineering, Cambridge University, Cambridge, United Kingdom,5Laboratory of Experimental Economics, University Jaume I, Castello´n, Spain,6Mind, Brain and Behaviour Research Centre (CIMCYC), University of Granada, Granada, Spain
Abstract
We analyse times between consecutive transactions for a diverse group of stocks registered on the NYSE and NASDAQ markets, and we relate the dynamical properties of the intertrade times with those of the corresponding price fluctuations. We report that market structure strongly impacts the scale-invariant temporal organisation in the transaction timing of stocks, which we have observed to have long-range power-law correlations. Specifically, we find that, compared to NYSE stocks, stocks registered on the NASDAQ exhibit significantly stronger correlations in their transaction timing on scales within a trading day. Further, we find that companies that transfer from the NASDAQ to the NYSE show a reduction in the correlation strength of transaction timing on scales within a trading day, indicating influences of market structure. We also report a persistent decrease in correlation strength of intertrade times with increasing average intertrade time and with corresponding decrease in companies’ market capitalization–a trend which is less pronounced for NASDAQ stocks. Surprisingly, we observe that stronger power-law correlations in intertrade times are coupled with stronger power-law correlations in absolute price returns and higher price volatility, suggesting a strong link between the dynamical properties of intertrade times and the corresponding price fluctuations over a broad range of time scales. Comparing the NYSE and NASDAQ markets, we demonstrate that the stronger correlations we find in intertrade times for NASDAQ stocks are associated with stronger correlations in absolute price returns and with higher volatility, suggesting that market structure may affect price behavior through information contained in transaction timing. These findings do not support the hypothesis of universal scaling behavior in stock dynamics that is independent of company characteristics and stock market structure. Further, our results have implications for utilising transaction timing patterns in price prediction and risk management optimization on different stock markets.
Citation:Ivanov PC, Yuen A, Perakakis P (2014) Impact of Stock Market Structure on Intertrade Time and Price Dynamics. PLoS ONE 9(4): e92885. doi:10.1371/ journal.pone.0092885
Editor:Matjazˇ Perc, University of Maribor, Slovenia
ReceivedDecember 3, 2013;AcceptedFebruary 27, 2014;PublishedApril 3, 2014
This is an open-access article, free of all copyright, and may be freely reproduced, distributed, transmitted, modified, built upon, or otherwise used by anyone for any lawful purpose. The work is made available under the Creative Commons CC0 public domain dedication.
Funding:Ainslie Yuen thanks the Department of Engineering, Cambridge University and King’s College, Cambridge for financial support. Pandelis Perakakis was supported by grants JCI-2010-06790 and ECO 2011-23634 offered by the Spanish Ministry of Science and Innovation, and grant P1-1B2012-27 by University Jaume I. The funders had no role in study design, data collection and analysis, decision to publish, or preparation of the manuscript.
Competing Interests:The authors have declared that no competing interests exist. * E-mail: [email protected]
Introduction
The impact of market structure and associated rules of operation on market efficiency and stock price formation have attracted considerable public attention [1]. Developments on the New York Stock Exchange (NYSE) [1,2], have raised the profile of the market operating mechanism, the ‘‘market structure’’, employed by a stock market. This has also been of concern to those involved in stock market regulation, on behalf of investors [1,3], since optimizing market structure results in more effectively functioning markets [4] and increases competitiveness for market share in listed stocks [5]. The two major stock markets in the U.S., the NYSE and the National Association of Securities Dealers Automated Quotation System (NASDAQ) National Market have very different structures [6,7], and there is continuing controversy over whether reported differences in stock price behavior are due to differences in market structure or company characteristics [8]. Comparative studies of the NYSE and NASDAQ have primarily focused on stock prices to provide evidence that market
organizational structure affects the price formation process [4,9,10]. It has been shown that stocks registered on the NASDAQ may be characterized by a larger bid-ask spread [11] and higher price volatility [4,9,10]. However, this is often attributed to the market capitalization, growth rate or the nature of the companies listed on the NASDAQ [8]. Empirical studies have also emphasized the dominant role and impact of trading volume on prices [12,13]; since traded volume is determined by investors it is difficult to isolate the effects of market structure on price formation. As the influence of market structure on stock prices may be obscured by exogenous factors such as demand and supply [12,13], we hypothesize that modulation of the flow of transactions due to market operations may carry a stronger imprint of the internal market mechanism.
Here we analyse times between consecutive transactions for a diverse group of stocks registered on the NYSE and NASDAQ markets, and we relate the dynamical properties of the intertrade times with those of the corresponding price fluctuations. To understand how market structure may affect stock prices, we study
the information contained in the times between consecutive stock transactions. As market-specific operations may modulate the flow of transactions, we hypothesize that dynamical features of transaction timing reflect the underlying market mechanism. Specifically, we ask if stocks of companies with diverse character-istics registered on a given market exhibit common features in their transaction timing, which may be associated with the particular market structure. Further, we investigate how the dynamical properties of transaction timing over a range of time scales relate to stock price dynamics and whether market structure affects the temporal organisation of price fluctuations.
To probe how market structure influences the trading of stocks, we consider the two major U.S. stock markets, the NYSE and the NASDAQ. All transactions on the NYSE of a given stock are
centralised and are controlled by asinglehuman operator called a
‘‘specialist’’, whose primary role is to match together public buy and sell orders on the basis of price, in an auction-like setting [6]. The NYSE specialist is under obligation to maintain both price continuity and a ‘‘fair and orderly market’’ [6], as well as to intervene, using his own firm’s inventory of available stock, to provide liquidity in the event of an order imbalance, thus preventing sharp changes in the stock price [6]. The NYSE regulations allow for considerable flexibility within the specialist’s operations [2].
In contrast, trading on the NASDAQ is decentralised, with
trading in a given stock managed by a number of dealers called
‘‘market makers’’. These market makers maintain a stock inventory, posting their best prices at which they are prepared to immediately buy and sell stock [7]. Market makers compete with each other for orders, so in theory competition ensures that investors get the best prices. Alternatively, an order can be placed into an Alternative Trading System (ATS), operated by NASD members or NASD-member affiliates and designed to allow two subscribers to meet directly on the system under the regulation of a third party. The most commonly used form of ATS is the Electronic Communication Network (ECN), a facility that matches customer buy and sell orders directly through a computer network. A third alternative, in case the order placed is very small, is to enter the order into the Small Order Execution System (SOES),
which is an electronic network designed to allow fast automatic routing, execution and reporting of orders of 500 shares or less. Orders are automatically routed to market makers whose quotes are currently identical to the highest bid (buy) and the lowest offer (sell) prices. Participation in the SOES system was made mandatory [7] after the market crash of October 1987, as one of the reported problems on the NASDAQ during the crash was the inability to reach market makers by the phone during periods of rapid price movement.
To summarize the differences between the two market structures, each market maker on the NASDAQ maintains his own inventory of stock in order to buy and sell [7]. In comparison, the NYSE specialist rarely uses his own firm’s inventory: such transactions involve less than 15% of trading volume [14]. Although several regional exchanges may trade NYSE listed stocks, price formation has primarily been attributed to NYSE trading [15]. In contrast, the NASDAQ market relies on competition between multiple dealers for public orders to facilitate the price formation process [11]. Moreover, a substantial fraction of share volume on the NASDAQ is not handled by dealers, but is traded electronically via networks for small public orders and for institutional investors [7]. Such fragmentation of the NASDAQ stock market has been associated with higher price volatility [4].
Here we ask to what extent such structural and operational differences between the NYSE and NASDAQ markets affect the flow of transactions. It is difficult to answer whether differences in intertrade times are due to individual company characteristics or external market influences (Fig. 1). Two empirical studies have considered only a single company stock over a short period of a few months [16,17]. Studies which considered a larger group of stocks either did not find common features in the intertrade times [18,19] or did not compare between markets [20–22]. The only comparative study considered a single NYSE and a single Paris stock, finding some differences in their intertrade times, but those may well be due to a different culture of trading [23]. To probe for evidence of the impact of market structure on the trading of stocks, we employ concepts and methods from statistical physics to investigate the correlation properties of transaction timing for
Figure 1. Relationship between stock price and trading activity.Representative example of time series derived from the Trades and Quotes (TAQ) database for transactions of stock in Compaq Computer Corp. (CPQ) registered on the NYSE. (a) Price of CPQ stock over a three week period from 20 Feb.- 8 Mar. 1996 (42606 trades). On 1 Mar. 1996 Compaq reported that it would cut product prices in order to meet sales targets, leading to a drop in the stock price. (b) Intertrade times (ITT) of CPQ stock over the same period. Data exhibit complex fluctuations, a daily pattern of trading activity (with short ITT at the open and close of a trading day and longer ITT in between), and highly heterogeneous structure, as seen in the flurry of trades following the price drop. The relaxation time of the ITT response following the price drop extends over several days, suggesting that information may be contained in the temporal structure of trading activity. Data include transactions occurring between 9.30am and 4pm EST, excluding weekends and holidays.
Table 1. Characteristics of one hundred NYSE stocks studied over the period 4 Jan. 1993–31 Dec. 1996. Company Name (Ticker Symbol) Industry ITT Number of Trades a1 (sec) a2 IT T IT T Company Name (Ticker Symbol) Industry ITT Number of Trades a1 (sec) a2 IT T IT T Meredith (MDP) Food & R etail 35267 6 36 0.6 0.75 M edtronics (MDT) Medical Apparatus 308049 7 5 0.6 0.88 Transco (E) Natural Gas 4 7045 4 05 0.62 0.79 Southern (SO) Electric Services 3 29464 7 1 0.64 0.85 Avery Dennison (AVY) Paper P roducts 62927 3 65 0.59 0.75 Schlumberger (SLB) O il & Gas 330830 7 0 0.61 0.78 Johnson Controls (JCI) Automatic Controls 68490 3 34 0.56 0.73 Amoco (AN) Petroleum 339996 6 9 0.6 0.75 Northrop Grumman (NOC) Aerospace/Defense 6 9739 3 30 0.6 0.81 P G & E (PCG) Electric Services 3 55190 6 6 0.64 1.02 Allergan (AGN) Pharmaceutical 71419 3 22 0.6 0.8 Sprint PCS (FON) Telephone Comms. 3 62851 6 4 0.63 0.92 Jefferson P ilot (JP) Financial 79013 2 92 0.58 0.77 Homestake Mining (HM) Mining 370132 6 3 0.7 0.89 Nalco Chemical (NLC) Chemicals 81731 2 83 0.58 0.72 Union Carbide (UK) Chemicals 387273 6 0 0.64 0.96 Lockheed M artin (LK) Aerospace/Defense 4 4897 2 82 0.58 0.74 N ynex (NYN) Telephone Comms. 3 86703 6 0 0.61 0.87 Northern States Pow. (NSP) Electric Services 8 5724 2 69 0.59 0.76 Morgan J.P. & Co. (JPM) Financial 401213 5 8 0.61 0.87 Dana (DCN) Automotive 89700 2 57 0.59 0.75 Dow Chemical (DOW) Chemicals 411258 5 7 0.62 0.94 Inland Steel Ind. (IAD) Steelworks 91137 2 53 0.6 0.88 Mobil (MOB) Petroleum Refining 4 30401 5 4 0.62 0.76 Ashland Inc. (ASH) Petroleum Refining 9 4396 2 45 0.59 0.77 Schering P lough (SGP) Pharmaceutical 4 31388 5 4 0.62 0.84 General Dynamics (GD) Aerospace/Defense 9 7594 2 37 0.58 0.83 Chase Manhattan (CMB) Financial 448801 5 2 0.65 0.94 Eaton (ETN) Automotive 98796 2 34 0.58 0.76 BellSouth (BLS) Telephone Comms. 4 50144 5 2 0.63 0.86 Ethyl (EY) Chemicals 100663 229 0 .61 0.84 3M (MMM) Paper P roducts 4 49462 5 2 0.61 0.83 TRW Inc. (TRW) Automotive 111506 208 0 .58 0.81 Texaco (TX) P etroleum 457081 5 1 0.62 0.84 Alcan Aluminium (AL) Metals 112193 207 0 .61 0.78 A rch. D an. M idl. (ADM) Food 468148 5 0 0.63 0.94 Unilever (UN) Food & R etail 113736 203 0 .58 0.7 Bell Atlantic (BEL) Telephone Comms. 4 99768 4 7 0.63 0.94 Union Electric (UEP) Electric Services 1 19737 193 0 .6 0.77 P acific Telesis (PAC) Telephone Comms. 5 08091 4 6 0.63 1.03 Hercules (HPC) Chemicals 123618 187 0 .58 0.84 Lilly Eli & Co. (LLY) Pharmaceutical 5 14899 4 5 0.64 0.91 Air Prod. & Chem. (APD) Chemicals 123416 187 0 .57 0.76 Sara Lee (SLE) Food & Retail 5 27814 4 4 0.63 0.93 Textron (TXT) Aerospace/Defense 1 23879 187 0 .59 0.75 Dupont (DD) Chemicals 543724 4 3 0.62 0.87 Carolina Power&Light (CPL) Electric Services 1 31352 177 0 .62 0.81 American Express (AXP) Financial 581840 4 0 0.65 1 Nortel N etworks (NT) Telephone Apparatus 1 32384 176 0 .61 0.89 Fed. N at. Mort. (FNM) Financial 627313 3 7 0.62 0.88 Baltimore G as & E lec. (BGE) Electric Services 1 42973 163 0 .59 0.81 Adv. M icro Dev. (AMD) Semiconductors 644865 3 6 0.66 0.99 Hershey Foods (HSY) Food & R etail 144982 160 0 .59 0.82 C iticorp (CCI) Financial 677484 3 4 0.65 0.93 Honeywell Int. (HON) Aerospace/Defense 1 56376 149 0 .6 0.86 Abbott Labs. (ABT) Pharmaceutical 6 91877 3 4 0.63 0.87 Navistar Int. (NAV) Automotive 168951 138 0 .64 0.97 P fizer (PFE) Pharmaceutical 6 89705 3 4 0.62 0.85 Campbell Soup (CPB) Food & R etail 175869 132 0 .6 0.85 Texas Instruments (TXN) Semiconductors 708329 3 3 0.63 0.9 Raytheon (RTN) Aerospace/Defense 1 76148 132 0 .58 0.79 Boeing A erospace (BA) Aerospace/Defense 7 28779 3 2 0.64 0.93
Table 1. Cont. United Tech. (UTX) Aerospace/Defense 1 90049 122 0 .59 0.82 Exxon (XON) Petroleum Refining 7 50298 3 1 0.62 0.91 Nucor (NUE) Steelworks 194532 119 0.58 0.9 Johnson & Johnson (JNJ) Pharmaceutical 1 001549 23 0.64 0.9 Barnett B anks (BBI) Financial 202774 115 0 .6 0.84 H ewlett-Packard (HWP) Hardware 1094829 21 0.64 0.92 Phelps Dodge (PD) Metal Refining 203834 114 0.6 0.85 Home Depot (HD) Retail 1103037 21 0.65 1.04 McDonnell Douglas (MD) Aerospace/Defense 2 03845 114 0 .6 0.88 Brist. Myers Squibb (BMY) Pharmaceutical 1 121714 21 0.65 0.88 Fluor (FLR) Construction 2 05913 113 0 .59 0.83 G eneral Motors (GM) Automotive 1 130452 21 0.66 0.95 General Mills (GIS) Food & R etail 227318 103 0 .59 0.83 Compaq Computer (CPQ) Hardware 1184985 20 0.67 0.96 Newmont Mining (NEM) Mining 232391 100 0 .64 0.82 Chrysler (C) Automotive 1 231979 19 0.67 0.95 Anheuser Busch (BUD) Food & R etail 251972 93 0.6 0.88 Coca Cola (KO) Food & Retail 1 244660 19 0.66 0.98 USX-US Steel Grp. (X) SteelWorks 252435 92 0.61 0.92 Ford (F) Automotive 1 260730 19 0.65 0.92 Alza (AZA) Pharmaceutical 257116 91 0.62 0.92 G TE (GTE) Telephone Comms. 1 268523 18 0.65 0.91 Alcoa (AA) Metal Refining 2 60980 89 0.61 0.78 P epsico (PEP) Food & Retail 1 321427 18 0.65 1.04 Bank Boston (BKB) Financial 262506 89 0.63 0.89 G eneral Electric (GE) Food & Retail 1 374682 17 0.63 0.91 Colgate Palmolive (CL) Food & R etail 262896 88 0.6 0.93 Philip Morris (MO) Food & Retail 1 527659 15 0.66 1.06 Goodyear Tire & Rub. (GT) Automotive 272025 85 0.61 0.89 IBM (IBM) Hardware 1677319 14 0.68 0.92 Niagara Mohawk Pow. (NMK) Electric Services 2 76284 84 0.62 1.07 A T&T (T) Telephone Comms. 1 689767 14 0.66 1.04 Atlantic Richfield (ARC) Petroleum 2 86580 81 0.6 0.76 W al Mart (WMT) R etail 1794160 13 0.7 1 FPL G roup (FPL) Electric Services 3 03364 77 0.62 0.93 M erck & Co. (MRK) Pharmaceutical 2 055443 11 0.69 0.93 Royal Dutch Petrol. (RD) Petroleum 3 04505 76 0.6 0.78 Motorola (MOT) Hardware 2204059 11 0.67 1.08 Companies range in average m arket capitalisation from $ 0 : 8 | 10 9to $ 102 | 10 9over the p eriod, and are ranked in order o f decreasing average value o f ITT ( ITT ). We include all trades occurring during NYSE trading h ours (9.30am–4pm EST), excluding public holidays and w eekends. doi:10.1371/journal.pone. 0092885.t001 Company Name (Ticker Symbol) Industry ITT Number of Trades a1 (sec) a2 IT T IT T Company Name (Ticker Symbol) Industry ITT Number of Trades a1 (sec) a2 IT T IT T
Table 2. Characteristics of one hundred NASDAQ stocks studied; data covers twenty nine companies over the period 4 Jan. 1993–31 Dec. 1996, and seventy one comp anies (marked with *) over the period 3 Jan. 1994–30 Nov. 1995. Company Name (Ticker Symbol) Industry ITT Number of Trades a1 (sec) a2 IT T IT T Company Name (Ticker Symbol) Industry Oshkosh B Gosh (GOSHA) Retail & F ood 31986 683 0.68 0.73 US Robotics (USRX*) Hardware 1 43912 78 0.75 0.8 Sanmina-SCI (SANM*) Hardware 22648 438 0.7 0.81 Symantec (SYMC*) Software 1 43405 77 0.77 0.75 MedImmune (MEDI*) Biotech. 24618 414 0.66 0.97 Autodesk (ACAD) Software 2 61716 74 0.77 0.83 ICOS (ICOS*) Pharmaceutical 32460 339 0.65 0.87 Oxf. Health Plans (OXHP*) Financial 1 50501 74 0.75 0.87 Gilead Sciences (GILD*) Biotech. 32187 332 0.67 0.83 Komag (KMAG*) Hardware 1 75953 63 0.79 0.77 Molex (MOLX*) Hardware 34104 321 0.7 0.66 Biomet (BMET) Med. Apparatus 3 79342 62 0.73 0.94 Coors Adolph (ACCOB) Food & Retail 78393 295 0.67 0.73 Novellus Systems (NVLS*) Hardware 1 82185 61 0.76 0.77 Whole Foods Mar. (WFMI*) Food & Retail 38018 290 0.69 0.89 Mobile Tel. Tech. (MTEL*) Telephone Comms. 1 84469 61 0.8 0.93 Ross Stores (ROST*) Food & Retail 42772 256 0.7 0.85 KLA-Tencor (KLAC*) Hardware 1 87614 60 0.78 0.71 XOMA (XOMA*) Pharmaceutical 43073 256 0.68 0.91 St. Jude Medical (STJM) Med. Apparatus 3 88393 59 0.79 0.82 Paccar (PCAR) Automotive 94496 245 0.72 0.77 AST R esearch (ASTA*) Hardware 191683 58 0.76 0 .91 General Nutr. Cos. (GNCI*) Food & Retail 48222 226 0.71 0.79 Parametric Tech. (PMTC*) Software 1 97637 57 0.79 0.83 Ryans Fam. Steak. (RYAN) Food & Retail 108243 215 0.66 0.77 Starbucks (SBUX*) Food & Retail 2 01225 56 0.79 0.86 Caliber System (ROAD) Transportation 106570 209 0.72 0.81 Read-Rite (RDRT*) Hardware 2 05021 54 0.76 0.8 Giddings & L ewis (GIDL) Heavy Machinery 57081 204 0.7 0.83 Borland Software (BORL*) Software 2 07697 54 0.75 0.97 Huntington Banc. (HBAN*) Financial 55885 199 0.68 0.83 Gateway 2000 (GATE*) Hardware 2 17267 52 0.8 0.89 Worthington Ind. (WTHG) Steelworks 119751 194 0.7 0.69 L M Ericsson Tel. (ERICY*) Hardware 2 28287 49 0.73 0.95 Phycor (PHYC*) O ffice Services 59431 183 0.75 0.76 StrataCom (STRM*) H ardware 235537 48 0.77 0 .8 Intergraph (INGR) Hardware/Softwa re 131780 176 0.7 0.87 Xilinx (XLNX*) Semiconductors 239423 47 0.76 0.79 Shared Medical Sys. (SMED) H ardware/Softwa re 132579 175 0.76 0.8 B iogen (BGEN*) Biotech. 241886 46 0.82 0 .9 Glenayre Tech. (GEMS*) Hardware 63152 174 0.69 0.81 Adaptec (ADPT*) Hardware 2 53082 44 0.78 0.75 PETsMART (PETM*) Food & Retail 67047 165 0.72 0.83 Acclaim Ent. (AKLM*) Software 2 82481 40 0.8 0.92 Tyson Foods (TYSNA*) F ood & Retail 70711 158 0.7 0.79 Chiron (CHIR*) Pharmaceutical 292353 38 0.81 0.85 MFS Comms. (MFST*) Telephone Comms. 70776 157 0.73 0.86 Tellabs (TLAB*) Hardware 2 99490 38 0.79 0.84 Brunos (BRNO) Food & Retail 99211 155 0.67 0.88 Adobe Systems (ADBE*) Software 3 07959 36 0.8 0.87 Sigma-Aldrich (SIAL*) Chemicals 72843 153 0.69 0.89 America Online (AMER*) Services 314541 36 0.74 0 .94 Atlantic S.E. Air. (ASAI*) Transportation 75031 148 0.72 0.85 Electronic A rts (ERTS*) Software 329541 34 0.79 0 .81 Cephalon (CEPH*) Pharmaceutical 71733 148 0.7 0.88 Qualcomm (QCOM*) Hardware 3 35494 34 0.77 0.87 Safeco (SAFC) Financial 157461 148 0.77 0.78 Informix (IFMX*) Software 350185 32 0.8 0.82 Comcast (CMCSA) Cable T V 161408 144 0.72 0.79 Altera (ALTR*) Semiconductors 349925 32 0.78 0.88 Stew. & Stev. Svcs (SSSS*) Heavy Machinery 79177 141 0.75 0.81 Tele Comms. (TCOMA) Cable T V 765301 31 0.72 0 .98 American Greetings (AGREA) Food & Retail 169265 138 0.73 0.76 Amer. Pow. Conv. (APCC*) Electrical Apparatus 3 95510 28 0.71 1.02 Northwest Airlines (NWAC*) Transportation 77658 127 0.76 0.88 Lotus D evel. (LOTS) Software 582256 25 0.82 0 .97 ITT Number of Trades a1 (sec) a2 IT T IT T
Table 2. Cont. ADC TeleComms. (ADCT*) Hardware 90573 123 0.74 0.77 Integr. Dev. Tech. (IDTI*) Semiconductors 471169 24 0.79 0 .86 Charming Shoppes (CHRS) F ood & Retail 196473 119 0.71 0.89 Cirrus L ogic (CRUS*) Semiconductors 500710 22 0.79 0.8 HBO & Co. (HBOC*) Hardware/Softwa re 95662 116 0.78 0.71 US HealthCare (USHC*) Financial 5 05215 22 0.76 0.97 Microchip Tech. (MCHP*) Semiconductors 102625 109 0.73 0.8 MCI Comms. (MCIC) Telephone Comms. 1 096316 21 0.74 0.94 Andrew (ANDW) Hardware 215063 109 0.72 0.79 DELL (DELL*) Hardware 5 57195 20 0.8 0.82 Legent (LGNT*) Software 90705 108 0.75 0.92 DSC Comms. (DIGI) Hardware 1 209063 19 0.79 0.84 Stryker (STRY*) M edical Apparatus 107678 104 0.79 0.8 Applied Materials (AMAT*) Hardware 584276 19 0.79 0 .79 PeopleSoft (PSFT*) Software 108433 102 0.76 0.79 Sybase (SYBS*) Software 6 31753 18 0.79 0.98 Outback Steak. (OSSI*) Food & Retail 112607 99 0.75 0.86 Amgen (AMGN) Biotech. 1392229 17 0.79 0.91 Boatmens Banc. (BOAT) Financial 236139 99 0.73 0.81 3Com (COMS*) Hardware 6 99889 16 0.79 0.77 Intelligent Elec. (INEL*) Hardware 113666 98 0.74 0.89 Apple Computer (AAPL) H ardware 1646925 1 4 0.76 0 .97 Genzyme General (GENZ*) Biotech. 116223 96 0.76 0.83 Novell (NOVL) Software 1 803407 13 0.74 1.04 Bed B ath & B eyond (BBBY*) Food & R etail 120723 92 0.79 0.8 O racle (ORCL) Software 1817365 1 3 0.77 0 .89 Intuit (INTU*) Software 122051 91 0.74 1.03 Sun M icrosystems (SUNW) Hardware/Softwa re 2029156 1 2 0.79 0 .81 Boston Chicken (BOST*) Food & R etail 128376 87 0.74 0.91 Cisco Systems (CSCO*) H ardware 1093386 1 0 0.77 0 .95 Staples (SPLS*) Food & R etail 132041 85 0.78 0.78 Microsoft (MSFT*) Software 1505531 7 0.77 0 .78 Linear Tech. (LLTC*) Semiconductors 139953 80 0.77 0.84 Intel (INTC) Semiconductors 4807756 5 0.77 0 .89 Companies range in average m arket capitalisation from $ 0 : 2 | 10 9to $ 40 | 10 9,and are ranked in order o f d ecreasing average value o f ITT ( ITT ). We include all trades occurring during regular NASDAQ trading hours (9.30am–4pm EST), excluding public holidays and weekends. doi:10.1371/journal.pone.0092 885.t002 Company Name (Ticker Symbol) Industry ITT Number of Trades a1 (sec) a2 IT T IT T Company Name (Ticker Symbol) Industry ITT Number of Trades a1 (sec) a2 IT T IT T
diverse companies, over time scales ranging from seconds up to a year.
Data
We examine one hundred stocks listed on the NYSE, from eleven industry sectors: Technology-Hardware(5), Semiconduc-tors(2), Pharmaceutical & Medical Equipment(10), Financial(8), Automotive(9), Defense/Aerospace(9), Mining, Metals & Steel Works(8), Chemicals & Plastics(7), Retail & Food(17), Petroleum, Gas & Heavy Machinery(10), Telephone Service Providers(7), Electric & Power Services(8). We study the time intervals between successive stock trades, over a period of four years–4 Jan. 1993 to 31 Dec. 1996–as recorded in the Trades and Quotes (TAQ) database from the NYSE (Table 1).
We also analyse one hundred NASDAQ stocks from fourteen industry sectors: Technology-Hardware(28), Technology-Soft-ware(16), Semiconductors(7), Pharmaceutical, Biotechnology &
Medical Equipment(12), Financial(5), Automotive(1), Steel
Works(1), Chemicals(1), Retail & Food(16), Petroleum, Gas & Heavy Machinery (2), Telephone & Cable Television Service Providers(5), Services(2), Transportation(3), Electrical Appara-tus(1). We study the time intervals between successive stock trades as recorded in the TAQ database, for twenty-nine companies over the period 4 Jan. 1993–31 Dec. 1996, and seventy one companies over the period 3 Jan. 1994–30 Nov. 1995 (marked with (*) in
Table 2). For both markets, we select companies with average market capitalisations ranging over three decades, and varying levels of trading activity with average values of intertrade time between 11 and 640 seconds for NYSE stocks, and between 5 and 680 seconds for NASDAQ stocks. In parallel with the intertrade times, we analyse the prices for both sets of stocks over the same periods.
Method
Like many financial time series the intertrade times (ITT) are inhomogeneous and nonstationary, with statistical properties changing with time, e.g. ITT data exhibit trends superposed on a pattern of daily activity [24]. While ITT fluctuate in an irregular and complex manner on a trade-by-trade basis, empirical observations reveal that periods of inactive trading are often followed by periods of more active trading (Fig. 1). Such patterns can be seen at scales of observation ranging from minutes to months, suggesting that there may be a self-similar, fractal structure in the temporal organisation of intertrade times, independent of the average level of trading activity of a given stock [24].
To probe for scale-invariant features in the fluctuations of intertrade times, we apply the detrended fluctuation analysis (DFA) method, which has been shown to detect and accurately quantify long-range power-law correlations embedded in noisy non-stationary time series with polynomial trends [25]. We choose this method because traditional techniques such as power spectral, autocorrelation and Hurst analyses are not suited to nonstationary data [26]. The DFA method (DFA-l) quantifies the
root-mean-square fluctuationsF(n)of a signal at different time scalesn, after
accounting for nonstationarity in the data by subtracting
underlying polynomial trends of order (l{1). A power-law
functional formF(n)
~
naindicates self-similarity and fractal scalingin the ITT time series. The scaling exponent a quantifies the
strength of correlations in the ITT fluctuations: ifa~0:5there are
no correlations, and the signal is uncorrelated random noise; if
av0:5the signal is anti-correlated, meaning that large values are
more likely to be followed by small values; if aw0:5there are
positive correlations and the signal exhibits persistent behaviour, where large values are more likely to be followed by large values
and small values by small values. The higher the value ofa, the
stronger the correlations. The DFA method avoids the spurious detection of apparent long-range correlations that are an artifact of polynomial trends and other types of nonstationarities [27–30]. Results
We find that the ITT series for all stocks on both markets exhibit long-range power-law correlations over a broad range of time scales, from several trades to hundreds of thousands of trades,
characterised by a scaling exponentaw0:5(Fig. 2 and Fig. 3). For
all stocks on both markets we observe a crossover in the scaling
curveF(n)from a scaling regime with a lower exponenta1 over
time scales less than a trading day, to a scaling regime with an
exponenta2wa1(stronger positive correlations) over time scales
from days to almost a year.
Further, we find that this crossover is systematically more pronounced for NYSE stocks compared to NASDAQ stocks (Fig. 2 and Fig. 3). Characterising ITT fluctuations over time scales less than a day, we find that NASDAQ stocks exhibit statistically stronger correlations than NYSE stocks as indicated by Student’s
t-test (t~25:28,pv10{63), with significantly higher average value
of the exponentaITTNASDAQ
1 ~0:75+0:04(group mean+std. dev.)
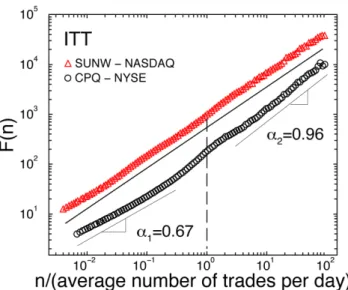
Figure 2. Root-mean-square fluctuation functionF(n)obtained using DFA-2 analysis, for the intertrade times (ITT) of stock in NASDAQ company Sun Microsystems (SUNW) and NYSE company Compaq Computer Corp. (CPQ).Heren indicates the
time scale in number of trades. We normalize the time scalenby the
daily average number of trades for each stock, so that a unit normalized scale indicates one trading day (marked by a dashed line). The scaling curves are vertically offset for clarity. While both companies have similar market capitalisations, industry sectors and average levels of trading activity (average ITT) and exhibit long-range power-law correlations over a broad range of scales, the scaling behaviour of the intertrade times for the two stocks is quite different. For CPQ we find a pronounced crossover from weaker correlations over time scales smaller than a day, to stronger correlations over time scales larger
than a trading day (aITTCPQ
2 wa
ITTCPQ
1 ). In contrast, the scaling function
F(n)for SUNW does not exhibit such a crossover, and we find much
stronger correlations over time scales smaller than a trading day
compared with CPQ (aITTSUNW
1 wa
ITTCPQ
1 ).
as compared to aITTNYSE
1 ~0:62+0:03 (Fig. 3). In contrast, over
time horizons above a trading day, we find that the correlation
properties of ITT on both markets are statistically similar (t~2:27,
p~0:03), with average scaling exponent aITTNASDAQ
2 ~0:85+0:08
comparable with aITTNYSE
2 ~0:87+0:09 (Fig. 3). Values for the
scaling exponentsaITT
1 andaITT2 for the companies on the NYSE
and NASDAQ markets are shown in Table 1 and Table 2 respectively.
We next investigate how the correlation properties of ITT depend on the average level of trading activity, and if this dependence differs with market structure. Since both sets of a hundred stocks that we study on the NYSE and NASDAQ markets encompass a range of average trading activity spanning over two decades, we split both sets into six subsets with matching
average ITT (ITT) and approximately equal numbers of stocks in
each subset (Fig. 3a,b). Within each market we find that over time
scales less than a day, the correlation exponentaITT
1 characterising
the trading dynamics is larger for stocks with higher trading
activity (lowerITT) and correspondingly higher market
capitalisa-tion (Fig. 3a,b and Fig. 4a). Surprisingly, this dependence persists
also foraITT
2 , characterizing the dynamics over much longer time
scales, ranging from days to months (Fig. 4b). For NYSE stocks we
find a logarithmic dependence of aITT
1 and aITT2 on ITT
(subsequent to posting this manuscript on the Los Alamos archive [31], this logarithmic dependence was later confirmed in [32] on a different set of NYSE stocks). This dependence does not appear to hold for NASDAQ stocks (Fig. 4).
We then compare the scaling behaviour of ITT for each subset of NASDAQ stocks with the corresponding subset of NYSE stocks
with matching ITT. We find that for each subset the average
correlation exponentaITT
1 for the NASDAQ stocks is significantly
higher compared to the NYSE stocks (all p values v10{13;
Figure 3. Different correlation properties in intertrade times for stocks registered on the NYSE and NASDAQ markets.Correlation
exponentsa1anda2characterising the temporal structure in ITT for (a) one hundred NYSE stocks and (b) one hundred NASDAQ stocks, of companies
with a broad range of market capitalisations and industry sectors. Stocks are ranked in order of decreasing average value of ITT (ITT) (as in Tables 1
and 2), and are split into subsets (marked by vertical dashed lines) of companies with matchingITT, and with approximately equal number of stocks
in each subset. We estimateaITT
1 over scales from 8 trades to half of the daily average number of trades (for stocks with fewer than1:5|105trades/
year), and to a third of the daily average number of trades (for stocks with more than1:5|105trades/year). We estimateaITT
2 over scales from 3 to
100 times the daily average number of trades. Group averages and standard deviations ofaITT
1 andaITT2 are shown to the right of the panel for each
market. Systematically higher values ofaITT
1 for the NASDAQ stocks as compared to the NYSE stocks (statistically significant difference with p-value
pv10{63by Student’s t-test), suggest an underlying influence of market structure on the temporal organisation of intertrade times over scales within
a trading day. In contrast, no systematic differences between the two markets are observed in the values ofaITT
2 , characterising correlation properties
of intertrade times over scales above a trading day (p~0:03by Student’s t-test). We find similar results when we analyse trading activity at high
resolution in terms of the number of trades per minute: a crossover at one trading day and stronger correlations for NASDAQ stocks compared to NYSE stocks over time scales less than a day (features which were not observed in previous studies [52,50]). We further observe an increasing trend in
the values ofaITT
1 andaITT2 with decreasingITTand increasing company capitalisation for the companies on both markets.
Fig. 4a). We also find that there is no significant correlation
between the differences aITTNASDAQ
1 {a
ITTNYSE
1 in each subset and
the ITT, as indicated by Pearson’s test (r~{0:62, p~0:19).
These observations show that within a trading day the difference in the correlation properties of intertrade times of NYSE and NASDAQ stocks is independent of the average level of trading
activity. In contrast toaITT
1 , there is no systematic difference in the
values of the average aITT
2 for NASDAQ and NYSE stocks for
subsets with matchingITT(allpvaluesw0:08; Fig. 4b) except for
the subset of companies with the highest frequency of trading
(pv0:01; Fig. 4b).
Since for both NYSE and NASDAQ stocks we have chosen companies representing eleven industry sectors with a broad range of market capitalisations and average levels of trading activity spanning over more than two decades, our findings of (i) a crossover in the scaling behaviour of ITT that is more pronounced for NYSE stocks, and (ii) stronger correlations over intraday time
scales of NASDAQ stocks with higher values foraITT
1 compared to
NYSE stocks, support our hypothesis that market structure affects the dynamics of transaction timing. However, more established companies listed on the NYSE may be subject to different trading patterns when compared with the younger and more rapidly growing companies on the NASDAQ. To verify that the stronger correlations in ITT over time scales less than a day for NASDAQ stocks are indeed due to market structure, we ask if the scaling properties of ITT systematically change for companies that transfer from the NASDAQ to the NYSE. In particular, we investigate the trading dynamics of ten companies that moved from the NASDAQ to the NYSE around the end of 1994 and the beginning of 1995 (Table 3). For each company, we analyse the ITT time series while the company was registered on the NASDAQ, and then repeat the analysis when the company was on the NYSE.
For all ten companies we find a significant change in the scaling properties of intertrade times: a marked decrease in the strength of
the power-law correlations within a trading day (lower aITT
1 )
associated with the transfer from the NASDAQ to the NYSE
(average difference aITT
1 ~0:13+0:03; Fig. 5b). There is
however, no corresponding systematic change in the correlations over time scales above a trading day (average difference
aITT
2 ~0:03+0:08; Fig. 5c), consistent with our findings of
statistically similar values of scaling exponent aITT
2 for the two
groups of one hundred stocks registered on the NYSE and NASDAQ (Fig. 2 and Fig. 3). Thus, our results indicate that market structure impacts not only trading dynamics on a trade-by-trade basis [19], but also the fractal temporal organisation of trades over time scales from a few seconds up to a day. The presence of stronger intraday correlations in transaction timing for NASDAQ stocks may be attributed to the multiplicity of dealers (ranging from 2 to 50 per stock during 1994 [11]) and electronic methods of trading (Electronic Communication Networks and the Small Order Execution System [7]), allowing the NASDAQ to efficiently absorb fluctuations in trading activity in almost real time [5]. In contrast, for each stock on the NYSE, while there is the electronic SuperDOT routing system, each order has to be exposed to and compared with outstanding orders, as the single NYSE specialist finds the best bid to match an offer with [6]. This may lead to interruptions in the execution of a rapid succession of trades on the NYSE, resulting in weaker correlations in intertrade times within a trading day.
On the other hand, our finding of stronger power-law correlations for both markets over time horizons from a trading
day to several months (aITT
2 waITT1 ) suggests that investors’
behaviour is more coherent over longer time scales, as information driving trading activity takes time to disseminate. Moreover, this
can account for the similar values ofaITT
2 for subsets of NYSE and
NASDAQ stocks with matched ITT (Fig. 4b), since news and
information driving trading activity are exogenous to market structure.
Finally, we investigate if the market-mediated differences in long-range power-law correlations in ITT translate into differenc-es in the scaling behaviour of price fluctuations of stocks registered on the NASDAQ and NYSE markets. To this end, in parallel with ITT we analyse the absolute price returns for each company in our
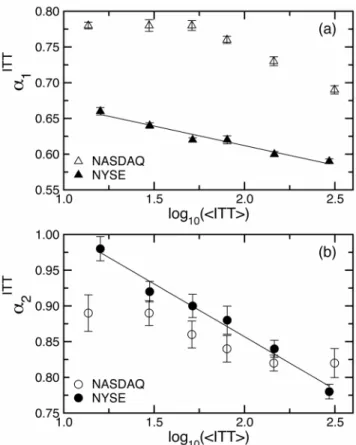
Figure 4. Comparing long-range correlations in ITT for groups of stocks with varying average levels of trading activity on the NYSE and the NASDAQ. (a) Dependence of exponent aITT
1 ,
characterizing the strength of correlations in ITT over scales from seconds up to a trading day, on the average level of trading activity. Each datapoint represents the group average over a subset of stocks,
with a matching range of average intertrade timesITT for the two
markets. Stocks are grouped into subsets as indicated by vertical dashed lines in Fig. 3a,b. The consistent difference in the scaling
exponent aITT
1 between NYSE and NASDAQ stocks suggests that
independent of company characteristics such as market capitalization and industry sector, the temporal organization of ITT within a trading day carries an imprint of market structure. (b) Dependence of exponent aITT
2 characterizing correlations in ITT over time scales from a trading
day to several months, on the average level of trading activity. On both markets we observe similar behavior with no systematic difference in
the values ofaITT
2 between NYSE and NASDAQ subsets of stocks with
matching ranges ofITT. These results suggest that over time horizons
longer than a trading day, the impact of market structure on trading dynamics is less pronounced as more information is available to investors over longer time scales, driving their trading activity. The resulting more coherent behavior of investors is reflected in stronger
correlations(aITT
2 waITT1 )over longer time scales.
doi:10.1371/journal.pone.0092885.g004
∆
database for both markets. For all stocks we observe a crossover at
a trading day in the scaling functionF(n) of price fluctuations
[33,24], from weaker to stronger correlations, corresponding to the crossover we observe for intertrade times. In addition we find that over time scales less than a day, stocks with stronger correlations in ITT exhibit stronger correlations in absolute price
returns (Fig. 6a), as indicated by Pearson’s test (r~0:9,pv10{68).
In particular, we find that the stronger correlations in ITT
associated with the NASDAQ market structure
(aITTNASDAQ
1 wa
ITTNYSE
1 ), are accompanied by stronger correlations
in price fluctuations (ajRETjNASDAQ
1 wa
jRETjNYSE
1 ) over time scales
within a trading day (Fig. 6a).
We also find evidence of a positive relationship between correlations in ITT and correlations in price fluctuations over time scales larger than a trading day for NASDAQ stocks (Pearson’s test shows statistically significant correlation between aITTNASDAQ
2 witha
jRETjNASDAQ
2 withr~0:64,pv10
{12; Fig. 6b). In
contrast, there is no corresponding positive relationship between aITT
2 witha
jRETj
2 for NYSE stocks (Pearson’s test:r~0:17,p~0:1),
suggesting a weaker coupling between trading dynamics and price formation under the NYSE market structure, over time horizons above a trading day. While previous work has suggested that bursts of trading activity have an instantaneous impact on stock prices [19,34], our results show that the interaction between trading times and price formation is more complex, where scale invariant temporal patterns in ITT are linked with scaling features of price fluctuations over a broad range of time scales.
We then test whether long-range correlations in ITT are also linked with stock price volatility. Previous studies have reported higher price volatility for NASDAQ stocks compared to NYSE stocks [4,9,10]. We find a positive relationship, with stronger correlations in ITT over time scales less than a day related to
higher daily volatility sRET (Pearson’s test: r~0:73, pv10{33;
Fig. 6c). Further, we find that the NASDAQ stocks have higher aITT
1 and correspondingly highersRET compared to NYSE stocks
(Fig. 6c). This relationship may appear to follow from our
observation that aITT
1 depends on ITT (Fig. 4a), and previous
studies which connect price volatility with periods of high transaction rates [16,35]. However, for the stocks in our database
(Tables 1 and 2), we find no correlation between sRET and
average level of trading activity as measured byITT (Pearson’s
test:r~0:01, p~0:36; Fig. 6d). Thus the relationship between
aITT
1 and sRET suggests that information contained in the
microscopic temporal structure of ITT is carried over a range of scales to impact daily price volatility.
Discussion
Understanding the statistical properties of intertrade times and the related underlying mechanism is crucial for the development of more realistic models not only of the flow of transactions [36–38], but more importantly to elucidate (i) the relation between intertrade time dynamics and stock price formation [16,18,39– 41], and (ii) how the process of stock price formation is influenced by market structure. In that context, several prior studies have focused not only on the correlation properties, but also on nonlinear features of intertrade times, and on the functional form of their probability distribution. Early studies reported stretched exponential distributions for intertrade times based on data from a single actively-traded stock over a short period of a few months [16,17], or power-law tailed distributions for rarely-traded 19th century stocks [42] and eurobonds traded in 1997 [43]. While
Table 3. Characteristics of ten stocks that moved from the NASDAQ to the NYSE during the period 3 Jan. 1994–30 Nov. 1995. Company Industry NASDAQ NYSE Ticker Symbol Number of Days ITT Number of Trades (sec) Ticker Symbol Number of Days ITT Number of Trades (sec) Input Output Measuring Devices IPOP 219 25211 198 IO 265 10944 540 Consolidated Papers P aper Mills CPER 1 54 8902 3 89 CDP 330 15180 488 Cardinal Health Wholesale Drugs CDIC 171 11510 333 CAH 313 14819 475 AK Steel Holding Corp. Steelworks AKST 256 14575 383 AKS 167 10397 364 Sports & Recreation Retail SPRC 177 17721 222 WON 307 19907 345 State Street Boston Financial STBK 2 82 43829 148 S TT 202 16916 273 Dollar General Retail DOLR 273 34873 180 DG 211 19817 241 Mid-Atlantic Medical Services Financial MAMS 187 90598 48 MME 297 50245 136 Seagate Hardware SGAT 238 119544 46 SEG 246 85100 67 Newbridge Networks Hardware NNCXF 176 208771 20 NN 308 148637 28 Companies are ranked in order o f d ecreasing average value of ITT when o n the NYSE. We include all trades occurring during NYSE trading hours (9.30am–4p m EST) excluding public holidays a nd weekends. doi:10.1371/journal.pone. 0092885.t003
some of these studies have also considered autocorrelations in intertrade times, they have not identified the functional form of these correlations and whether they are persistent or
anti-persistent. A first systematic empirical study based on 30 frequently-traded US stocks over a long period of several years [24] has (i) reported long-range power-law correlations of persistent type with a characteristic crossover to a superdiffusive behavior at time scales above a trading day, and (ii) identified a Weibull functional form for the distribution of intertrade times. In a follow up study based on a different group of US stocks [38], the Weibull functional form was also considered a good fit for the intertrade time distribution, with the Tsallis q-exponential form as an alternative. Further investigations considering the intertrade dynamics of a group of frequently-traded Chinese stocks have shown that the Weibull distribution outperforms the Tsallis q-exponential for more than 98.5% of the data [20]. The long-range power law correlations in intertrade times initially reported for US stocks [24] were also observed for liquid stocks on the Shanghai Stock Exchange [22]. Our results based on 100 NASDAQ and 100 NYSE stocks confirm the presence the long-range power law correlations. The results of these studies, which focus on different markets and different time periods, confirm that the Weibull distribution and long-range power law correlations are stable characteristics of intertrade time dynamics across markets and temporal time scales. Interestingly, similar characteristics were recently reported for commodity dynamics of ancient Babylon (463–72 B.C), and medieval and early modern England (1209– 1914 A.D.) markets [44].
It has been recently hypothesized [36] that the dynamics of intertrade times maybe governed by a priority decision-based queuing mechanism [45,46]. This hypothesis, however, does not appear plausible. First, the priority queuing process proposed in [45] leads to power law distributions for the timing between events, which has been rejected for intertrade times [20,38]. Second, this queuing process does not generate long-term correlations, contrary to empirical findings for intertrade times of stocks reported in [20,22,24], and in the current study comparing stocks on different markets. Moreover, the activity pattern of a single stock broker is not adequately described by a power law, but rather by a power law with a stretched exponential tail [46], which is actually the functional form of the Weibull distribution [24]. Further, it is unlikely that the priority decision-based queuing process underlies stock market operations, since market agents treat all orders for stock transactions with the same priority no matter how big or small the order, because the objective of market agents is to execute all orders as soon as possible. For this reason, each stock transaction is a minimal time event realization resulting from the competition of a number of market agents with different reaction times–the statistics of minimal events derived from multiple realizations are described by Weibull distributions. Thus, the process of stock market operations is markedly different from the processes governing the dynamics of other human activities, such as web browsing or email exchange that are based on priority queuing [45,46]. Furthermore, in contrast to priority decision-based processes, intertrade dynam-ics exhibit nonlinear (multifractral) properties, as first empirically identified in [24] and later confirmed in the framework of multifractal random walks [36].
To summarize, this is the first large empirical study to investigate intertrade times comparing 200 stocks registered on the NYSE and NASDAQ markets representing diverse sectors of the economy, where all stock transactions over a period of four years are included (Table 1 and 2, Figure 2 and Figure 3). This is also the first study to examine changes in the trading dynamics of stocks of companies that moved from one market to the other (Table 2 and Figure 5).
Figure 5. Correlation properties of intertrade times of compa-nies that moved from the NASDAQ to the NYSE.(a) Fluctuation
functionF(n), obtained using DFA-2 analysis on ITT of stock in the
company Mid-Atlantic Medical Services Inc. while it was on the NASDAQ (3 Jan. 1994–29 Sep. 1994) and then after it moved to the NYSE (30 Sep.
1994–30 Nov. 1995). Herenindicates the scale in number of trades and
the vertical dashed lines indicate the average daily number of trades while on the NYSE or the NASDAQ. The two scaling curves are vertically offset for clarity. After the move to the NYSE there is a decrease in the
correlation exponent a1 at time scales within a trading day and a
pronounced crossover to stronger correlations with a higher exponent
a2 at larger time scales. (b)aITT1 characterising fluctuations over time
scales less than a trading day in ITT of stock in ten companies that moved from the NASDAQ to the NYSE. Companies are ranked in order
of decreasingITTwhile on the NYSE (as in Table 3) and the scaling
range foraITT
1 is the same as for the hundred NYSE and NASDAQ stocks
(Fig. 3a,b). For all companies there is a decrease inaITT
1 after the move
to the NYSE, indicating that the transition to weaker correlations in ITT over time scales less than a day is due to the NYSE market structure and
not to company-specific characteristics. (c) aITT
2 over time scales
extending from a trading day to almost a year. In this case we do not observe any systematic change when companies move to the NYSE, which is consistent with the finding of statistically similar values of
scaling exponentaITT
2 for the two groups of the one hundred stocks
registered on the NYSE and on the NASDAQ (Fig. 3a,b). doi:10.1371/journal.pone.0092885.g005
We report that trading dynamics of company stocks are characterized by a scale-invariant temporal organisation of intertrade times which is significantly different for stocks registered on the NYSE and the NASDAQ, indicating that market structure influences the correlation properties of transaction timing. Specifically, we find that intertrade times are more strongly correlated for NASDAQ stocks, when data are analysed over time scales within a trading day, and that this difference is independent of the average level of trading activity of the companies (Figures 2, 3 and 4). In contrast, on time scales above a trading day there is no significant difference in the long-range correlations of companies on the two markets.
Investigating a group of companies that transferred from the NASDAQ to the NYSE, we find that intertrade times exhibit significantly stronger power-law correlations over scales from seconds to a trading day while the companies are on the NASDAQ (Figure 5). These findings suggest that market structure impacts trading dynamics, not only on a trade-by-trade basis, but over a broad range of time scales. In addition, our results imply that within a trading day the NASDAQ market structure may be more efficient than the NYSE market structure in absorbing rapid variations in trading activity in response to investors’ demand [47]. In contrast, on scales above a trading day our results suggest a more coherent behavior of market agents in response to events on
Figure 6. Relation between correlations in intertrade times and stock price dynamics.(a) Dependence of exponentaj1RETjcharacterising
power-law correlations in absolute logarithmic price return fluctuations, on correlation exponentaITT
1 characterising intertrade times within a trading
day. Data represent one hundred NYSE (Table 1) and one hundred NASDAQ (Table 2) stocks. We calculate price returns over 1-minute intervals and
aj1RETj over time scales from 8 to 180 minutes (&half a trading day, which is 390 minutes). The positive relationship betweenaITT
1 anda
jRETj 1
indicates that stronger correlations in ITT are coupled with stronger correlations in price fluctuations. This finding suggests that price fluctuations are not merely a response to short-term bursts of trading activity [34,16]: rather the fractal organisation of price fluctuations over a broad range of time scales is linked to the observed underlying scaling features in the series of intertrade times. (b) Strong relationship between correlations in ITT and correlations in price fluctuations over time scales larger than a trading day for NASDAQ stocks. In contrast, there is no corresponding positive relationship for NYSE stocks. This suggests a weaker coupling between trading dynamics and price formation under the NYSE market structure, over
time horizons above a trading day. Dependence of stock price volatilitysRETon (c) the correlation exponentaITT
1 and (d) the average value of ITT for
the same stocks as in (a). We calculatesRETas the standard deviation of daily logarithmic price returns over month periods, averaging over all
six-month periods throughout the entire record of each stock. Our results show no strong dependence between stock price volatilitysRETand average
level of trading activity, rather the volatility appears sensitive to the strength of the temporal correlations in ITT. These findings suggest that scale-invariant features in transaction times may play an important role in price formation. Furthermore, both dynamic and static properties of stock prices
appear to be influenced by market-specific features in transaction timing: stronger power-law correlations in ITT (higher values ofaITT
1 ) for NASDAQ
stocks are matched by stronger power-law correlations in price fluctuations (higher values ofaj1RETj) and higher volatility (sRET), compared with NYSE
stocks.
larger time scales, thus leading to stronger correlations in intertrade times for the companies on both markets.
Importantly, we also uncover a strong dependence between the scale-invariant features of intertrade times and stock price fluctuations: stocks with stronger correlations in their intertrade times also exhibit stronger correlations in their absolute price returns (Figure 6), indicating an influence of trading activity patterns on the dynamics of price formation. Furthermore, we show that within a trading day absolute price returns, like intertrade times, are more strongly correlated for stocks registered on the NASDAQ market (Figure 6a), and that higher price volatility on the NASDAQ is coupled with stronger correlations in intertrade times (Figure 6c). These findings suggest that market-mediated differences in transaction timing translate into differ-ences in the scaling behavior of stock prices over a broad range of time scales.
Finally, our results do not support the hypothesis of a universal behavior in stock dynamics that is independent of individual company characteristics. In contrast to earlier studies reporting identical scaling exponents for stock price returns, volume and number of trades per unit of time [48–52], our findings show a strong dependance of the scaling behavior of intertrade times on
the market capitalization and the average frequency of trading of individual companies (Figure 2 and Figure 3), as well as on the market structure where the companies are traded. Recent studies [32,53] have also demonstrated that stock price returns and volume do not exhibit universal behavior, but rather depend on market capitalization. Our results show that this universality does not hold also because trading dynamics are strongly influenced by market-specific trading operations and market structure. Our results may have implications for the use of transaction timing patterns in the prediction of prices and risk management on different stock markets. These observations are of interest in the context of the continuing process of optimizing market structure to maintain the efficiency and competitiveness of U.S. stock markets [1].
Author Contributions
Conceived and designed the experiments: PChI AY. Performed the experiments: PChI AY PP. Analyzed the data: PChI AY PP. Contributed reagents/materials/analysis tools: PChI AY PP. Wrote the paper: PChI AY PP.
References
1. Solomon D, Kelly K (2003) Wide SEC review may revamp structure of U.S. stock markets. Wall St Journal. Available: http://wwwwsjcom. 16 Oct 2003. 2. Bogle JC (2003) Specialistman. Wall St Journal. Available: http://wwwwsjcom.
19 Sep 2003.
3. US Securities and Exchange Commission (2004) SEC announces agenda for public hearing on proposed regulation national market system. US Securities and Exchange Commission Press Release. Available: http://wwwsecgov/news/ press/2004-52htm. 15 Apr 2004.
4. Bennett P, Wei L (2003) Market structure, fragmentation and market quality. Working Paper (New York Stock Exchange) 2003–04.
5. Masulis RW, Shivakumar L (2002) Does market structure affect the immediacy of stock price responses to news? Journal of Financial and Quantitative Analysis 37: 617–648.
6. Hasbrouck J, Sofianos G (1993) The trades of market makers: an empirical analysis of Nyse specialists. Journal of Finance 48: 1565–1593.
7. Smith JW, Selway JP, McCormick T (1998) The Nasdaq stock market: historical background and current operation. NASD Working Paper 98–01.
8. Peterson S (2001) Nasdaq comments on sec report on execution quality. NASDAQ Press Release. Available: http://wwwnasdaqnewscom. 8 Jan 2001. 9. Bessembinder H, Kaufman H (1997) A comparison of trade execution cost for
Nyse and Nasdaq-listed stocks. Journal of Financial and Quantitative Analysis 32: 287–311.
10. Weaver DG (2002) Intraday volatility on the Nyse and Nasdaq. Working Paper (New York Stock Exchange) 2002–03.
11. Christie W, Schultz P (1994) Why do Nasdaq market makers avoid odd-eighth quotes? Journal of Finance 49: 1813–1840.
12. Gallant AR, Rossi PE, Tauchen GE (1992) Stock prices and volume. The Review of Financial Studies 5: 199–242.
13. Lillo F, Farmer JD, Mantegna RN (2003) Master curve for price-impact function. Nature 421: 129–130.
14. Hechinger J (2003) Fidelity urges Nyse to revamp trading operation. Wall St Journal. Available: http://wwwwsjcom. 17 Oct 2003.
15. Hasbrouck J (1995) One security, many markets: determining the contributions to price discovery. Journal of Finance 50: 1175–1199.
16. Engle R, Russell J (1998) Autoregressive conditional duration: a new model for irregularly spaced transaction data. Econometrica 66: 1127–1162.
17. Raberto M, Scalas E, Mainardi F (2002) Waiting times and returns in high-frequency financial data: an empirical study. Physica A 314: 749–755. 18. Hausman J, Lo A, Mackinlay C (1992) An ordered probit analysis of transaction
stock prices. Journal of Financial Economics 31: 319–379.
19. Dufour A, Engle R (2000) Time and the price impact of a trade. Journal of Finance 55: 2467–2498.
20. Jiang Z, Chen W, Zhou W (2008) Scaling in the distribution of intertrade durations of Chinese stocks. Physica A: Statistical Mechanics and its Applications 387: 5818–5825.
21. Jiang Z, Chen W, Zhou W (2009) Detrended fluctuation analysis of intertrade durations. Physica A: Statistical Mechanics and its Applications 388: 433–440. 22. Ruan Y, Zhou W (2011) Long-term correlations and multifractal nature in the intertrade durations of a liquid chinese stock and its warrant. Physica A: Statistical Mechanics and its Applications 390: 1646–1654.
23. Jasiak J (1999) Persistence in intertrade durations. Working paper (York University).
24. Ivanov P Ch, Yuen A, Podobnik B, Lee Y (2004) Common scaling patterns in intertrade times of us stocks. Physical Review E 69: 056107.
25. Peng CK, Buldyrev SV, Havlin S, Simons M, Stanley HE, et al. (1994) Mosaic organization of dna nucleotides. Phys Rev E 49: 1685–1689.
26. Taqqu MS, Teverovsky V, Willinger W (1995) Estimators for long-range dependence: an empirical study. Fractals 3: 785–798.
27. Hu K, Ivanov P Ch, Chen Z, Carpena P, Stanley HE (2001) Effect of trends on detrended fluctuation analysis. Phys Rev E 64: 011114.
28. Kantelhardt JW, Koscielny-Bunde E, Rego HHA, Havlin S, Bunde A (2001) Detecting long-range correlations with detrended fluctuation analysis. Physica A 295: 441–454.
29. Ma Q, Bartsch R, Bernaola-Galva´n P, Yoneyama M, Ivanov P Ch (2010) Effect of extreme data loss on long-range correlated and anticorrelated signals quantified by detrended fluctuation analysis. Physical Review E 81: 031101. 30. Chen Z, Hu K, Carpena P, Bernaola-Galvan P, Stanley H, et al. (2005) Effect of
nonlinear filters on detrended fluctuation analysis. Physical Review E 71: 011104.
31. Yuen A, Ivanov P Ch (2005) Impact of stock market structure on intertrade time and price dynamics. Arxiv preprint physics/0508203.
32. Eisler Z, Kertesz J (2006) Size matters: some stylized facts of the stock market revisited. The European Physical Journal B-Condensed Matter and Complex Systems 51: 145–154.
33. Liu Y, Gopikrishnan P, Cizeau P, Meyer M, Peng CK, et al. (1999) Statistical properties of the volatility of price fluctuations. Phys Rev E 60: 1390–1400. 34. Jones C, Kaul G, Lipson M (1994) Transactions, volume and volatility. Review
of Financial Studies 7: 631–651.
35. Dayri K, Bacry E, Muzy J (2011) Econophysics of Order-driven Markets, Springer, chapter The nature of price returns during periods of high market activity. 155–172.
36. Perello´ J, Masoliver J, Kasprzak A, Kutner R (2008) Model for interevent times with long tails and multifractality in human communications: An application to financial trading. Physical Review E 78: 036108.
37. Gontis V, Kaulakys B, Ruseckas J (2008) Trading activity as driven poisson process: comparison with empirical data. Physica A: Statistical Mechanics and its Applications 387: 3891–3896.
38. Politi M, Scalas E (2008) Fitting the empirical distribution of intertrade durations. Physica A: Statistical Mechanics and its Applications 387: 2025–2034. 39. Ghysels E, Gourie´roux C, Jasiak J (1995) Market time and asset price movements theory and estimation. Working Paper 95s-32, Centre for Interuniversity Research and Analysis on Organizations.
40. Mandelbrot BB, Fisher A, Calvet L (1997) A multifractal model of asset returns. Cowles Foundation Discussion Paper 1164, Yale University.
41. Masoliver J, Montero M, Weiss GH (2003) Continuous-time random-walk model for financial distributions. Phys Rev E 67: 021112.
42. Sabatelli L, Keating S, Dudley J, Richmond P (2002) Waiting time distributions in financial markets. Eur Phys J B 27: 273–275.
43. Mainardi F, Raberto M, Gorenflo R, Scalas E (2000) Fractional calculus and continuous-time finance ii: the waiting-time distribution. Physica A 287: 468– 481.
44. Romero N, Ma Q, Liebovitch L, Brown C, Ivanov P Ch (2010) Correlated walks down the babylonian markets. EPL (Europhysics Letters) 90: 18004.
45. Baraba´si A (2005) The origin of bursts and heavy tails in human dynamics. Nature 435: 207–211. barabasi2005origin
46. Va´zquez A, Oliveira J, Dezso¨ Z, Goh K, Kondor I, et al. (2006) Modeling bursts and heavy tails in human dynamics. Physical Review E 73: 036127. 47. Bouchaud J, Farmer J, Lillo F (2009) Handbook of financial markets: dynamics
and evolution, North-Holland: San Diego, chapter How markets slowly digest changes in supply and demand. 57–160.
48. Gopikrishnan P, Plerou V, Gabaix X, Stanley HE (2000) Statistical properties of share volume traded in financial markets. Phys Rev E 62: 4493–4496. 49. Plerou V, Stanley HE (2008) Stock return distributions: Tests of scaling and
universality from three distinct stock markets. Physical Review E 77: 037101.
50. Bonanno G, Lillo F, Mantegna R (2000) Dynamics of the number of trades of financial securities. Physica A 280: 136–141.
51. Gopikrishnan P, Plerou V, Amaral LAN, Meyer M, Stanley HE (1999) Scaling of the distribution of fluctuations of financial market indices. Physical Review E 60: 5305.
52. Plerou V, Gopikrishnan P, Amaral LAN, Gabaix X, Stanley HE (2000) Economic fluctuations and anomalous diffusion. Phys Rev E 62: 3023–3026. 53. Eisler Z, Kertesz J, Yook S, Baraba´si A (2005) Multiscaling and non-universality