ISSN: 2089-3272, DOI: 10.11591/ijeei.v6i1.499 401
An Improved Overlapping Clustering Algorithm to Detect
Outlier
Alvincent E. Danganan1, Ariel M. Sison2, Ruji P. Medina3
1,3Technological Institute of the Philippines, Philippines 2Emilio Aguinaldo College, Philippines
Article Info ABSTRACT
Article history: Received Mei 19, 2018 Revised Sep 6, 2018 Accepted Dec 10, 2018
MCOKE algorithm assigns a data object to multiple clusters and is known for its simplicity and effectiveness. Its drawback is the use of maxdist as a global threshold in assigning objects to one or more cluster because it is sensitive to outliers. Having outliers in the datasets can significantly affect the effectiveness of MCOKE with regards to overlapping clustering. In this paper, the outlier detection MAD is incorporated in MCOKE algorithm so that it can detect and remove outliers that can participate in the assignment of objects to one or more clusters. Experiments demonstrate that the improved MCOKE algorithm with MAD provides better identification of overlapping clustering. The performance of the outlier detection was also evaluated via F1 score performance criterion. Evaluation results revealed that the outlier detection demonstrated higher accuracy rate in identifying outliers when applied to real datasets.
Keyword: Euclidian distance K-means MAD Maxdist MCOKE
Copyright © 2018 Institute of Advanced Engineering and Science. All rights reserved. Corresponding Author:
Alvincent E. Danganan,
Technological Institute of the Philippines,
938 Aurora Blvd. Cubao, Quezon City, Philippines. Email: [email protected]
1. INTRODUCTION
Data mining is the method of extracting patterns from data [1]. Data mining is the most important part of KDD (Knowledge Discovery in Database) process to find meaningful information and discover new patterns from the massive collection of data [2]. In data science, the identification of these patterns is used to mine variety of information which is then used in numerous application [3]. Patient medical information in the field of healthcare is one of the sectors which uses data mining in analyzing data of patients and diagnosis of the diseases.
Data clustering can be considered one of the most important and challenging data mining techniques in the knowledge discovery process. It is a machine learning tool which is widely used to detect hidden structure or to outline the data category in several domains such as biology, system engineering and social sciences [4], [5]. Clustering, as to the unsupervised learning technique, aims to find groups of similar patterns within the same cluster and dissimilar patterns from different cluster [6].
Over the past decades, various data mining tools have been developed. One of such tools is overlapping clustering, where data objects or patterns can belong to one or more clusters. In real networks having complex overlapping community structures, an overlapping community detection algorithm is used to discover overlapping nodes and communities [7]. In a medical domain, studies used overlapping clustering in various diseases which are characterized by complex overlapping symptoms [8]. Several algorithms have been introduced for overlapping clustering, such as Restricted-OKM [9], that generalizes the well-known k-means algorithm to detect overlapping clustering. A study [10] proposed a novel co-clustering framework to discover overlapping groups in social media. Another study called OverCite, which can detect overlapping communities from network citation information [11].
However, one of many challenging issues on overlapping clustering are noise and inconsistent patterns, also known as outlier. An outlier itself is an observation’s result which is significantly different with the majority of observation in a data set [12]. Having outliers in the dataset may result in inaccurate analysis of data that can lead to measurement errors and may potentially decrease the quality of a data analysis task. Identifying outliers in a collection of patterns is a very well-known problem in the data mining field [13]. This is due to the fact that outliers can significantly affect data mining performance [14]. There are various reasons that can induce outlier in the data; some of them are malicious activities like credit card fraud, cyber activity, the breakdown of the system, mechanical faults, changes in system behavior [15].
The problem of outlier detection for data mining is a rich area of research [16] because outliers can be identified in various ways and hence there are different approaches as to addressing such problem. Outlier detection is also termed as anomaly detection, event detection, novelty detection, deviant discovery, change point detection, intrusion detection and fault detection or misuse detection [17].
The MCOKE: Multi-cluster Overlapping K-means Extension is recently introduced as an alternative method of data clustering as well as identifying the overlapping of data [18]. MCOKE algorithm differs from other overlapping algorithms because of its simplicity and easy to use. It uses maximum distance (maxdist) in assigning objects to multiple clusters. However, MCOKE is sensitive to outlier which may affect the result of overlapping objects to multiple clusters.
In this paper, the researchers proposed an outlier detection to improve the performance of MCOKE algorithm by removing outliers that can participate in the calculation used in assigning objects to one or more clusters. The study considered the used of median absolute deviation (MAD) as a tool to detect outliers. MAD is known to be the most robust measures that are easy to use and are not sensitive to outlier. The performance of the proposed outlier detection technique was tested to see if the improved MCOKE algorithm’s accuracy is acceptable.
2. RESEARCH METHOD
2.1. Multi-Cluster Overlapping K-Means Extension
In this section, the original method of MCOKE algorithm is explained before going into details of the proposed method as shown in Figure 1.
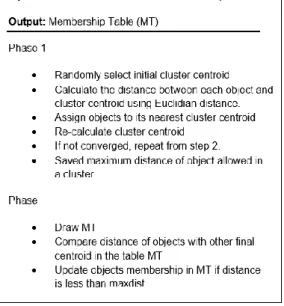
Figure 1. Original MCOKE Algorithm
Multi Cluster Overlapping K-Means Extension (MCOKE) is an overlapping clustering method that has the capability to assign an object to more than one clusters. It uses maximum distance (maxdist) as the global threshold value and it is used to identify objects to a given cluster. The original MCOKE consist of two phases.
a. PHASE 1: Clustering is done with the use of standard k-means which involves distance minimization among objects and the cluster centroid.
b. PHASE 2: A Membership Table (MT) is generated from the initial run of the k-means algorithm. Maxdist (maximum distance of object allowed in a cluster) is used to identify data objects to one or several clusters.
The objective of the k-means clustering algorithm is to minimize the squared error function. Below is the sum of the squared error function (SSE) of k-means [18] defined in (1).
𝐽 = ∑𝑐𝑖=1∑𝑥𝑖∈𝜇𝑖𝑑(𝑥𝑖, 𝑣𝑖 ) (1)
In the first phase, the user determines the number of k clusters, and then the algorithm randomly selects the initial cluster centroid of these clusters. Then, k-means uses the square of the Euclidian distance 𝑑(𝑥𝑖,𝑣𝑖 ) between points 𝑥𝑖 and 𝑣𝑖, where 𝑣𝑖 is the center of cluster 𝑢 𝑖. Since minimizing the distance is
equivalent to minimizing the square of the distance, the objective function 𝐽 will decrease in every iteration until convergence or the assignments of points do not change from one iteration to the next. Then, data objects are assigned to its nearest cluster centroid which result in k clusters. After the initial run of kmeans, maxdist is saved and is used as the global threshold to assign objects to one or more clusters. This maxdist will be used in the second phase of the algorithm.
For the second phase, MT is generated. This MT is consists of vectors of all the data objects assigned to each cluster and their final cluster centroids. Each data object in MT is assigned 1 if a member or 0 if not a member to a cluster. For the multiple assignment steps in MCOKE, iteration is done to calculate the data objects distance within their respective cluster with the other final centroid in the membership table. The calculated distance is compared with the maxdist of the final centroid. If the distance is less than maxdist then that data object is allowed to be a member of that cluster centroid and the membership table is updated with 1 denoting a membership to that cluster.
2.2. Problem Description
MCOKE algorithm provides better belonging of objects to multicluster. However, just like K-means algorithm, it is sensitive to outliers [19].
An outlier are data points that lies far from other data points. Having outliers in a data may mislead the training process of the data mining algorithms, can alter our ability to interpret statistical tests, provide inaccurate output and ultimately result in poorer results.
In MCOKE, if an object exist in isolation MCOKE might choose this object as the maximum distance to a centroid. MCOKE will use this maxdist in assigning objects to multi-cluster, therefore, outliers can participate in the calculation which will eventually lead to inaccurate overlapping clustering output result. Future research involving modification of the original MCOKE to detect outliers is needed [20]. 2.2. Problem Description
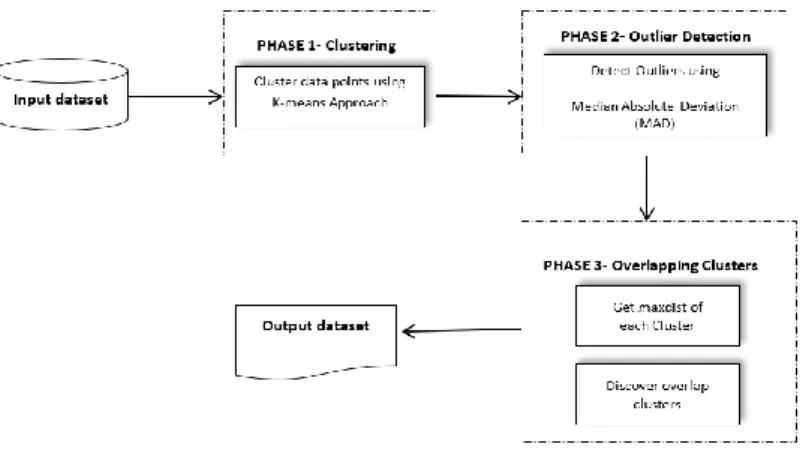
In this section, outliers that can participate in the calculation of object assignment to MCOKE is improved by removing outliers. Outlier detection is incorporated producing additional phase of the original algorithm. Figure 2 illustrates the system architecture of the proposed improvement in MCOKE.
The new method consists of three phases.
a. PHASE 1: The use of a standard k-means algorithm that partition data objects into k clusters.
b. PHASE 2: The outlier discovery, where outliers are removed after clustering of data. The proposed outlier detection method using median absolute deviation was used to measure the decision value that will be used to find outliers.
c. PHASE 3: Overlapping clustering method. A maxdist (maximum distance of object allowed in a cluster) is used as a predictor in assigning a data object to one or several clusters.
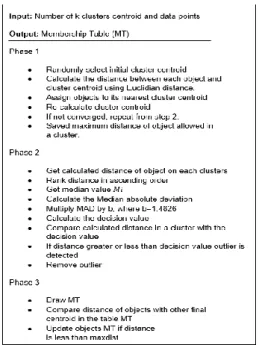
The researchers used MAD to detect outlier and is incorporated in the original MCOKE. The process is discussed in the succeeding section.
From the initial run of k-means, saved distances of data objects allowed on each cluster are collected and ranked in ascending order. To determine the outliers, the first step is to calculate the median value (𝑀𝑖),
where 𝑀𝑖 is the median of the series of distances of data objects. Then, calculate the MAD by subtracting the median from each distance of a data objects. Next, rank the calculated value to ascending order and determine the median of absolute deviation. Then, median will be multiplied by b, where b= 1.4826 a constant linked to the assumption of normality of the data [21]. In (2) shows the MAD formula.
𝑀𝐴𝐷 = 𝑏 𝑀𝑖(|𝑥𝑖− 𝑀𝑗 (𝑥𝑗)|) (2)
After calculating the MAD, the next step is to define a threshold value, this is an indicator or criteria to guide our outlier detection. A study [22] proposed the values of 3, 2.5, and 2 as the threshold value of outlier. Lastly, we calculate the decision value. The decision value is computed by median plus or minus threshold value (+/-2, or 2.5, or 3) times the MAD. All values greater than and smaller than the decision value is considered outliers. Identified outliers are removed from the clusters. In (3) shows the equation to get the equivalent decision value.
𝑀 + 2.5 ∗ 𝑀𝐴𝐷 or 𝑀 − 2.5 ∗ 𝑀𝐴𝐷 (3)
By default, it is recommended that the threshold value of 2.5 is a reasonable choice for outlier detection [23]. This process is iterated to the next cluster and stops when all outliers are removed from the data sets. Figure 3 illustrates the improved MCOKE algorithm with the added outlier detection.
Figure 3. The Improved MCOKE Algorithm
3. Results and Discussions
In this section, experiments were conducted to test the improved algorithm. Two datasets were used, synthetic and real datasets.
3.1. Experiment 1
The first experiment used synthetic datasets. The synthetic datasets are composed of two attributes (Rating, Absences) with 25 instances. Five outliers are purposely added to the sample dataset, so 20 instances are normal, and 5 instances are abnormal data or known also as outliers (Student 21 to Student 25). Table 1 shows the synthetic datasets.
Table 1. Synthetic Experimental Datasets
STUDENT Rating Absences
Student 1 80 3 Student 2 90 2 Student 3 77 3 Student 4 70 5 Student 5 78 3 Student 6 72 6 Student 7 73 7 Student 8 80 3 Student 9 90 2 Student 10 79 4 Student 11 72 7 Student 12 71 6 Student 13 82 2 Student 14 83 2 Student 15 95 1 Student 16 90 1 Student 17 74 6 Student 18 70 8 Student 19 80 7 Student 20 78 6 Student 21 200 5 Student 22 150 10 Student 23 140 6 Student 24 210 7 Student 25 160 9 3.1.1. Phase 1
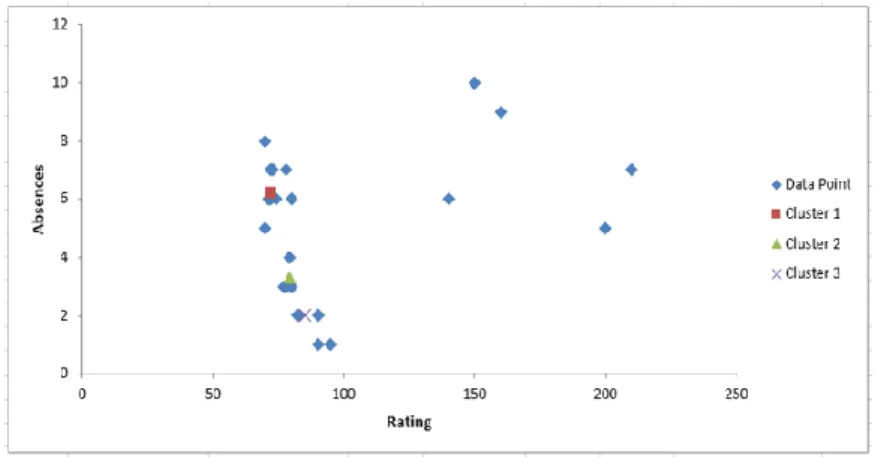
In the first run of the synthetic experimental datasets, the standard k-means algorithm was used to partition a group of objects into several clusters. K was randomly initialized, where K is equivalent to the number of initial cluster centroid where objects are being assigned. The algorithm takes an input of 3 clusters centroid and each object is assigned to its nearest clusters based on its Euclidian distance. Figure 4 shows the visualization of 25 data objects with 3 clusters.
Figure 4. Initial Run of K-means
3.1.2. Phase 2
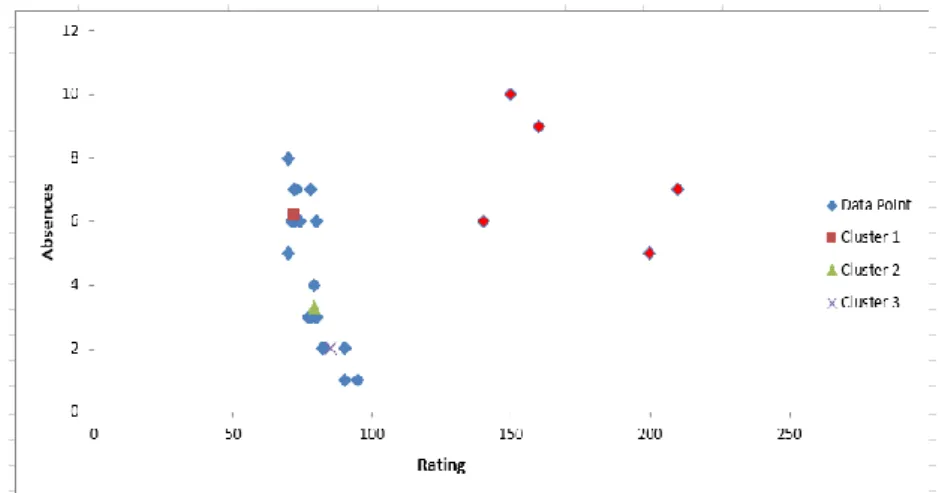
After the initial run of k-means, the proposed median absolute deviation (MAD) was used to find outliers that are present in the dataset. Figure 5 shows the visualization result; the red dots are the outliers found in the datasets identified by MAD.
Several studies stressed the importance of removing outliers to provide more accurate result in datamining thus removing outliers from the dataset is important [24], [25].
The incorporation of MAD as shown in the visualization clearly shows that outliers were correctly identified, thus improving MCOKE. After identification of the outliers, the abnormal data objects were isolated and no longer considered in the assigning of objects to multi-cluster. Figure 6 shows the visualization of datasets removing the outliers detected.
Figure 5. Outlier Sample
Figure 6. Datasets without Outliers
3.1.3. Phase 3
MT are generated for both MCOKE and improved MCOKE. The MT consist of the vectors of all data objects and their final cluster centroids. Each data object in MT is assigned 1 to denote membership to that cluster and 0 for non-membership. The same synthetic datasets were processed and the results of the simulation are presented in Table 2 and 3. Table 2 shows the datasets using the original MCOKE considers the outliers as members of a clusters. Table 3 shows that the improved MCOKE approach which no longer considers the abnormal data (outliers) in the processing of the datasets.
The same synthetic datasets were processed for the identification of overlap clusters. This time, the algorithm compares the distance of data objects assigned on its primary cluster with the other final centroid in the table. The membership table is updated with 1 if the distance of data object is less than maxdist otherwise 0.
As shown in Table 4 below, using the original MCOKE method, there are non-identified overlaps. While in Table 5, the result of the improved method revealed that in the sample datasets, seven (7) out of 20 instances are identified as data objects which overlaps to another cluster.
Table 2. Membership Table with Outliers Table 3. Membership Table without Outliers
Vector Cluster Centeroid C1 C2 C3
80,3 790.3,3.30 0 1 0 90,2 85.2,2 0 0 1 77,3 79.0,3.30 0 1 0 70,5 71.8,6.2 1 0 0 78,3 79.0,3.30 0 1 0 72,6 71.8,6.2 1 0 0 73,7 71.8,6.2 1 0 0 80,3 79.0,3.30 0 1 0 90,2 85.2,2 0 0 1 79,4 79.0,3.30 0 1 0 72,7 71.8,6.2 1 0 0 71,6 71.8,6.2 1 0 0 82,2 85.2,2 0 0 1 83,2 85.2,2 0 0 1 95,1 85.2,2 0 0 1 90,1 85.2,2 0 0 1 74,6 71.8,6.2 1 0 0 70,8 71.8,6.2 1 0 0 80,7 79.0,3.30 0 1 0 78,6 79.0,3.30 0 1 0 200,5 85.2,2 0 0 1 150,10 85.2,2 0 0 1 140,6 85.2,2 0 0 1 210,7 85.2,2 0 0 1 160,9 85.2,2 0 0 1
Vector Cluster Centeroid C1 C2 C3
80,3 790.3,3.30 0 1 0 90,2 85.2,2 0 0 1 77,3 79.0,3.30 0 1 0 70,5 71.8,6.2 1 0 0 78,3 79.0,3.30 0 1 0 72,6 71.8,6.2 1 0 0 73,7 71.8,6.2 1 0 0 80,3 79.0,3.30 0 1 0 90,2 85.2,2 0 0 1 79,4 79.0,3.30 0 1 0 72,7 71.8,6.2 1 0 0 71,6 71.8,6.2 1 0 0 82,2 85.2,2 0 0 1 83,2 85.2,2 0 0 1 95,1 85.2,2 0 0 1 90,1 85.2,2 0 0 1 74,6 71.8,6.2 1 0 0 70,8 71.8,6.2 1 0 0 80,7 79.0,3.30 0 1 0 78,6 79.0,3.30 0 1 0
Table 4. Original MCOKE Overlapping Results
Table 5. Improved MCOKE Overlapping Results
Vector Cluster Centeroid C1 C2 C3
80,3 790.3,3.30 0 0 0 90,2 85.2,2 0 0 0 77,3 79.0,3.30 0 0 0 70,5 71.8,6.2 0 0 0 78,3 79.0,3.30 0 0 0 72,6 71.8,6.2 0 0 0 73,7 71.8,6.2 0 0 0 80,3 79.0,3.30 0 0 0 90,2 85.2,2 0 0 0 79,4 79.0,3.30 0 0 0 72,7 71.8,6.2 0 0 0 71,6 71.8,6.2 0 0 0 82,2 85.2,2 0 0 0 83,2 85.2,2 0 0 0 95,1 85.2,2 0 0 0 90,1 85.2,2 0 0 0 74,6 71.8,6.2 0 0 0 70,8 71.8,6.2 0 0 0 80,7 79.0,3.30 0 0 0 78,6 79.0,3.30 0 0 0 200,5 85.2,2 0 0 0 150,10 85.2,2 0 0 0 140,6 85.2,2 0 0 0 210,7 85.2,2 0 0 0 160,9 85.2,2 0 0 0
Total Overlap Count 0 0 0
Vector Cluster Centeroid C1 C2 C3
80,3 790.3,3.30 0 0 1 90,2 85.2,2 0 0 0 77,3 79.0,3.30 0 0 1 70,5 71.8,6.2 0 0 0 78,3 79.0,3.30 0 0 1 72,6 71.8,6.2 0 0 0 73,7 71.8,6.2 0 0 0 80,3 79.0,3.30 0 0 1 90,2 85.2,2 0 0 0 79,4 79.0,3.30 0 0 1 72,7 71.8,6.2 0 0 0 71,6 71.8,6.2 0 0 0 82,2 85.2,2 0 0 0 83,2 85.2,2 0 0 0 95,1 85.2,2 0 0 0 90,1 85.2,2 0 0 0 74,6 71.8,6.2 0 0 0 70,8 71.8,6.2 0 0 0 80,7 79.0,3.30 0 0 1 78,6 79.0,3.30 0 0 1
Total Overlap Count 0 0 7
Based from the above experiment, incorporating outlier detection in MCOKE algorithm provides better identification of overlapping clustering results while having outliers in the datasets affects the effectiveness of MCOKE in identifying the belonging of objects to multi-clusters.
3.2. Experiment 2
To test the performance of the proposed outlier detection, real datasets were obtained considering IRIS, Diabetes, and Wine datasets [26]. The Iris dataset has 150 observations with 4 variables and 20 are considered outliers. Diabetes datasets have 768 observations with 8 variables and 100 that are treated outliers. For the Wine datasets, 178 observations with 12 variables and 20 that are treated outliers. The researcher compared the accuracy of the proposed outlier detection against LPOD [26], LoOP and LOF methods [27].
For the evaluation of the performance of the outlier detection, detecting outlier accuracy was measured using precision and recall. High precision describes how successful the algorithm returns relevant results than irrelevant ones. High Recall means that the algorithm returns most of the relevant results [28]. In (4) shows the formula for precision and recall.
𝑝𝑟𝑒𝑐𝑖𝑠𝑖𝑜𝑛 = 𝑇𝑃
𝑇𝑃+𝐹𝑃 , 𝑟𝑒𝑐𝑎𝑙𝑙 =
𝑇𝑃
𝑇𝑃+𝐹𝑁 (4)
where:
True Positives (TP) is the correctly predicted positive or yes values (predicted true outliers). False Positives (FP) predicted positive or yes values (predicted true outlier, but it is not). False Negative (FN) predicted negative values (predicted not an outlier, but it is a true outlier).
F-measurement or F1 score that combines precision and recall was also used. F-measurement calculates the weighted harmonic mean of recall and precision [29]. The higher the F-measure the better the detection accuracy, where 0 represents the worst and 1 represents a perfect detection [30]. In (5) defines the calculation of F-measure.
𝐹
1= 2 ∗
𝑝𝑟𝑒𝑐𝑖𝑠𝑖𝑜𝑛 ∗ 𝑟𝑒𝑐𝑎𝑙𝑙
𝑝𝑟𝑒𝑐𝑖𝑠𝑜𝑛 + 𝑟𝑒𝑐𝑎𝑙𝑙 (5)
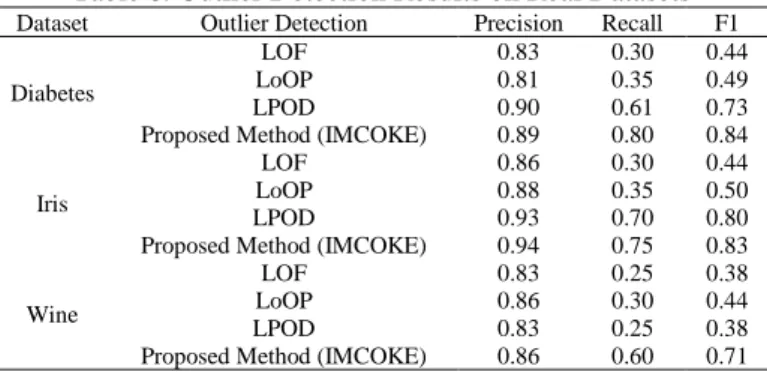
Table 6 shows the result of the performance evaluation of the existing outlier detection algorithms LOF, LoOP, LPOD and the proposed method in terms of its accuracy in identifying outliers on real datasets.
Based from the above results, the proposed outlier detection achieves higher accuracy rate of 84% under Diabetes datasets, which means that the proposed method outrun the existing outlier detection methods. For the Iris datasets, the proposed method obtained the best performance of 83% accuracy which outperformed LOF, LoOP and LPOD. On the wine datasets, the proposed method achieved 71% accuracy rate in identifying outliers, whereas the existing outlier detection were lower than 50%.
Table 6 shows that the proposed outlier detection achieves higher performance accuracy rate in terms of finding outliers on real datasets.
Table 6. Outlier Detection Results on Real Datasets
Dataset Outlier Detection Precision Recall F1
Diabetes
LOF 0.83 0.30 0.44
LoOP 0.81 0.35 0.49
LPOD 0.90 0.61 0.73
Proposed Method (IMCOKE) 0.89 0.80 0.84
Iris
LOF 0.86 0.30 0.44
LoOP 0.88 0.35 0.50
LPOD 0.93 0.70 0.80
Proposed Method (IMCOKE) 0.94 0.75 0.83
Wine
LOF 0.83 0.25 0.38
LoOP 0.86 0.30 0.44
LPOD 0.83 0.25 0.38
Proposed Method (IMCOKE) 0.86 0.60 0.71
4. CONCLUSION
The original MCOKE algorithm is known for its simplicity and effectiveness specifically in the identification of data objects to multi-cluster. However, having outliers in the datasets affects the effectiveness of MCOKE in assigning objects to one or more cluster. In this study, outlier detection is added to the original MCOKE to detect outliers that might be included in the processing of overlap clusters. Based on the experimental results, the proposed outlier detection improved the performance of MCOKE in the identification of data objects to multi-cluster. Furthermore, F1 score performance criterion using median absolute deviation as the proposed outlier detection method demonstrated higher outlier detection accuracy rate compared to LOF, LoOP, and LPOD methods.
Since MCOKE still uses K-means, it is still sensitive to the random initialization of the clusters center. An alternative approach to the random initialization is recommended. Another issue of the algorithm is its discovery of overlapping clusters. The proper way of assigning objects to one or more clusters should not focus only on the distance of objects and centroid of the clusters. Modification of the algorithm to include additional parameters aside from distance of objects and centroid of the clusters can be considered for future works.
REFERENCES
[1] S. Vijayarani and S. Nithya, “An efficient clustering algorithm for outlier detection,” Int. J. Comput. Appl., vol. 32, no. 7, pp. 22–27, 2011.
[2] P. Kaur and K. Kaur, “A Review on Outlier Detection for Data Cleaning in Data Mining,” Int. J. Innov. Res. Comput. Commun. Eng., vol. 4, no. 7, pp. 14373–14376, 2016.
[3] C. Virmani, A. Pillai, and D. Juneja, “Clustering in Aggregated User Profiles across Multiple Social Networks,” Int. J. Electr. Comput. Eng., vol. 7, no. 6, pp. 3692–3699, 2017.
[4] M. Alaqtash, M. A. Fadhil, and A. F. Al-azzawi, “A Modified Overlapping Partitioning Clustering Algorithm for Categorical Data Clustering,” Bull. Electr. Eng. Informatics, vol. 7, no. 1, 2018.
[5] A. Bedboudi, C. Bouras, and M. T. Kimour, “An Heterogeneous Population-Based Genetic Algorithm for Data Clustering,” Indones. J. Electr. Eng. Informatics, vol. 5, no. 3, pp. 275–284, 2017.
[6] A. Daneshgar, R. Javadi, and S. B. Shariat Razavi, “Clustering and outlier detection using isoperimetric number of trees,” Pattern Recognit., vol. 46, no. 12, pp. 3371–3382, 2013.
[7] Z. Ding, X. Zhang, D. Sun, and B. Luo, “Overlapping Community Detection based on Network Decomposition,” Nat. Publ. Gr., no. April, pp. 1–11, 2016.
[8] S. Khanmohammadi, N. Adibeig, and S. Shanehbandy, “An improved overlapping k-means clustering method for medical applications,” Expert Syst. Appl., vol. 67, pp. 12–18, 2017.
[9] C.-E. Ben N’Cir, G. Cleuziou, and N. Essoussi, “Identification of non-disjoint clusters with small and parameterizable overlaps,” in 2013 International Conference on Computer Applications Technology (ICCAT), 2013, pp. 1–6.
[10] H. Wang, X. Tang, L. Gao, H. Liu, “Discovering Overlapping Groups in Social Media,” in Proceedings of the 2010 IEEE International Conference on Data Mining, ICDM ’10, 2010, p. pages 569–578.
[11] T. Chakraborty and A. Chakraborty, “OverCite: Finding Overlapping Communities in Citation Network,” in Proceedings of the 2013 IEEE/ACM International Conference on Advances in Social Networks Analysis and Mining - ASONAM ’13, 2013, pp. 1124–1131.
[12] B. S. Budi and B. P. Statitik, “Outlier Detection Framework for Extreme Fluctuation Time Series Data,” in Proceedings 2nd ISI Regional Statistics Conference Indonesia (Session CPS15), 2017, no. March 2017.
[13] B. K. Patra, “Using the Triangle Inequality to Accelerate Density based Outlier Detection Method,” Int. Conf. Commun. Comput. Secur., vol. 6, no. 0, pp. 469–474, 2012.
[14] V. R. Patel and R. G. Mehta, “Impact of outlier removal and normalization approach in modified k-means clustering algorithm,” IJCSI Int. J. Comput. Sci. Issues, vol. 8, no. 5, pp. 331–336, 2011.
[15] K. Kaur and G. Atul, “Comparative Study of Outlier Detection Algorithms,” Int. J. Comput. Appl., vol. 147, no. 9, pp. 440–453, 2009.
[16] V. Deneshkumar, K. Senthamaraikannan, and M. Manikandan, “Identification of Outliers in Medical Diagnostic System Using Data Mining Techniques,” Int. J. Stat. Appl., vol. 4, no. 6, pp. 241–248, 2014.
[17] A. Christy, G. M. Gandhi, and S. Vaithyasubramanian, “Cluster Based Outlier Detection Algorithm for Healthcare Data,” Procedia Comput. Sci., vol. 50, no. December, pp. 209–215, 2015.
[18] S. Baadel, F. Thabtah, and J. Lu, “MCOKE : Multi-Cluster Overlapping K-Means Extension Algorithm,” Int. J. Comput. Electr. Autom. Control Inf. Eng., vol. 9, no. 2, pp. 427–430, 2015.
[19] S. Chawla and A. Gionis, “k -means–: A unified approach to clustering and outlier detection,” Proc. 2013 SIAM Int. Conf. Data Min., pp. 189–197, 2013.
[20] S. Baadel, F. Thabtah, and J. Lu, “Overlapping clustering: A review,” Proc. 2016 SAI Comput. Conf. SAI 2016, pp. 233–237, 2016.
[21] P. J. Rousseeuw and C. Croux, “Alternatives to the median absolute deviation,” J. Am. Stat. Assoc., vol. 88, no. 424, pp. 1273–1283, 1993.
[22] J. Miller, “Short Report : Reaction Time Analysis with Outlier Exclusion : Bias Varies with Sample Size,” Q. J. Exp. Psychol., no. 4, pp. 907–912, 1991.
[23] C. Leys, C. Ley, O. Klein, P. Bernard, and L. Licata, “Detecting outliers: Do not use standard deviation around the mean, use absolute deviation around the median,” J. Exp. Soc. Psychol., vol. 49, no. 4, pp. 764–766, 2013.
[24] A. B. Deb and L. Dey, “Outlier Detection and Removal Algorithm in K-Means and Hierarchical Clustering,” World J. Comput. Appl. Technol., vol. 5, no. 2, pp. 24–29, 2017.
[25] P. K. Sharma, H. Haleem, and T. Ahmad, “Improving Classification by Outlier Detection and Removal,” in 49th Annual Convention of the Computer Society of India CSI, 2015, no. December 2014.
[26] H. Liu, X. Li, J. Li, and S. Zhang, “Efficient Outlier Detection for High-Dimensional Data,” IEEE Trans. Syst. Man, Cybern. Syst., pp. 1–11, 2017.
[27] M. Goldstein and S. Uchida, “A Comparative Evaluation of Unsupervised Anomaly Detection Algorithms for Multivariate Data,” PLoS One, pp. 1–31, 2016.
[28] H. Jawed, Z. Ziad, M. M. Khan, and M. Asrar, “Anomaly detection through keystroke and tap dynamics implemented via machine learning algorithms,” Turk J Elec Eng Comp Sci, pp. 1698–1709, 2018.
[29] C. Fayet and D. Lolive, “Unsupervised Classification of Speaker Profiles as a Point Anomaly Detection Task,” in Proceeding of Machine Learning Research, 2017, pp. 152–163.
[30] K. Limthong, “Real-Time Computer Network Anomaly Detection Using Machine Learning Techniques,” J. Adv. Comput. Networks, vol. 1, no. 1, pp. 1–5, 2013.