International Journal of Business and Management Science, 1(2): 129-145, 2008 129
Research
Paper
Received 31 March’08/ Accepted 02 Oct’08 SAFA = 0.58The Strategic Supplier Partnership in a Supply
Chain Management with Quality and Business
Performance
♣
Keywords: Malaysian Manufacturing industries, structural equation modeling, cluster analysis
Arawati Agus
aand Za’faran Hassan
baGraduate School of Business, Universiti Kebangsaan Malaysia, Malaysia bFaculty of Business Management, Universiti Teknologi MARA, Malaysia
Abstract: The study investigates the association of strategic supplier partnership (SSP) in supply chain management (SCM) with product quality performance and business performance in the Malaysian manufacturing industries. In the inferential process, relationships between strategic supplier partnership practice, product quality performance and business performance and associations are analyzed using Pearson’s correlation, cluster analysis and structural equation modeling (SEM). The findings suggest that strategic supplier partnership practice and implementation have significant associations with product quality performance and business performance. The results of the study will be of particular interest to practicing production managers or top level managers for learning about the factors stimulating the adoption of strategic supplier partnership in SCM.
INTRODUCTION
Over the last decades, Malaysian manufacturing companies have embraced a wide variety of management programs to improve product value and to enhance business performance. In addition, the increase of competition, global economy and the business challenges have made many Malaysian manufacturing
International Journal of Business and Management Science, 1(2): 129-145, 2008 130 companies to integrate diverse competitive strategies into the operation system. Due to intense business competition in the global arena, manufacturing companies need to increase their strategic competitiveness. These manufacturing companies can no longer be satisfied with only one traditional competitive advantage which they could have relied on previously. At present they have to create multiple possible niches to become more competitive and productive. An area that the manufacturing companies can focus on is the enhancement of their supply chain management (SCM) to optimize their outcomes. Interestingly, several researchers have suggested that the understanding and practicing of SCM is an essential prerequisite for staying competitive in the global race and for enhancing profitability (Li, Ragu-Nathan, Ragu-Nathan, and Rao, 2006; Wei,
Liang and Wang, 2007; Kim, 2007; Li and Wang, 2007). Cagliano, Caniato, and
Spina (2006) highlighted that a huge number of contributions to the operation
management literature are now focused on how companies should integrate their activities with customers and suppliers, and how SCM practices should be aligned with the company strategy. Many organizations have begun to recognize that SCM is the key to building sustainable competitive edge for their products and services in an increasingly competitive marketplace today (Maheswari,
Kumar, and Kumar,2006; Li and Wang, 2007).
Supply Chain Management (SCM) is one of the most popular management concepts to impact the business and the logistics concept in the 1990s. The Problems relevant to the concept of SCM include (1) the lack of research on what it means to practice SCM, (2) how to implement a SCM program, and (3) how to measure the performance of a supply chain. Many definitions for the supply chain have been offered in the literature (Harrington, 1995; Davis, 1993;
Hammel and Kopczak, 1993; Stevens, 1989). These definitions are too limited in
their scope because they imply that the supply chain focuses on just manufacturing or logistics processes. Because this research examines the supply chain as an enterprise-to-enterprise model, the following definition for the supply chain is used: An integrated collection of organizations that manage information, product, and cash flows from a point of origin to a point of consumption with the goals of maximizing consumption satisfaction while minimizing the total costs of the organizations involved (Caplice and Sheffi,
1994).
A different set of metrics that capture all aspects of the supply chain must be developed. Caplice and Sheffi (1994) state that measures used to capture the performance of a transformational process fall into one of three primary dimensions: utilization, productivity, and effectiveness. A consortium of companies and academic institutions, under the guidance of Pittiglio, Rabin,
International Journal of Business and Management Science, 1(2): 129-145, 2008 131 supply chain metrics that can be used as standards and can pass assessment using the eight criteria stated above. These measures fall into one of four categories: customer satisfaction/quality, time, costs, and assets.
Research has indicated that the firms that use a supply chain strategy might use different types of performance metrics than the firms that do not utilize the concept of supply chain (Chow, Heaver, and Henriksson, 1994). No research was found indicating whether the firms believed their measures for evaluating performance are effective, regardless of SCM implementation.
The strategic supplier partnership identifies optimum practices that can facilitate supply chain process alignment and integration. In order to further expedite collaboration, it is necessary to implement the latest collaborative information systems that drive efficiencies, performance, and quality throughout a supply chain (Robinson and Malhotra, 2005). Several researchers suggest that effective SCM practice has a direct impact on the overall financial and marketing performance of an organization (Shin, Collier and Wilson, 2000;
Prasad and Tata, 2000). In fact, SCM practice is expected to increase an
organization’s market share, return on investment (Shin et al., 2000; Prasad and
Tata, 2000), and improve overall competitive position (Stanley and Wisner,
2001). Sila, Ebrahimpour and Birkholz (2006) points that in order to achieve
high performance in SCM; companies need to integrate their supply chain partners into their operations. Yet very few studies have examined empirically the role of strategic supply partnership in the supply chain management process, as well as its linkage to a firm’s performance.
This paper will review the literature on supply chain management as well as supplier partnership. A model will then be determined for analyzing these two key variables and their linkage to a firm’s quality and business performance. At the end the Malaysian Strategic Supplier Partnership Index (MSSPI) is calculated in the context of product quality performance and business performance to explore the level of strategic supplier partnership.
LITERATURE REVIEW
Supply chain partnership is defined as a strategic coalition of two or more firms in a supply chain to facilitate joint effort and collaboration in one or more core value creating activities such as research, product development, manufacturing, marketing, sales, and distribution. The objective of supply chain partnership is increasing benefits to all partners by reducing total cost of acquisition, possession, and disposal of goods and services (Maheshwari et al., 2006; Li et
al., 2006). Supply chain partnership is designed to influence the strategic and
operational capabilities of individual participating organizations to help them achieve significant ongoing benefits (Stuart, 1997). Strategic partnership with
International Journal of Business and Management Science, 1(2): 129-145, 2008 132 suppliers enables organizations to work more effectively with a few important suppliers who are willing to share responsibility for the success of the products
(Anderson and Katz, 1998; Li et al., 2006). Strategic supplier partnership in
SCM has been reported to yield organization-specific benefits in term of financial performance (Tsai, 2007). Vereecke and Muylee (2006) highlighted that strategic partnerships between suppliers and manufacturers have a significant impact on supply chain performance and various aspects of competitive advantage.
Supply chain partnership in the supply chain management is one of the most popular hybrid organizational forms. It has been increasingly adopted by firms to manage inter-organizational collaboration in the supply chain. Supply chain partnerships provide both large and small firms with numerous opportunities to improve their conduct of business such as wider diffusion of products without costly physical presence in the markets, risk and reward sharing, resource pooling, reduction in coordination and transaction costs, ability to concentrate on core competency, and rapid response to market needs (Spekman, Kamauff and
Myhr, 1998). Li et al. (2006) emphasize that the departments and functions in
partnering companies need to work with each other in evaluating inventories, systems, processes, training, work methodologies, equipment utilization, and a host of other opportunities to reduce the cost of operations and explore opportunities for the partnerships.
Supply chain partnerships are resource-intensive investments, which involve both financial and strategic risks (Maheshwari et al., 2006; Wang, Rivera and
Kempf, 2007). Kotabe, Martin and Domoto (2003) points out that involving
suppliers extensively in SCM, organizations could gain more production flexibility, faster product development cycles, lower input costs and higher end-product quality in order to gain greater market share and premium prices.
METHODOLOGY
This section describes the instrumentation, model formulation and sampling method utilized in this study. Validity and reliability of the constructs are also discussed.
Validity and Reliability of the Constructs
The instrument used in this study was a structured survey questionnaire. The questionnaire consisted of two major parts. The first part comprised several constructs measuring strategic supplier partnership practices. To enable respondents to indicate their answers, seven–point Likert interval scales were used for the of strategic supplier partnership dimensions. The strategic supplier partnership determinants in this study were adopted from prominent studies
International Journal of Business and Management Science, 1(2): 129-145, 2008 133
(Gunasekaran, Patel and Mcgaughey, 2003; Kuei, Madu and Lin, 2001; Li, Rao,
Ragu-Nathan and Ragu-Nathan, 2005; Vickery, Calantone and Droge, 1999).
The strategic supplier partnership construct was operationalized based upon five different kinds of activities that manufacturers commonly use to integrate their operations with suppliers namely ‘Emphasis on high quality’, ‘Long term relationships with suppliers’, ‘Jointly problem solving with suppliers’, ‘Continuous improvement programs with suppliers’ and ‘Planning and goal setting with suppliers’. In the initial data analysis, the five strategic supplier partnership determinants were subjected to validity and reliability tests. Before creating the final scales, the data were checked for normality and outliers.
The second part of the questionnaire comprised several performance measurements. Several studies have identified performance improvement constructs that are commonly associated with strategic supplier partnership in SCM (Voss, 1988; Gunasekaran et al., 2003; Kuei et al., 2001; Cox, 1999). Voss
(1988) classified performance measures into three groups: market place
competitive advantage, productivity increases, and non-productivity benefits. Marketplace success involved longer-term competitive gains including increased market share and greater profitability. Productivity gains came from decreased labor costs and increased throughput. Non-productivity benefits included quality improvement and lead-time reductions. This study divided the firm’s performance into two types: 1) Product Quality Performance and 2) Business Performance. Similarly, the dependent variables namely product quality performance and business performance also used a seven-point interval scale, representing a range of agreement on statement whether over the past three years these performances are high relative to competitors after implementing strategic supplier partnership in SCM practices.
Validity and reliability tests were conducted to select and assess the final items of the independent constructs that would be used for statistical testing (Refer to Table 1). Content validity represents the sufficiency with which a specific domain of content (construct) was sampled (Nunnally, 1978; Ahire,
Golhar and Waller, 1996). Content validity is subjective and judgmental but is
often based on two standards put forward by Nunnally: does the instrument contain a representative set of measures, and were sensible methods of scale construction used (Flynn, Sakakibara, Schroeder, Bates and Flynn, 1990). The critical variables of supply chain management in this study had content validity because an extensive review of the literature was conducted in selecting the measurement items. Divergent or discriminant validity was tested by analyzing bivariate correlations between each of the strategic supplier partnership scales and other variables such as demographic variables and company size.
Confirmatory factor analysis (CFA) or a measurement model using AMOS 5 was employed for examining construct validity of each scale by assessing how well the individual item measured the construct (Ahire et al., 1996). Specifically, confirmatory factor analysis was used to detect the unidimensionality of each
International Journal of Business and Management Science, 1(2): 129-145, 2008 134 construct. Unidimensionality is evidence that a single trait or construct underlie a set of measures (Hair, Anderson, Tatham and Black, 1998). The measurement model for each construct was treated as a single factor congeneric model with error variances and estimated regression weights. According to Motwani,
Kumar, Youssef, and Mahmoud (1997) in order to establish the construct
validity of the measure, it is crucial to determine (1) the extent to which the measure correlates with other measures designed to measure the same thing and (2) whether the measure behaves as expected. The goodness of fit index (GFI) and comparative fit index (CFI) of the three constructs calculated from CFA exceeded the 0.90 criterion suggested by Hair et al. (1998), hence, establishing the construct validity. CFA showed all the items were loaded highly on their corresponding constructs, which supported the independence of the constructs and provided strong empirical evidence of their validity.
Table 1: The findings of the reliability test on ‘strategic supplier partnership’, ‘product quality performance’ and ‘business performance scales’ Constructs No. of
Items Mean Deviation Standard Reliability (CFA) GFI (CFA) CFI Strategic Supplier Partnership 5 5.18 1.03 0.85 0.940 0.943 Product Quality Performance 4 5.37 0.99 0.95 0.990 0.999 Business Performance 4 4.68 1.06 0.90 0.998 0.999 The reliability analysis was conducted by calculating the Cronbach’s alpha for the main construct. The items that did not significantly contribute to the reliability were eliminated for parsimony purpose. The result shows that the Cronbach’s alpha measures for the three constructs exceeds the threshold point of 0.70 suggested by Nunnally (1978). The alpha coefficients for strategic supplier partnership determinants, product quality performance and business performance measures range between 0.889 and 0.950 after the alpha maximization process were carried out (Table 1). As a result, 13 items were retained for the three constructs.
Model Formulation
This study explores relationships among strategic supplier partnership (SSP) in supply chain management (SCM), product quality performance and business performance within the context of the Malaysian manufacturing industry. The proposed model, as depicted in Figure 1, is based on three main constructs - (i) strategic supplier partnership in SCM (SSP); (ii) product quality performance (PQP); and (iii) business performance (BPERF). Essentially, strategic supplier partnership in SCM represents a manager’s assessment of the overall level of
International Journal of Business and Management Science, 1(2): 129-145, 2008 135 strategic supplier partnership practices in supply chain management (Vickery et
al., 1999). In addition to improving levels of performance (Li et al., 2006),
strategic supplier partnership in SCM has also been shown to provide benefits in terms of product quality performance, market share, return on assets (ROA), return on sales (ROS) and profitability (Buzzell and Gale, 1987). The model proposed here uses strategic supplier partnership dimensions derived from studies and documented references. Five dimensions of strategic supplier partnership in SCM identified from several sources (Kuei et al., 2001; Li et al.,
2006; Vickery et al., 1999) were considered to relate to distinctive features of
strategic supplier partnership in SCM and are, therefore, incorporated in the present conceptual model. These strategic supplier partnership dimensions include: ‘Emphasis on high quality’- (B1SSP2), ‘Long term relationships with suppliers’- (B1SSP4), ‘Jointly problem solving with suppliers’ - (B1SSP5), ‘Continuous improvement programs with suppliers’ - (B1SSP6) and ‘Planning and goal setting with suppliers’ - (B1SSP7).
Meanwhile, product quality performance are based on four pertinent product quality dimensions namely product conformance (conform), product performance (perform), product reliability (reliable) and product durability (durable) (Kotler, 1994; McGaughey, 1991; Pascucci, 1998). Lastly business performances in this study are derived from four important business performance measurements comprising of profitability (profit), market share (mktsh), return on sale (ROS) and return on asset (ROA).
Figure 1: The conceptual framework linking strategic supplier partnership, product quality performance and business performance
Strategic Supplier Partnerships (SSP) Business Performance (BPERF Product Quality Performance (PQP) PROFITABILITY (PROFIT) MARKET SHARE (MKTSH) Our company emphasizes
on high quality suppliers (B1SSP2)
Our company establishes a long term relationships
with suppliers on high quality suppliers
(B1SSP4)
Our company establishes jointly problem solving
with suppliers (B1SSP5) PRODUCT CONFORMANCE (CONFORM) PRODUCT PERFORMANCE (PERFORM) PRODUCT RELIABILITY (RELIABLE) RETURN ON SALES (ROS) Our company involves in
continuous improvement programs with suppliers
(B1SSP6)
Our company involves in planning and goal setting with suppliers
(B1SSP7) PRODUCT FEATURES (FEATURE) PRODUCT (DURABLE) RETURN ON ASSET (ROA)
International Journal of Business and Management Science, 1(2): 129-145, 2008 136
Sampling Method
The samples (companies) were chosen from the manufacturing companies (non-food based) in Malaysia. The sampling frame was based on the Federation of Malaysian Manufacturers Directory (FMM). The manufacturing sector was chosen for the study because this industry has emerged as one of the leading sectors in Malaysia in terms of adopting new manufacturing programs and strategic supplier partnership practices in SCM. Moreover, these efforts are driven primarily by competitive rather than regulatory forces. One hundred and ten responses were received and were analyzed using the SPSS package. The primary purpose of the research was to measure senior quality managers’ or production managers’ perception of strategic supplier partnership practice in SCM and to gain insight into the benefits of implementing strategic supplier partnership in the manufacturing industry. The goal is to understand and identify determinants of strategic supplier partnership in SCM that can enhance product quality performance and bottom line result (profitability, market share, return on sale and return on asset). Face to face interviews with production managers were carried out to crosscheck the information collected, validate the outcome of analysis and developed an understanding of practical aspects of strategic supplier partnership principles and adoption. Given the scarcity of SCM studies in Malaysia that specifically examines associations between strategic supplier partnership practice and performances.
Hypotheses of the Study
The researchers believe the notion that strategic supplier partnership determinants have positive influences on the bottom line results such as product quality performance and business performance. A structural model is used in this study to analyze the structural effect of strategic supplier partnership in SCM on performance results. This study intends to investigate whether strategic supplier partnership in SCM has significant impact on product quality performance. Therefore, the first hypothesis proposes that implementing an effective strategic supplier partnership in SCM program enhances product quality performance. The second hypothesis states that strategic supplier partnership improves business performance. This study not only tries to investigate whether strategic supplier partnership can lead to higher product quality performance but also in turn would result in higher business performance. Hence, this study tests (third hypothesis) whether there is a direct effect of product quality performance on business performance. In short, the following hypotheses are postulated:
1
H : Strategic supplier partnership in SCM has a structural effect on product quality performance.
International Journal of Business and Management Science, 1(2): 129-145, 2008 137 2
H : Strategic supplier partnership in SCM has a structural effect on business performance.
3
H : Product quality performance has a structural effect on business performance.
In investigating the structural effect of strategic supplier partnership in SCM on overall results such as product quality performance and business performance, it is also pertinent to determine the structural loadings of each strategic supplier partnership determinant. Additionally, this study also attempts to test the following hypotheses:
A
H1 : ‘Emphasis on high quality suppliers’ has a structural loading on strategic supplier partnership in implementing SCM.
B
H1 ‘Long term relationships with suppliers’ has structural loading on strategic supplier partnership in implementing SCM.
C
H1 : ‘Jointly problem solving with suppliers’ has a structural loading on strategic supplier partnership in implementing SCM.
D
H1 : ‘Continuous improvement programs with suppliers’ has a structural loading on strategic supplier partnership in implementing SCM. E
H1 : ‘Planning and goal setting with suppliers’ has a structural loading on strategic supplier partnership in implementing SCM.
RESULTS AND DISCUSSION
The empirical findings are obtained by carrying out parametric data analysis. The parametric analyses include (a) Pearson’s correlations between Strategic Supplier Partnership, SSP determinants and performances, (b) cluster analysis and Friedman test, and (c) Structural equation modeling (SEM). The SEM result suggests that strategic supplier partnership is able to enhance product quality performance and ultimately improve business performance.
Correlation and Cluster Analysis
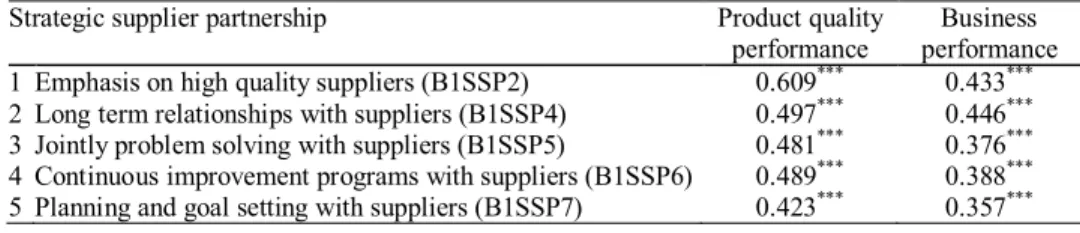
Table 2 reveals Pearson’s correlations between strategic supplier partnership in SCM practices and product quality performance as well as business performance. Product quality performance indicator has high correlations with ‘Emphasis on high quality suppliers (r = 0.609), ‘Long term relationships with suppliers’ (r = 0.497), ‘Continuous improvement programs with suppliers’ (r = 0.489) and followed by ‘Jointly problem solving with suppliers’ and ‘Planning and goal setting with suppliers’. Business performance indicator has high
International Journal of Business and Management Science, 1(2): 129-145, 2008 138 correlations with ‘Long term relationship with suppliers’ (r = 0.446), ‘Emphasis on high quality suppliers’ (r = 0.433) and ‘Continuous improvement programs with suppliers’ (r = 0.388). These findings are consistent with several previous studies that proclaimed better organizational transformations as a result of strategic supplier partnership in SCM initiatives (Kuei et al., 2001; Li et al.,
2006; Vickery et al., 1999).
Table 2: Pearson’s correlation between strategic supplier partnerships in SCM, product quality performance and business performance
Strategic supplier partnership Product quality
performance performance Business 1 Emphasis on high quality suppliers (B1SSP2) 0.609*** 0.433*** 2 Long term relationships with suppliers (B1SSP4) 0.497*** 0.446*** 3 Jointly problem solving with suppliers (B1SSP5) 0.481*** 0.376*** 4 Continuous improvement programs with suppliers (B1SSP6) 0.489*** 0.388*** 5 Planning and goal setting with suppliers (B1SSP7) 0.423*** 0.357*** Note: ***Significant at 1 percent (All t-tests are one-tailed)
To further explore on the segmentation of manufacturing companies in this study, a cluster analysis was carried out. Since business performance is a very importance bottom-line outcome, therefore the classification is based on average business performance clustering. The result from cluster analysis statistically segmented the manufacturing companies into two clusters based on business performance namely “High business performance companies” and “Low business performance companies”.
The first cluster (‘High business performance companies’) comprises of large-scaled companies with average employees of more than 1,200 people and average approximated sales turnover of more than RM 1.5 billion. Mean while, the second cluster (‘Low business performance companies’) consists of smaller companies with average employees less than 600 and average approximated sales turnover less than RM 80 million. It can be inferred from the findings of the Friedman rank test that higher level of strategic supplier partnership is more realized in ‘High business performance companies’ than ‘Low business performance companies’. This first cluster places high priority on ‘Emphasis on high quality suppliers’, ‘Long term relationships with suppliers’ and ‘Jointly problem solving with suppliers’. This result indicates the importance for manufacturing companies not only to develop close relationship with major suppliers but also to select suppliers based on quality not cost. Table 3 highlights further information about these clusters.
International Journal of Business and Management Science, 1(2): 129-145, 2008 139
Table 3: Rankings of strategic supplier partnership determinants based on business performance clustering using Friedman’s Rank Test
Strategic supplier partnership practices
High business performance (n=55, chi-square = 50.486***, overall cluster’s mean = 5.632)
Low business performance (n=65, chi-square = 70.50***, overall cluster’s mean = 4.229) Friedman’s
Test Rank Mean Standard Deviation Friedman’s Test Rank Mean Standard Deviation Emphasis on High quality suppliers (B1SSP2) 3.89 1 6.364 0.910 3.69 1 5.229 1.169 Long term relationships with suppliers (B1SSP4) 3.18 2 6.036 0.793 3.66 2 5.186 1.081 Jointly problem solving with suppliers (B1SSP5) 2.88 3 5.782 1.013 2.91 3 4.571 1.234 Continuous improvement programs with suppliers (B1SSP6) 2.81 4 5.636 1.379 2.62 4 4.329 1.293 Planning and goal
setting with
suppliers (B1SSP7) 2.24 5 5.073 1.562 2.11 5 3.986 1.357
Note: ***Significant at 1 percent
Findings of the Structural Equation Modeling
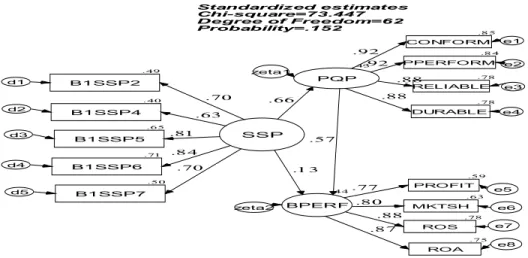
The association between strategic supplier partnership practices and performances was further investigated using structural equation modeling (SEM). A structural model can be viewed as simultaneous linkages that allow a researcher to determine the relative strength of relationships between variables. Relationships between strategic supplier partnership practices, product quality performance and business performance are depicted in the structural equation modeling (Figure 2). The model is assumed to fit the data; therefore, the acceptance of the null hypothesis of the overall model is expected. Hence, in the test of goodness of fit for the SEM, the probability should be higher than 0.05. The findings of SEM model indicate that the resulting Chi-square value is 73.447 with 62 degrees of freedom and p-value of 0.152 (Figure 2). This supports the null hypothesis that the revised model has a good fit (H0). The
p-value is considerably substantial (p-p-value > 0.05), in supporting the proposition that the overall model fits the data.
In addition, other statistical structural indices such as Bentler comparative fit model CFI (0.989), Bollen Incremental Fit Index IFI (0.989) and Tucker and Lewis Index TLI (0.986) further suggest that the model has a satisfactory fit (Table 4). Since the probability value and structural modeling indices are well
International Journal of Business and Management Science, 1(2): 129-145, 2008 140 above the recommended level, the model is considered to be a reasonable representation of the data (Hair et al., 1998). The direct structural effect of strategic supplier partnership on product quality performance is 0.657 and the indirect effect on business performance through product quality performance is 0.570 which is considered quite high given the complex causal linkages. However, the direct effect of strategic supplier partnership on business performance is not significant (0.13). Nonetheless, the findings demonstrate the importance of strategic supplier partnership practices especially ‘Continuous improvement programs with suppliers’, ‘Jointly problem solving with suppliers’, ‘Planning and goal setting with suppliers’ and ‘Emphasis on high quality suppliers’, in improving product quality and business performance in Malaysian manufacturing industry. Therefore, we have enough evidence to accept the proposition that strategic supplier partnership in SCM has positive and significant structural effect on product quality performance (H1). In addition,
product quality performance has a positive structural effect on business performance (H3).
Figure 2: The structural model showing the structural linkage between strategic supplier partnership in SCM, product quality performance and business performance.
Using SEM, the researchers investigate the impact of strategic supplier partnership on product quality performance and business performance simultaneously. In addition, SEM is able to measure the magnitude and contribution between those constructs. The results of SEM suggest that strategic supplier partnership in SCM is able to enhance product quality performance and
SSP Standardized estimates Chi-square=73.447 Degree of Freedom=62 Probability=.152 .49 B1SSP2 d1 .44 BPERF zeta2 .43 PQP zeta1 .59 PROFIT e5 .63 MKTSH e6 .40 B1SSP4 d2 .65 B1SSP5 d3 .71 B1SSP6 d4 File:SCM -110 .85 CONFORM e1 .84 PPERFORM e2 .78 RELIABLE e3 .78 DURABLE e4 .78 ROS e7 .84 .81 .63 .70 .88 .80 .13 .88 .88 .92 .92 .66 .75 ROA e8 .50 B1SSP7 d5 .70 .57 .87 .77
International Journal of Business and Management Science, 1(2): 129-145, 2008 141 ultimately improve business performance (indirectly through product quality performance).
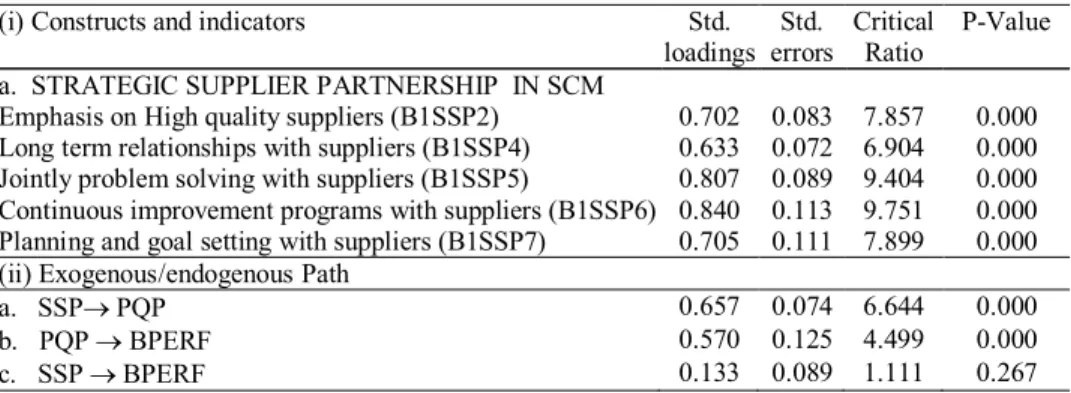
Looking at the loadings of the strategic supplier partnership in SCM variables (Table 5) on the main construct, we can see that ‘Continuous improvement programs with suppliers’ (structural loading = 0.840, std. error = 0.113 and critical ratio = 9.751) has the highest contribution towards strategic supplier partnership in SCM and it is followed by ‘Jointly problem solving with suppliers’ (loading = 0.807, std. error = 0.089 and probability value = 0.000), ‘Planning and goal setting with suppliers’ (structural loading = 0.705, std. error = 0.011 and critical ratio = 7.899) and ‘Emphasis on high quality suppliers’ (structural loading = 0.702, std. error = 0.083 and critical ratio = 7.857). All of these indicators have significant probability values (critical values ≥ 2.00), giving statistical evidence that their contributions towards strategic supplier partnership main construct are significant and positive. We can obviously suggest that strategic supplier partnership practices can help manufacturing companies improve their product quality performance and in the long run, it is safe to state that strategic supplier partnership in SCM can ultimately enhance business performance of manufacturing industry in Malaysia.
Table 4: Statistical structural indices of SEM model
Statistics Model Values Recommended values for good fit*
Chi square 73.440 -
Probability Level 0.150 ≥ 0.05
Degree of Freedom 62.000 -
χ2 /df 1.185 ≤ 3.00
Bollen (1989) Incremental Fit Index (IFI) 0.989 ≥ 0.90 Tucker & Lewis (1973) TLI 0.986 ≥ 0.90 Bentler (1988) comparative fit model (CFI) 0.989 ≥ 0.90
Normed fit index (NFI) 0.932 ≥ 0.90
Goodness of fit index (GFI) 0.905 ≥ 0.90
*Chau (1997)
Thus, a manufacturing company can improve its product quality performance and business performance by integrating and implementing strategic supplier partnership in SCM strategies and practices. The examination of residuals also reveals that variances among variables are perfectly explained by the respective constructs. The result highlights the unique contribution of strategic supplier partnership on product quality performance and business performance. Table 5 indicates the structural loadings and the respective p-value for the strategic supplier partnership constructs in supply chain management of this study.
International Journal of Business and Management Science, 1(2): 129-145, 2008 142
Table 5: Measurement results of the SEM model (i) Constructs and indicators Std.
loadings errors Std. Critical Ratio P-Value a. STRATEGIC SUPPLIER PARTNERSHIP IN SCM
Emphasis on High quality suppliers (B1SSP2) 0.702 0.083 7.857 0.000 Long term relationships with suppliers (B1SSP4) 0.633 0.072 6.904 0.000 Jointly problem solving with suppliers (B1SSP5) 0.807 0.089 9.404 0.000 Continuous improvement programs with suppliers (B1SSP6) 0.840 0.113 9.751 0.000 Planning and goal setting with suppliers (B1SSP7) 0.705 0.111 7.899 0.000 (ii) Exogenous/endogenous Path
a. SSP→ PQP 0.657 0.074 6.644 0.000 b. PQP → BPERF 0.570 0.125 4.499 0.000 c. SSP → BPERF 0.133 0.089 1.111 0.267
STRATEGIC SUPPLIER PARTNERSHIP INDEX
In this study, an attempt is made to calculate the Malaysian strategic supplier partnership index (MSSPI) in the context of product quality performance and business performance for the Malaysian manufacturing industry. The index is calculated by utilizing unstandardized weights from the output of the structural equation modeling (Fornell, Johnson, Anderson, Cha and Bryant, 1996). The purpose of calculating this index is to determine the level of strategic supplier partnership practice in the manufacturing industry in Malaysia. Since findings from the preceding statistical analyses above strongly indicate that strategic supplier partnership practice is very crucial, this study tries to explore the level of SSP practice in the Malaysian manufacturing industries by calculating the Malaysian strategic supplier partnership index (MSSPI). The calculation of the MSSPI is based on ACSI as suggested by Fornell et al. (1996). This paper proposes the following formula for the index:
x100 w 6 w x w MSSPI 5 1 i i 5 1 i 5 1 i i i
∑
∑
∑
= = = − =where, MSSPI = Malaysian Strategic Supplier Partnership Index (MSSPI) wi = the unstandardized weights
xj = the measurements variables
Having calculated the index, the Malaysian strategic supplier partnership Index (MSSPI) is found to be equal to 67.78. An index score of 67.78 for the strategic supplier partnership practice for the Malaysian manufacturing industry
International Journal of Business and Management Science, 1(2): 129-145, 2008 143 is considered moderate. Therefore, more effort should be carried out by manufacturing companies in Malaysia to adopt strategic supplier partnership in order to improve product quality performance and business performance.
CONCLUDING COMMENTS
The results of the study assist in understandings on how strategic supplier partnership practices in SCM may influence product quality performance and business performance. The strategic supplier partnership in SCM will ultimately results in positive gains. The results validate some of the key linkages and support beliefs and evidences found by other researchers with regards to the relationships among the strategic supplier partnership in SCM, product quality performance and business performance. It is also important to note that this study attempts to enrich the literature review and make a contribution in SCM-related studies. In addition, its purpose has been to make explicit what other researchers have perhaps known implicitly but without solid evidences. The empirical results support long-standing beliefs and anecdotal evidence by researchers about the relationships between the exogenous (strategic supplier partnership in SCM) and endogenous results (performances), and lend credibility to causal hypotheses that improving internal process leads to improvements in external performance results.
This study to some extent helps in resolving controversy about the magnitude and measurements of performance gains from implementing strategic supplier partnership in SCM. By strengthening strategic supplier partnership in SCM practices, improved performance will likely to occur. The results indicate that manufacturing companies should emphasize greater attention to the continuous improvement of the strategic supplier partnership in SCM process as well as management support in SCM programs.
REFERENCES
Ahire, S.L., Golhar, D.Y. and Waller, M.A. (1996). Development and validation of QM implementation constructs. Decision Sciences, 27(1): 23-55.
Anderson, M.G. and Katz, P.B. (1998). Strategic sourcing. International Journal of Logistics Management, 9 (1): 1-13.
Buzzell, R., and Gale, B. (1987). The PIMS principles: Linking strategy to performance. New York: Free Press.
Caplice, C. and Sheffi, Y. (1994). A Review and Evaluation of Logistics Metrics. The International Journal of Logistics Management, 5(2): 11-28.
Cagliano, R., Caniato, F. and Spina, G. (2006). The linkage between supply chain integration and manufacturing improvement programs. International Journal of Operations & Production Management, 26(3): 282-299.
International Journal of Business and Management Science, 1(2): 129-145, 2008 144 Chau, P.Y.K. (1997). Re-examining a Model for Evaluating Information Center Success Using a Structural Equation Modeling Approach. Decision Sciences, 28(2): 309-344. Chow, G., Heaver, T.D. and Henriksson, L.E. (1994). Logistics Performance: Definition and Measurement. International Journal of Physical Distribution and Logistics Management, 24(1): 17-28.
Cox, A. (1999). Power, Value and supply Chain Management. International Journal of
Supply Chain Management, 4(4):167-175.
Davis, T. (1993). Effective Supply Chain Management. Sloan Management Review, 34(1): 34-46.
Flynn, B.B., Sakakibara, S., Schroeder, R.G., Bates, K.A., and Flynn, E.J., (1990). Empirical research methods in operations management. Journal of Operations
Management, 9(2): 250-284.
Fornell, C., Johnson, M.D., Anderson, E.W., Cha, J. and Bryant, B.E. (1996). The American Customer Satisfaction Index: Nature, Purpose and findings. Journal of marketing, 60(4): 7-18.
Gunasekaran, A., Patel, A., and Mcgaughey R.E. (2003). A Framework for Supply Chain Performance Measurement. International Journal of Production Economics, 87(3): 333-347.
Hair, J.F., Anderson, R.E., Tatham, R.L. and Black, W.C. (1998). Multivariate data analysis. New Jersey: Prentice-Hall.
Harrington, L. (1995). Logistics, Agent for Change: Shaping the Integrated Supply Chain. Transportation and Distribution, 2(1): 30-34.
Hammel, T.R. and Kopczak, L.R. (1993). Tightening the Supply Chain. Production and
Inventory Management Journal, 34(2): 63-70.
Kotler, P. (1994). Marketing management analysis, planning, implementation and control (8th Ed.). New Jersey: Prentice Hall.
Kim, S.W. (2007). Organizational structures and the performance of supply chain management. International Journal of Production Economics, 106(2): 323-345. Kotabe, M., Martin, X. and Domoto, H. (2003). Gaining from vertical partnerships:
Knowledge transfer, relationship duration, and supplier performance improvement in the U.S. and Japanese automotive industries. Strategic Management Journal, 24(4): 293-316.
Kuei, C.H., Madu, C.N., and Lin, C. (2001). The relationship Between Supply Chain Quality Management Practices and Organizational Performance. International Journal of Quality and reliability Management, 18(8): 864-872.
Li, S., Rao, S., Ragu-Nathan, T. S., and Ragu-Nathan, B. (2005).
Journal of Operations Management, 23(6):618-641.
Li, S., Ragu-Nathan, B., Ragu-Nathan, T.S., and Rao, S.S. (2006). The impact of supply chain management practices on competitive advantage and organizational performance. Omega, 34(2): 107-124.
Li, X and Wang, Q. (2007). Coordination mechanism of supply chain systems. European Journal of Operational Research, 179(1): 1-6
Maheswari, B., Kumar, V. and Kumar, U. (2006). Optimizing success in supply chain partnerships. Journal of Enterprise Information Management, 9(3): 277-291.
McGaughey, Nick. (1991). Building competitive strength: Lessons from the chemicals industry. Industrial Management. 29(3): 36-41.
International Journal of Business and Management Science, 1(2): 129-145, 2008 145 Motwani, J., Kumar, A., Youssef, M.A. and Mahmoud, E. (1997). Forecasting quality of Indian manufacturing organizations: An exploratory analysis. Total Quality
Management. 8(6): 361-373.
Nunnally, J. (1978). Psychometric Theory. New York: Mc Graw Hill.
Pascucci, D. (1998). Up to date communications a must for keeping pace in the service business. Air condition. Heating & Refrigeration News, 205(16): 5-6.
Pittiglio, Rabin, Todd and McGrath (1994). Integrated Supply Chain Performance Measurement. A Multi-Industry Consortium Recommendation, Weston, Massachusetts: PRTM Consulting.
Prasad, S. and Tata, J. (2000). Information investment in supply chain management. Logistics information Management, 13(1): 33-38.
Robinson, C. and Malhotra, M.K. (2005). Defining the concept of supply chain quality management and its relevance to academic and industrial practice. International
Journal of Production Economics, 96(1): 315-337.
Sila, I., Ebrahimpour, M. and Birkholz, C. (2006). Quality in supply chains: An empirical analysis. Supply Chain Management: An International Journal, 11(6): 491-502.
Shin, H., Collier, D.A. and Wilson, D.D. (2000). Supply management orientation and supplier/buyer performance. Journal of Operations Management, 18(3): 317-333. Spekman, R.E., Kamauff, Jr. J.W. and Myhr, N. (1998). An empirical investigation into
supply chain management: A perspective on partnerships. Supply Chain Management, 3(2): 53-67.
Stanley, L.L. and Wisner, J.D. (2001). Service quality along the supply chain: Implications for purchasing. Journal of Operations Management. 19(3): 287-306. Stevens, G. (1989). Integrating the Supply Chain. International Journal of Physical
Distribution and Materials Management, 19(8): 3-8.
Stuart, F.I. (1997). Supply chain strategy: organizational influence through supplier alliances. British Journal of management, 8(3): 223-236.
Tsai, J.F. (2007). An optimization approach for supply chain management models with quantity discount policy. European Journal of Operational Research, 177(1): 982-994.
Vickery, S., Calantone, R., and Droge, C. (1999). Supply Chain Flexibility: An Empirical Study. Journal of Supply Chain Management, 35(3): 16-24.
Vereecke, A. and Muylle, S. (2006). Performance improvement through supply chain collaboration in Europe. International Journal of Operations & Production
Management, 26(11): 1176-1198.
Voss, C.A., (1988). Success and failure in advanced manufacturing technology.
International Journal of Technology Management, 3(3): 285–296.
Wang, W., Rivera, D.E. and Kempf, K.G. (2007). Model predictive control strategies for supply chain management in semiconductor manufacturing. International Journal of
Production Economics, 107(1): 56-77.
Wei, C-C., Liang, G-S. and Wang, M-J.J. (2007). A comprehensive supply chain management project selection framework under fuzzy environment. International