Procedia - Social and Behavioral Sciences 46 ( 2012 ) 2472 – 2476
1877-0428 © 2012 Published by Elsevier Ltd. Selection and/or peer review under responsibility of Prof. Dr. Hüseyin Uzunboylu doi: 10.1016/j.sbspro.2012.05.505
WCES-2012
Implementation of a scoreboard in schools based on performance
indicators
Doina Maria Tilea
a, Vasile Bleotu
b*
Lecturer "Dimitrie Cantemir" Christian University The Faculty of International Business and Economics Received date here; revised date here; accepted date here
Abstract
In an institution, although the members of the management team are distinguished by their type of training, financial management and accounting departments of educational institutions have increasingly less time available for solving complex problems generated by the legislative framework, being in constant change, improvement and balanced development of educational institutions. On this line, we propose building a dashboard, as an instrument of action, short-term (one year), taking into account a number of indicators, linked with the four instruments of the financial-accounting system, including: accounting, budget, annual financial statements and internal audit. In order to achieve this goal, each officer must know the direction of educational institutions development, to assess the implications of decisions taken in schools and to "visualize" permanently
Keywords: institution, management, annual financial statements, audit, education.
1. Introduction
Using a dashboard should contain summary information, understandable and relevant for fast and accurate decisions. Board type table used is small, coordinated by the head of finance and accounting department and prepared by the heads of service from the following departments: Accounting and Auditing.
Dashboard will be annual, quarterly update interval and by exception, when there are corrections included in the dashboard indicators will be limited, will refer only to the areas in which the leader can act and will be presented simple and coherent to be understood, analyzed and used as effectively as possible in the financial-accounting management.
Furthermore, indicators used will be trustworthy and objective, modified according to the phenomenon affecting the decision, and can be obtained quickly, with identical meanings in time and space. In the example proposed, we stopped on the following categories of indicators that can be calculated at school, namely:
Liquidity ratios Solvency indicators Indebtness ratio Profitability indicators Resultant indicators
* Doina Maria Tilea tel: +40-072-271-8240; Vasile Bleotu Tel.:+40-072-230-3618; E-mail address: [email protected]; [email protected]
Efficiency indicators
The dashboard will be made up of the following principles: ;
In this paper we analyzed the improvement recorded in the accounting education in relation to the state and population. These improvements can be analyzed and discussed with the dashboard (represented graphically).
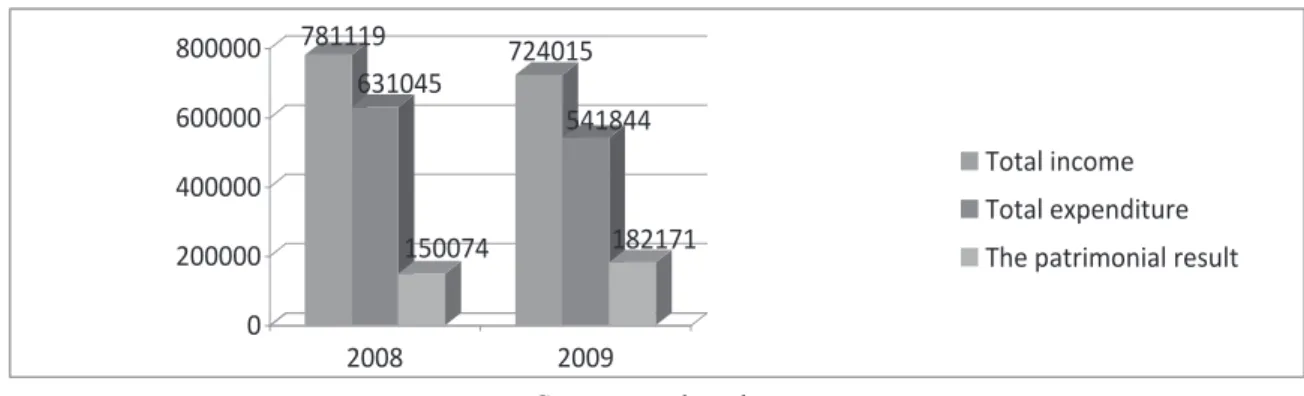
1.Information provided by the dashboard regarding the patrimony result account
The value of the total value income made by the High School of Snagov with grades I-XII decreased in 2009 to 724.015 compared to 2008 when it was 781,119 of their own income, meanwhile the income received from the budget situation is reversed in 2009 increasing to 53,392,991 compared to 2008 when it was 5,478,930, representing a percentage increase of 10% which is a good thing especially since future funding will be based on the ascending pattern of students .
ersity of Bucharest increased in 2009 up to 53.163.857 in comparison with 2008 when the value was 45.589.875 where the main source of income were the school fees and the number of students who increased from 22.448 in 2008 to 22.562 in 2009, representing 1% as a percentage. Figure no. 1 781119 631045 150074 724015 541844 182171 0 200000 400000 600000 800000 2008 2009 Total income Total expenditure The patrimonial result
Source: work author
Figure no. 2. The evolution of the Christian University income statement from Bucharest
44083658 31185048 12898610 53066508 38086740 14979768 0 20000000 40000000 60000000 2008 2009 Total income Total expenditure The patrimonial result
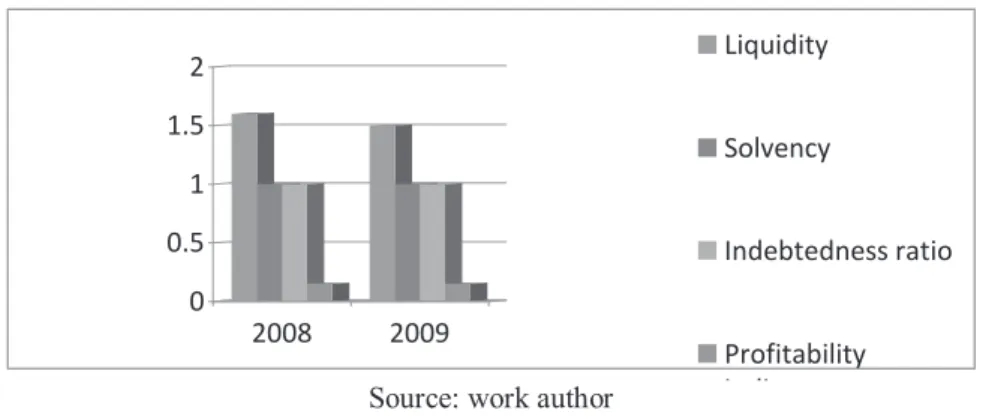
2.Information provided by the dashboard on the balance sheet
According to the analysis of indicators found in the balance sheet, liquidity balance was calculated with data from High School located in Snagov with classes from I-XII where it scored 1 which is good taking into consideration the
University of Bucharest having a liquidity of 1.5. Overall solvency ratio for the high school (0.8) is satisfying since the standards up to 1 are seen as good and over 1 very good which is the case of our university (1.8) considered to provide a good financial security as well.
Overall indebtedness ratio for the high scool (1.1) and university (1) are fine.
Profitability indicators are set according to the parameters, 0.8 for the high school and 0.25 for the university. To conclude with, the analysis of economic indicators shows us that the financial position of both, high school and university, is good, without any financial risk involved.
Figure no. 3. Evolution of the balance sheet at the High School of Snagov
0 0.5 1 1.5 2008 2009 Liquidity Solvency Indebtedness ratio
Source: work author
Figure no. 4. Evolution of the balance sheet at the Christian University of Bucharest
0 0.5 1 1.5 2 2008 2009 Liquidity Solvency Indebtedness ratio Profitability i di
Source: work author
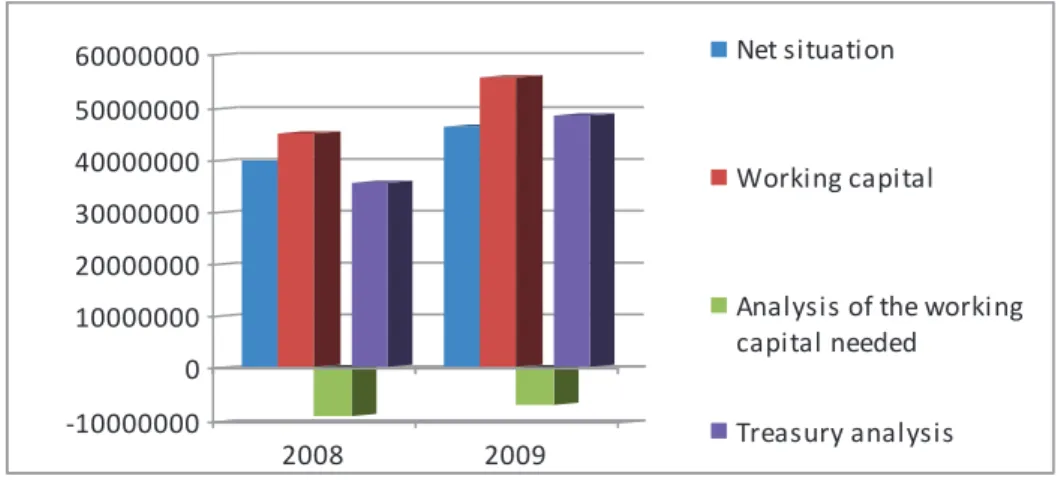
3.Information provided by the instrument panel to review the financial balance Taking a closer look at the study c
High School with grades I-XII reveals the fact that in both situations, educational institutions have excess permanent resources capable to finance temporary assets. Thus we see that the net working capital increased from year to year.
Figure no. 5. The evolution of the financial balance in High School of Snagov
Source: work author
Figure no. 6. The evolution of the financial balance in Christian University of Bucharest
-10000000 0 10000000 20000000 30000000 40000000 50000000 60000000 2008 2009 Net situation Working capital
Analysis of the working capital needed
Treasury analysis
Source: work author
Using the proposed dashboard at the level of an educational institution provides a set of advantages and disadvantages:
a) Advantages:
Enhancing the degree of substantiation of decisions by providing the decision-maker relevant operative information regarding the main aspects of educational institutions;
Rationalizing the working time of the financial accounting department by targeting the activity to the key issues facing the school, the problems noticed operatively in the dashboard through prepared statements;
Ensuring efficiency and high quality of reporting to various bodies, while facilitating the extension of the use of electronic information processing, with emphasis on telecommunication systems; Addressing information on financial and economic activities in a systematic vision and creating, thus, favorable conditions for an efficient function of the educational institutions;
Increased number of responsibilities given to the heads of departments for the work done, the scoreboard giving them, in summary form, the issues and critical areas towards which their efforts should be directed;
Using appropriate criteria for assessing the contribution of each group of employees working in educational institutions to achieve economic and financial results, using the information provided by the dashboard.
b) Disadvantages:
Repeated registration of information, in the cases required by the dashboard and current reports of the school system sent to various bodies within the institution;
volume - sometimes big - of work required to complete the situations claimed in the dashboard, especially when the collection, recording, transmission and processing is done manually;
Relatively high cost of the scoreboard, where its completion is a single action, and all operations of collecting, recording, transmitting and processing is done through electronic means by telecommunication
5. Conclusions
Patrimonial outcome analysis performed in high school and university, revealed that most indicators calculated are at satisfying levels, which expresses the efficiency of the management performane conducted by school management.
There is an urge to improve the system of promotion and advertising nationally. The university is involved in social and cultural projects in the municipality of Bucharest, which is insufficient since it is desirable to strengthen the market leadership in the private universities.
In addition, further measures should be taken regarding students who are bad payers in order to recover their debts on time and avoid appealing to short-term loans, loans which are interest bearing. As a matter of fact, a special attention should be given to interest expenses because high interest charges lead to diminishing results. References
1. Roman C-related, financial management of public institutions, vol I and II, Economic Publishing House, Bucharest, 2000 and 2004; 2. Scarlat Caesar, Daniel Popescu - Romania's EU accession Impact on public institutions, the European Institute, Iasi, 2002; 3. Tilea Doina Maria, Accounting of public institution, Pro Universitaria Press, 2011, ISBN 978-973-129-950-1;
4. William Webster, Accounting for Managers, McGraw Hill, USA, 2003; of Statistics, Bucharest, 2002;