Machine Vision Approach for Arrhythmia Classification using
Incremental Super Vector Regression
S.T Sanamdikar1*, S.T Hamde2, V.G.Asutkar2
1
PhD Student, 2Professor
Department of Instrumentation, Shri Guru Gobind Singhji Institute of Engineering and Technology, Nanded, Maharashtra, India
Email: [email protected]
DOI: http://doi.org/10.5281/zenodo.2637567
Abstract
A huge piece of the biomedical research range is devoted to create electrocardiogram (ECG) signal preparing procedures to add to early conclusion. Numerous cardiovascular variations from the norm will be showed in the ECG including arrhythmia which is a general term that alludes to an unusual heart musicality. The premise of arrhythmia conclusion is the ID of typical versus anomalous individual heart thumps and their right order into various analyses, in view of ECG morphology. In any case, the majority of the past investigations revealed the execution of either the SVMs or the ANNs without inside and out examinations between these two strategies. We have actualized super vector regression (SVR) which gives preferable outcome over other. Likewise, a substantial number of highlights can be removed from ECG signs and some might be more applicable to heart arrhythmia than the others. This paper is to upgrade the execution of heart arrhythmia arrangement by choosing applicable highlights from ECG signals. The viability, precision and capacities of our strategy ECG arrhythmia identification are shown and quantitative examinations with various models have likewise been done.The outcomes got from disarray lattice tests yielded on-line order exactness of 96% (ANN), 94% (SVM), 91% (NMD) and 99% (Proposed SVR). The outcomes propose that the strategy and model displayed is reasonable.
Keywords: Arrhythmia, statistical analysis, RR interval, Incremental Support Vector Regression, Discrete Wavelet Transform.
INTRODUCTION
These days, a large number of individuals are influenced by heart ailments around the world, though a lot of them could be supported through an electrocardiogram (ECG) follow examination, which includes the investigation of arrhythmia impacts on electrocardiogram designs.
An essential indicative instrument in recognizing incessant and intense heart musicality inconsistencies (cardiovascular arrhythmias) is the electrocardiogram (ECG), which estimates electrical heart movement through anodes put on a patient's skin. ECGs are pervasive in escalated care units (ICUs), where clinicians must have the capacity to settle
on basic consideration choices rapidly and precisely. The capacity to effectively recognize different arrhythmias from one another is significant for quiet prosperity; as a rule, the wave morphologies of considerate and deadly arrhythmias can be hard to recognize.
In this work, we completed the undertaking of programmed arrhythmia identification in ECG designs by methods for managed machine learning strategies, being the principle commitment of this paper to acquaint the super vector regression (SVR) classifier with this unique situation. We thought about one distance metrics, five component extraction calculations and four classifiers
in two varieties of the same dataset, being the execution of the systems looked at as far as viability and productivity.
To defeat the issue, programmed techniques are proposed to group the ECG. As of late, a few methodologies were used for programmed ECG order, for example, recurrence examination, k-nearest neighbour classifier, classification and regression trees, artificial neural networks, hidden markov models, support vector machines (SVM), probabilistic neural networks, recurrent neural network (RNN) and path forest.
Tran HoaiLinh [1] proposed two different ways system to improve the exactness of ECG flag characterization by sifting through the impact of the breath in the ECG flag and by utilizing the data of breathing stage as highlights in ECG flag recognition. These methodologies can improve the dependability and exactness of the arrhythmia order. As the classifier they utilized the adjusted neuro-fuzzy system.
Tae Joon Jun1 et al., [2] proposed a powerful ECG arrhythmia characterization technique utilizing a 2D profound convolutional neural system. Each ECG beat was changed into a 2D grey scale picture as an information for the CNN classifier. They utilized ECG accounts from MIT-BIH arrhythmia database. Test results show better outcomes with no manual pre-preparing of the ECG flags, for example, commotion separating, include extraction and highlight decrease.
Sherin M. Mathews et.al.[3] Utilizations Restricted Boltzmann Machine and profound conviction systems for ECG order of ventricular and supraventricular pulses utilizing single-lead ECG. RBM and DBN can accomplish exact outcome. Rahime Ceylan[4] proposed the highlights of ECG signals, ECG signals are removed
by utilizing method of optimal direction (MOD) and K-singular value decomposition (K-SVD). Be that as it may, the extricated highlights are ordered by artificial neural network (ANN).
Lakhan Sharma et al.[5] utilized SWT for break down of the divided multi-lead electrocardiogram (ECG) motion into various sub-groups. Test entropy, log vitality entropy, middle incline and standardized sub-band vitality determined over chosen groups of multi-lead ECG are utilized as highlights.
Rashid Ghorbani Afkhami et al [6] utilized discrete wavelet change (DWT) to separate morphological highlights of ECG flag and endeavours higher request measurement (HOS), highlights including kurtosis, skewness and fifth minute.
MATERIALS AND METHODS
We have utilized MIT-BIH Arrhythmia database [14] in our investigation, which incorporates numerous normal and perilous arrhythmias. The database contains forty eight and halfhour ECG recordings. This recording is obtained from 47 subjects. Each record comprises of two leads. For 45 of the chronicles, the principal lead is changed appendage lead II (MLII) and for the others it is adjusted lead V5. The second lead is a pericardial lead (V1 for 40 chronicles and V2, V4 or V5 for the others). 23 chronicles of this database were picked indiscriminately from an arrangement of four thousand wandering ECG accounts gathered from a blended populace of inpatients, the rest of the twenty-five chronicles were chosen from a similar set to incorporate less normal however clinically noteworthy arrhythmias that wouldn't be first rate in a little arbitrary set.
The first naming of the database incorporates sixteen classes of rhythms appeared in Table 1. Regardless of standards suggested for class marking and results portrayal of cardiovascular
arrhythmia grouping calculations by the Association for the Advancement of Medical Instrumentation (AAMI). The AAMI characterizes the five clinically applicable classes as [15].
N:-beats starting in the sinus hub
S:-supraventricular ectopic beats
V:-ventricular ectopic beats
F:-combination beat
Q:-unclassified beats Table 1: Class Label Information of MIT-BIH Arrhythmia Database.
Heartbeat Type Ann Total
Normal Rhythm NOR N 74607
Left Bundle Branch Block LBBB L 8069
Right Bundle Branch Block RBBB R 7250
Atrial premature Contraction APC A 2514
Premature ventricular contraction PVC V 7127
Paced Beat PB / 7020
Aberrated Atrial Premature Beat AP a 150
Ventricular Flutter Wave VF ! 472
Fusion of Ventricular and Normal Beat VFN F 802 Non Conducted P-Wave (Blocked APC) BAP x 193
Nodal (Junctional) Escape Beat NE j 229
Fusion of Paced and Normal Beat FPN f 982
Ventricular Escape Beat VE E 106
Nodal (Junctional) Escape Beat NP J 83
Atrial Escape Beat AE e 16
Unclassified Beat UN Q 35
Total 109655
Table 2: AAMI Recommended Labelling with Train and Test Set.
AAMI Class MIT-BIH Class Total
N S V F Q NOR,LBBB,RBBB,AE,NE APC,AP,BAP,NP PVC,VE,VF VFN FPN,UN 89665 2940 7478 802 17 Train Set 101, 106, 108, 109 ,112, 114, 115, 116, 118, 119, 122, 124, 201, 203, 205, 207, 208, 209, 215, 220, 223, 230 Test Set 100, 103, 105, 111, 113, 117, 121, 123, 200, 202, 210, 212, 213, 214, 219, 221, 222, 228, 231, 232, 233, 234.
Table 2 demonstrates the mapping from the MITBIH arrhythmia database classes to the AMMI heartbeat classes. Exactness of any acknowledgment framework relies on strategy utilized for highlight extraction and grouping. For
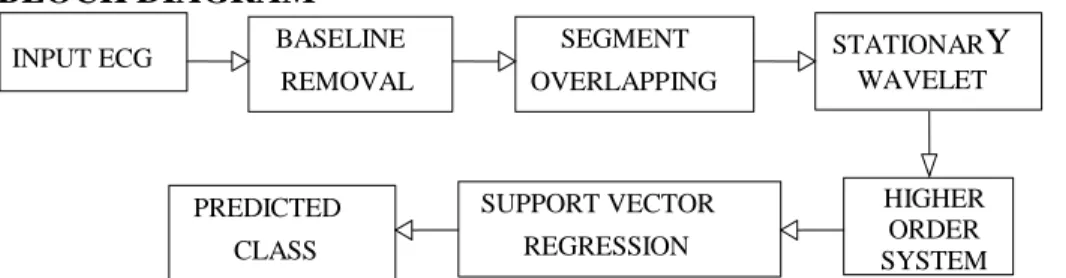
our application we have used Stationary Wavelet Transform along with higher order statistic and RR interval. These features are then used for Training Support vector machine. Instead of using traditional SVM we used SVR. BLOCK DIAGRAM
Figure 1: Block Diagram of Proposed Method for Cardiac Arrhythmia Classification. INPUT ECG BASELINE
REMOVAL SEGMENT OVERLAPPING STATIONARY WAVELET HIGHER ORDER SYSTEM SUPPORT VECTOR REGRESSION PREDICTED CLASS
Normalised Energy
The normalised energy at decomposition level n for each beat was calculated as variance [16]. N 2 n i i=1 1 E(j) = (sig -m) N-1
(1) Where,J: Segmented ECG beat number, N: number of samples in one beat, i: sample number in ECG Segment, n: decomposition level of Segment, m: Mean of a segment
This vitality of each beat was then standardized over the decay levels, which permits examination between the deteriorated flags in various dimensions. The standardized vitality of the beat j at deterioration level n is character as:
2 2 2 1 2 ( ) ( ) ( ) ( ) ... ( ) n norm n E j E j E j E j E j (2) Entropy
In flag preparing, the entropy can be seen as a proportion of vulnerability [11]. The established log vitality entropy was utilized in this examination. The entropy of the beat j at deterioration level n was gotten as pursues. [16].
N
2
logn i
i=1
Ent(j) =
log(sig ) (3)Higher Order Statistical Features
It was proved that higher order statistics[8] are less sensitive to morphological changes of ECG and the nonlinear and dynamic nature of these features help to extract the subtle changes in ECG data. Three statistical features as skewness, kurtosis and 5th moment are calculated for each heartbeat [15].
3 3 2 3/2' 3 4 2 3/2' E{[sig-E(sig)] } γ = (E{[sig-E(sig)] }) E{[sig-E(sig)] } γ = (E{[sig-E(sig)] }) (4)
Where E denotes expected value.While
γ
3 gives a measure of lopsidedness of distribution, 4γ
gives a comparative measurement of signal’s distribution with normal distribution of same variance. Estimate of the two are given.N 3 i i=1 5 2 (sig -m) γ = (N-1)σ
N 4 i i=1 6 4 (sig -m) γ = (N-1)σ
(5)Where sig is realization of ECG Segment? i and are estimates of mean and variance for observed signal with N samples.
RR Interval Features
We have picked RR [15] interim data as the main time space includes in our investigation. Two RR interims are figured straightforwardly from the R areas named as past RR and post RR interims. Past RR is characterized as the time remove among present and past R area while postRR is the time separate between current R area and the accompanying one.
The Incremental Support Vector Regression
SVM can be utilized as a relapse show, keeping up all the primary highlights that contribute to maximal edge. ISVR utilizes indistinguishable standards from the SVM for grouping, with just a couple of minor changes. As a matter of first importance, since yield is a genuine number it turns out to be exceptionally hard to anticipate the current data, which has limitless conceivable outcomes. On account of relapse, an edge of resistance (epsilon) is set in estimation to the SVM which would have effectively asked for from the issue. Yet, other than this reality, there is likewise a more confused reason; the
calculation is more convoluted in this manner to be taken in thought. Notwithstanding, the principle thought is dependably the same: to limit mistake, individualizing the hyperplane which augments[12]. Kernel functions
d k xi,xj = xi,xj For Polynomial
|xi-xj|22 k xi,xj =exp -2σ For Gaussian RBFTheorem: 1(In case of nonlinear data) If our ECG features contain nonlinear i.e., non-discriminative data, then classification problem become more complex. To tackle with this problem, the data gets transformed into an advanced dimensional feature space using kernel functions to accomplish the linear separation [13].
N * i i i i=1 y=
(α -α )g[f(x ),f(x)]+b (6) N * i i i i=1 y=
(α -α ).K(x ,x)+b(7)Figure 2: In Case of Non-Discriminative Feature [13].
DISCUSSION AND RESULTS
In this experiment, the MIT/BIH arrhythmia database is utilized to validate the proposed method. The database
contains comment for both planning data and beat class data checked by free specialists. The initial 20 records (numbered in the scope of 100– 124),
which incorporate agent tests of routine clinical chronicles, are utilized to choose delegate beats to be incorporated into the regular preparing information. The rest of the 24 records (numbered in the scope of 200– 234) contain ventricular, junctional and supraventricular arrhythmias. It is suggested that every ECG beat be ordered into the accompanying three heartbeats composes: N (pulsates starting in the sinus mode), V (ventricular ectopic thumps (VEBs/PVC))
and other (unclassified pulsate).
From the above performance parameter, it is clear results of reduced memory Levenberg-Marquardt (Trainlm) for 10 hidden layers is better than minimum distance classification, but it takes more time as compared to minimum distance.SVM with linear kernel is working better than rest of techniques, but it degrades its performance for real time ECG data. Our proposed SVR gave improved performance.
Table 3: Comparison of Various Method with Proposed Method Beat Wise Identification by SVR.
Parameters ANN SVM Minimum Distance Proposed SVR
Hidden Layer 10 - - -
Sensitivity 0.97 0.97 0.96 1
Specificity 0.96 0.95 0.94 0.99
Positive Prediction 0.96 0.96 0.93 0.99
False Prediction 0.1 0.1 0.2 0.01
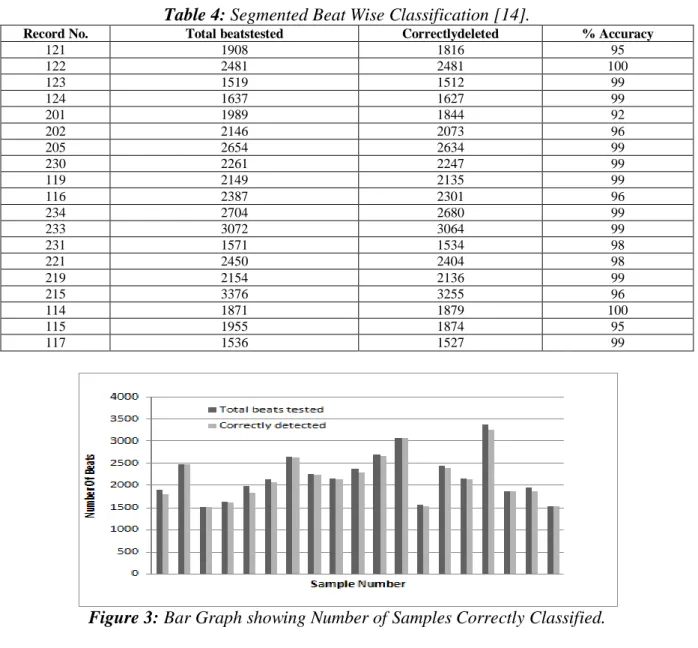
Table 4: Segmented Beat Wise Classification [14].
Record No. Total beatstested Correctlydeleted % Accuracy
121 1908 1816 95 122 2481 2481 100 123 1519 1512 99 124 1637 1627 99 201 1989 1844 92 202 2146 2073 96 205 2654 2634 99 230 2261 2247 99 119 2149 2135 99 116 2387 2301 96 234 2704 2680 99 233 3072 3064 99 231 1571 1534 98 221 2450 2404 98 219 2154 2136 99 215 3376 3255 96 114 1871 1879 100 115 1955 1874 95 117 1536 1527 99
Table 5: Confusion Matrix for Five Classes [14]. N S V F Q Total N 88413 124 3 213 912 89665 S 11 2899 29 1 0 2940 V 2 3 7334 16 123 7478 F 9 0 0 792 1 802 Q 0 3 0 1 13 17 CONCLUSION
This paper presents ECG based arrhythmia classification with more robust features and regression based classifier. This paper proposes an effective automated classification of cardiac arrhythmia using MIT-BIH arrhythmia database. We have trained the support vector regression classifier with 400 samples of different arrhythmias. Proposed method has been tested and compared with the most common classifier such as artificial neural network, support vector machine and minimum distance classifier.
From the confusion matrix, it is clear that our proposed algorithm works well for multiple class recognition problems. The execution time required for the proposed algorithm is 3 second and execution time required for backpropogation network is 4 second. Proposed algorithm performed better than existing method. We used both time and frequency domain features for classification purpose. Due to use of higher order statistic our classification problem becomes simpler than traditional morphological feature. Proposed algorithm delivered high performance even with smaller learning data.
REFERENCES
1. Tran HoaiLinh, (2017), “ECG arrhythmia recognition improvement using RespirationInformation”,
Vietnam Journal of Science and Technology,Volume 56, Issue 3,pp. 335–346.
2. Tae Joon Jun et.al(2018),“ECG arrhythmia classification using a 2-D
convolutional neuralnetwork”, Cornell University Library.
3. Sherin M. Mathews et.al(2017), “A novel application of deep learning for singlelead ECG classification”,
Computers in Biology and Medicine.
4. RahimeCeylan,(2017), “The Effect of Feature Extraction Based on Dictionary Learning onECGSignal Classification”, International Journal of Intelligent Systems andApplications in Engineering.
5. G. P. Nason,(1995), “The Stationary Wavelet Transform and some Statistical Applications”, Wavelets and
Statistics, pp. 281–299.
6. V. Di Virgilio et.al(20-23 Sept. 1995),“ECG fiducial point’s detection
through wavelet
Transform”,Proceedings of 17th International Conference of the Engineering in Medicine andBiology Society.
7. Lakhan Sharma et.al(February 2018),“Inferior myocardial infarction detection using Stationarywavelet transform and machine learning approach”, Signal, Springer, Image and Video Processing, Volume 12, Issue 2, pp. 199–206.
8. Rashid et.al(10-14 May 2015), “ECG based detection of left ventricular hypertrophy using higher orderstatistics”, 23rd Iranian Conference on Electrical Engineering.
9. Marcus Schmidt et.al(7-10 Sept. 2014), “A realtime QRS detector based on higherorder statistics forECG gated cardiac MRI”, IEEE Computing in Cardiology.
10.Zheng Wei et.al(2016), “Foetal ECG extraction by support vector regression”, IET Digital Library,
Volume 52, Issue 7, pp. 506–507. 11.S.Tong, et.al(2002),"Non extensive
entropy measure of EEG following brain injury fromcardiac arrest,”
Physical A, pp. 619–628.
12.Bin Gu et.al(July 2015), “Incremental learning for ν-Support Vector Regression”, Elsevier, Neural Networks, Volume 67, pp. 140–150. 13.Bin Gu et.al(July 2015), “Incremental
Support Vector Learning for ordinal regression”,IEEETransactions on Neural Networks and Learning Systems,Volume26, Issue 7.
14.Moody GB, Mark RG (2001) et al, “ The impact of the MIT-BIH Arrhythmia Database”. IEEE Engineering in Medical and Biology,
20(3), pp-45-50, (PMID: 11446209)..
15. Rashid Ghorbani
Afkhamiet.al(2015), “Cardiac arrhythmia classification using statistical and mixture modelling features of ECG Signals”,doi: 10.1016/j.patrec.2015.11.018.
16.Elgendi M, Eskofier B, Abbott D (2015), “Fast T Wave Detection Calibrated by Clinical Knowledge with Annotation of P and T Waves”,
Sensors.https://doi.org/10.3390/s15071 7693 Volume 15(7), pp. 17693-17714.
17. Shweta H. Jambukiaet.al(2018), “ECG beat classification using machine learning techniques” Int.J. Biomedical Engineering and Technology, Volume 26, Issue 1, pp. 32–53.
18. HanenChaouch at el(2018), “Statistical method for ECG analysis and diagnostic,” Int. J. Biomedical Engineering and Technology, Volume 26, Issue 1, pp 1–12.
19. MiHye Song et.al(2005), “Support vector machine based arrhythmia classification using reduced features”,International Journal of Control, Automation and Systems,
Volume 3, Issue 4, pp.571–579.
20. Alex J. Smola et.al(2004), “A tutorial on support vector regression” Statistics and Computing14: Kluwer Academic Publishers, Manufactured in the Netherlands, pp. 199–222.
Cite this article as: S.T Sanamdikar, S.T Hamde, & V.G.Asutkar. (2019). Machine Vision Approach for Arrhythmia Classification using Incremental Super Vector Regression. Journal of Signal Processing, 5(2), 1– 8.
![Figure 2: In Case of Non-Discriminative Feature [13].](https://thumb-us.123doks.com/thumbv2/123dok_us/9957041.2488249/5.893.120.780.139.1010/figure-case-non-discriminative-feature.webp)
![Table 5: Confusion Matrix for Five Classes [14]. N S V F Q Total N 88413 124 3 213 912 89665 S 11 2899 29 1 0 2940 V 2 3 7334 16 123 7478 F 9 0 0 792 1 802 Q 0 3 0 1 13 17 CONCLUSION](https://thumb-us.123doks.com/thumbv2/123dok_us/9957041.2488249/7.893.100.794.115.298/table-confusion-matrix-for-five-classes-total-conclusion.webp)
