Abstract — It is well accepted among the web community that local servers out-perform distant ones. This common knowledge dictates buying a local web-hosting plan for one's business. In this paper we show that, all other factors being equal, time zone influence on web traffic peak times might dictate migrating web-hosting plans. We performed simulation which shows that for entertainment, auctions and similar evening traffic sites - sites who's main clientele access is between 4:00PM and 2:00AM, distant servers actually outperform local ones and it's beneficial to migrate to remote hosts. The simulation suggests that moving web-hosted sites ±3 time zones away from local clientele decreases the total response times experienced by clients.
Keywords:Internet, Internet topology
1.
Introduction and motivation
Common web developer's wisdom when setting up a website is to physically place the web server on a geographically local location to the population it services1. This intuition is based on the assumption that the latency encountered during the transition of data from the server to the client should be minimized. Payload from a geographically local server would traverse fewer router nodes to reach client machines than a geographically remote server.
This common belief is obviously correct if one is setting up a dedicated server that only services the specific site in question. Thus, processing time for the client's request isn't influenced by the server's location; rather, that value can be taken as a constant. And with the minimization of transition time accomplished by a locally stationed server, the total request response cycle times will decrease as well.
In a shared web-hosting environment, however, the question arises as to whether this practice is really wise. Here, there are a number of other factors that influence response times of servers. Allocation of processing time (CPU cycles) to other domains, cap on bandwidth and memory constraints will also influence response times – to name just a few. In this scenario, it might be wiser to buy a hosting plan on a server that mostly services its local constituents, but is geographically placed so as to utilize the "off peak" hours to minimize the total request-response cycle. This must also add the increase in transition time incurred, as payload of a non-local server would experience longer transition times than local counterparts.
*Listed in alphabetical order.
1 This behavior is what leads Google's search engines to take into account in
their point system the server location when generating answers to a localized query (such as one's submitted by www.google.co.fr). See [10]
This paper is organized as follows: In section 2 we formulate the problem domain so as to set the ground work for further research. Section 3 provides a mathematical model to capture the relationship between variables influencing the question at hand. We identify known (easily accessible) and un-known (requiring extensive research and testing) information, so as to allow for an online tool to be built upon the information collected. In addition results of a MATLAB simulation2 are presented. Sections 5 and 6 provide future research venues and concluding remarks, respectively.
2.
Problem formulation and related work
There are many factors that may influence the time it takes from the instant a client posts a request to a server until the response is displayed by the browser. Some of these factors include (in a web hosting server):
• CPU speed – the speed at which the server CPU can execute commands
• Memory allocation – how much memory (RAM) is allocated to the web application
• CPU time sharing segment – size of segment allocated for processing request for application data
• Transition / Transfer times – time for a request to travel from point to point (client to server and vice-versa)
• Router hops – number of routers on the route from end-point to end-end-point
• Hit rate of web host – number of requests a web host receives for a given period of time
• Number of web clients – number of sites hosted on a particular server
• Server time zone – where is the server located
• Client time zone – where is the request initiated from
• Time of request – when was the request initiated
• Distribution of hit rate w.r.t. time – when is the server served with the majority of hits
• Data size – size of page to be served
• CPU requirements – amount of CPU cycles needed to process request
• Others…
Some of these factors influence each other while others stand by themselves. For example transition and transfer times are influenced by the number of router hops en-route from client to server, which, in turn, is influenced by the server and client time zones. The CPU time sharing segment length is 2 Available upon request
Time zone considerations for web-hosting plans
E. Fredj
1and A. Stulman
1*
1
influenced by the number of hosts sharing the server distribution of request arrival rate and, the amount of CPU cycles required for the processing of each request
As it turns out, the total request/response cycle time is influence by all these factors in one way or the other. In relation to our work, we are not interested in factors that are constant (such as the CPU cycles needed per request and the CPU speed). Obviously a faster server would give better results than a slower one, all other factors being equal. We wish to model only factors that are influenced by the location of the webhost (vis-à-vis time zone differences betw
and server), and the fact that it's not a dedicated host. There has been much research taking geo
account. Many algorithms were produced to accurately locate the geo-location of a web server given its IP address. See 3, 4, 5, 6], to name just a few. In addition, load balancing with utilization of distributed web farms was also looked into 13, 14, 15]. Recetly, Malet and Pietzuch
migrate virtual web application components "in the cloud", so as to minimize total response times. They too, however, assume that response times "can be minimized by placing application components closest to the network location of the majority of anticipated users". To the best of our knowledge this is the first work done to investigate a way of utilizing geo location of servers and clients for the exploitation of time zone differences so as to achieve quicker response times.
3.
Model and simulation
3.1
Model
In the model presented, see Figure 1, the network consists of four nodes. Two nodes model the web server, and two nodes model the internet communication network as well as linear modeling internet traffic. The low
HTTP and TCP/IP protocols are purposely ignored. We use a simple file server over the internet, as every web page, image, etc. is actually transferred over the internet as a standalone file. We assume a single server multi
adhering to the M/M/1 model [11].
Justification: The only difference between a server servicing requests and the standard M/M/1 model is the initialization time which is always present. It is common practice, however, to ignore initialization times if the
minute with respect to the processing time. Here to, we assume the initialization time for processing each request is proportionally insignificant with respect to processing time; hence, it's ignored. In addition, in a web
company environment, it is typical to have only one server servicing the site; hence, M/M/1. It is possible that the web hosting company is using co-location and load balancing techniques, but for the most part a single server is used for a specific web-hosted site.
hosts sharing the server, the the amount of CPU ed for the processing of each request.
As it turns out, the total request/response cycle time is influence by all these factors in one way or the other. In relation to our work, we are not interested in factors that are ded per request and the ). Obviously a faster server would give better results than a slower one, all other factors being equal. We wish to model only factors that are influenced by the location vis time zone differences between client , and the fact that it's not a dedicated host.
There has been much research taking geo-location into account. Many algorithms were produced to accurately locate location of a web server given its IP address. See [1, 2, , to name just a few. In addition, load balancing with web farms was also looked into [12, Malet and Pietzuch in [16] set out to migrate virtual web application components "in the cloud", so minimize total response times. They too, however, can be minimized by placing application components closest to the network location of the best of our knowledge to investigate a way of utilizing geo-location of servers and clients for the exploitation of time zone differences so as to achieve quicker response times.
, the network consists of four nodes. Two nodes model the web server, and two nodes model the internet communication network as well as linear modeling internet traffic. The low-level details of the HTTP and TCP/IP protocols are purposely ignored. We use a simple file server over the internet, as every web page, image, etc. is actually transferred over the internet as a standalone file. We assume a single server multi-client architecture, The only difference between a server servicing requests and the standard M/M/1 model is the initialization time which is always present. It is common practice, however, to ignore initialization times if they are so minute with respect to the processing time. Here to, we assume the initialization time for processing each request is proportionally insignificant with respect to processing time; hence, it's ignored. In addition, in a web-hosted small ironment, it is typical to have only one server servicing the site; hence, M/M/1. It is possible that the
web-location and load balancing techniques, but for the most part a single server is used for a
Figure 1: Jobs arrive at the Web server with rate time initialization processing is performed at node job proceeds to node μ, where
to the network. At node S this block of data is travelled via the Internet at constant velocity and is received by the client browser, represented by the node
The total time for the request
T = T response + T
and each of the equation parts is defined as follows:
where:
• Frequest/Freply – the average file size being transferred for the request/reply
• C/S – the bandwidth of the client/server
• λ – request arrival rate at the server (assumed Poisson) as a function of max arrival rate
Percentage (ITP(trequest
λ = λmax * ITP(trequest).
• μ – service rate of requests (assumed exponentially distributed)
• ρ – ratio of arrivals to service
• I – initialization time per request at the server and,
! " !#$%
: Jobs arrive at the Web server with rate λ. All one time initialization processing is performed at node I. The where it is processed and passed on to the network. At node S this block of data is travelled via the Internet at constant velocity and is received by the client browser, represented by the node CR.
The total time for the request-response cycle is given by:
+ T transfer
(1)
and each of the equation parts is defined as follows:
& ' () + , 1 " ., / 0 " .
12
$ 34(2)
the average file size being transferred for the bandwidth of the client/server
request arrival rate at the server (assumed Poisson) as a function of max arrival rate and Internet Traffic
request)) for a given time zone:
service rate of requests (assumed exponentially ratio of arrivals to service 5/ 6
78
initialization time per request at the server
!9
% ! " !4 9
as a function of distance between client (x) and server (x0), the speed of transfer (#$%) [9].
Although [8] stated that data travels through fiber optic cables at almost exactly 2/3 the speed of light in vacuum (C), experiments of [9] exhibited point-to-point (i.e. client to server and vis-versa) speeds of at most 4/9 the speed of light allowing for delays such as circuitous paths, packetization, and other similar delays. Thus, we used this latter measure for the equation 3.
We use the ITP to allow for the change of arrival rate and bandwidth usage throughout the day. It is a measure of traffic as a percent of peak usage measured. Values are extracted from [7] for North America – see Figure 2.
3.2
Simulation
In this section we provide the assumptions the simulation is built upon, the results of the simulation and, the conclusion we arrived at based on these results.
Assumption 1: In order to implement the theoretical model we assume that usage patterns are uniform around the world. That is, that at 6:00AM local time (for every time zone), internet usage is approx. 50% of the peak usage reached at 10:00PM.
Assumption 2: We assume that servers compared are on the same latitude. This assumption is placed so as to minimize the distance / time zone ratio. Having servers on different latitudes would allow for increase of transfer time without change in time zone, which is counter-intuitive to what we are trying to measure.
Assumption 3: Although possible that realistically a client will be closer to a server across time zone "boundaries", we currently assume that servers are strategically placed in the center of the time zone slices. We classify a server as local to its clientele if they are both in the same physical time zone. This, of course, can later be modified by re-creating "time zones" around the placement of servers.
Figure 2: Daily internet traffic for the eastern cost of North America (EST – Eastern Standard Time) as the % of maximum usage. Thus, 50% at 6:00AM depicts half the requests within the system when compared to 10:00PM.
We used the above equations 1-3 to generate Figure 3, where: '+' is Ttransfer, '*' is Tresponse, and '∆' is T, when placing the server in each of the 24 time zones given the client is in a specific location (EST) for a specific time of the day.
Figure 3: Total response time, T, for each time zone offset (±12 hours) from EST (set as 0 time zones differences between client and server). Each '+' represents the delay based on transition of distance between client (EST) and server location. '*' represents the total time for the server to produce the reply to the client's request. And '∆' is the summation of the two.
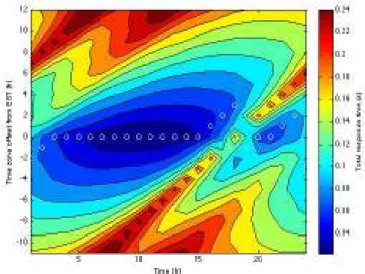
Generalizing Figure 3 for all 24 hours of the day, we generated Figure 4 in which we show via a 3-dimensional graph the time required for the client to receive a response (color coded) given the time of day at the client's location (assumed EST), and the time zone differences between client and server.
Figure 4: Total response time (s) for each of the 24 hours of the day when the distance between the client and the server is a number of time zones apart. The circles in the figure, depict the minimum time needed for the client to receive a response. 30 40 50 60 70 80 90 100 8 :0 0 P M 1 0 :0 0 P M 1 2 :0 0 A M 2 :0 0 A M 4 :0 0 A M 6 :0 0 A M 8 :0 0 A M 1 0 :0 0 A M 1 2 :0 0 P M 2 :0 0 P M 4 :0 0 P M 6 :0 0 P M % o f to ta l u se ( ITP) Time of Day
Daily Internet Traffic
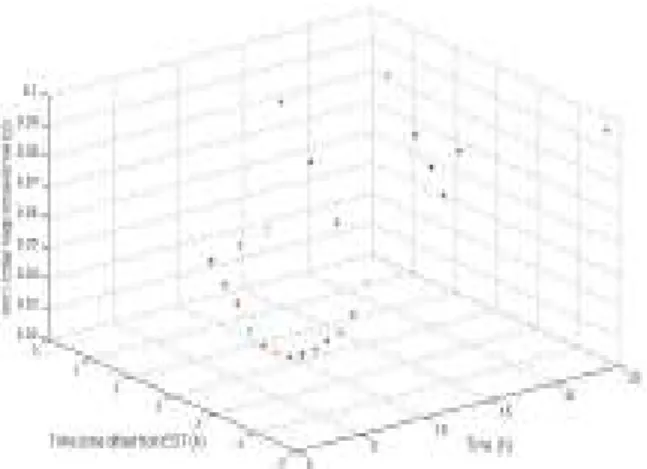
Figure 5 and Figure 6 further refine the information in Figure 4 to include only the minimum times from a side view and a bird's view, respectively.
Figure 5: Minimum total response times for each of the 24 hours of the day. These values are the minimum values found in a collection of pre-generated values when executed for each of the 24 hours. This shows us the minimum possible response time when taking into account both time of day and distance (measured in time zone offsets) between client and server.
Figure 6: A bird's view of Figure 5, allowing for simpler understanding of time zone significance disregarding the actual response time values.
Examination of the graph (especially Figure 6) shows that indeed a local server (having the client and server in the same time zone) would perform better than off-shoring one for a better part of the day. If, however, one's clientele is primarily between 4:00PM and 2:00AM (such as a movie streaming sites, auction sites and other sites primarily geared to the evening crowds), it would be wise to off-shore a web-hosting plan to a location between 1 and 3 time zones ahead or behind. This would be true even if one doesn't expect peak usage of his server, as web-hosting allows for peak usage based on other sites hosted on the same server.
If, however, one's clientele primarily access the web-site during the work day (between 3:00AM and 4:00PM), the common notion of localizing servers still holds.
4.
Future work and conclusion
4.1
Future work
Currently, we are engaged in further expanding this research venue towards testing our hypothesis that given today's common practice it is better to set up a hosting plan in a location where one's peak usage hours are the "off peak" for the majority of other sites hosted on the particular server. Our test plan includes building a benchmark website that will be either heavy on processing need, memory usage, or bandwidth requirements and any combination thereof; setting it up in different locations worldwide with comparable server capabilities; and, executing the request response cycle from different locations worldwide on different times of the day (through proxies or otherwise).
In addition, there are many other directions in which this work can be build upon, including: finding the real distribution of request arrivals and tie them to the above equations, developing a local/foreign host threshold ratio such that determining whether migrating hosted sites is advantageous, tying in the ratio of server to population savvy density (are servers in third world countries, where user bandwidth requirements are minimal, better than servers on backbones where requests are enormous. This might allow for off-shoring servers within the same time zone and while still gaining the "off peak" usage advantage. Further expansion of the model towards more complicated architectures such as multi-server (M/M/N), geographically distributed servers, web farm and/or web garden is also possible.
It is also possible to change the way co-location servers are spread out. Intelligent agents can predict (for a given time) where the best location for each of the servers might be, allowing for the slow migration servers (rather than redirecting requests via load balancers) so as to minimize total response times. This can be done as an augmentation to load balancing techniques, especially when load balancing reached equilibrium but is just not good enough.
Lastly, one can building a tool that will suggest to perspective hosting plan buyers where they should place their sites based on their perspective user location.
4.2
Conclusion
In this work we tried to give an initial model for calculating web response delays due to time zone differences. This allows us to come to a knowledgeable decision as to where to geo-place a hosted site. It was determined that buying a remote web-hosting plan can be beneficial and is desirable for sites that have clientele at evening hours. In addition, a max distance threshold of ±3 time zones from expected clientele is discovered.
Obviously, this work is assuming the fact that current practice doesn't encourage migration of sites. If all site owners of a specific region were to migrate to a second geo-region, the conclusion would be quite different. Thus, the decision as to where to buy a hosting plan is a dynamic one, and the tool we hope to develop will give online answers.
References
[1] Padmanabhan, V. N. and Subramanian, L. 2001. An investigation of geographic mapping techniques for internet hosts. In Proceedings of the 2001 Conference on Applications, Technologies, Architectures, and Protocols For Computer Communications (San Diego, California, United States). SIGCOMM '01. ACM, New York, NY,
173-185. DOI=
http://doi.acm.org/10.1145/383059.383073
[2] Gueye, B., Ziviani, A., Crovella, M., and Fdida, S. 2006. Constraint-based geolocation of internet hosts.
IEEE/ACM Trans. Netw. 14, 6 (Dec. 2006), 1219-1232. DOI= http://dx.doi.org/10.1109/TNET.2006.886332 [3] Goeller, K., Spaulding, B.G., Godwin, J.P., Anderson, B.,
Le-Chau, L., "Network geo-location system,"U.S. Patent 7200658, April 3, 2007.
[4] Ledlie, J., Gardner, P. and Seltzer, M., "Network coordinates in the wild", in Proc. of NSDI, Cambridge, MA, 2007.
[5] Tang, L. and Crovella, M. 2003. Virtual landmarks for the internet. In Proceedings of the 3rd ACM SIGCOMM Conference on internet Measurement (Miami Beach, FL, USA, October 27 - 29, 2003). IMC '03. ACM, New York,
NY, 143-152. DOI=
http://doi.acm.org/10.1145/948205.948223
[6] Guo, C., Liu, Y., Wenhauo, S., Wang, H.J., Yu, Q., Zhang, Y., "Mining the web and the internet for accurate IP address geolocations", in Proc. 28th IEEE Conference on Computer Communications, Rio de Janeiro, 2009, pp. 2841-2845.
[7] Labovitz, C. (2009, August 17) . What Europeans do at Night.
Security to the Core. [Online] Available: http://asert.arbornetworks.com/2009/08/what-europeans-do-at-night/.
[8] Percacci, R. and Vespignani, A., " Scale-free behavior of the Internet global performance," The European Physical Journal B - Condensed Matter, vol. 32, pp. 3-15, April 2003.
[9] Katz-Bassett, E., John, J. P., Krishnamurthy, A., Wetherall, D., Anderson, T., and Chawathe, Y. 2006. Towards IP geolocation using delay and topology measurements. In Proceedings of the 6th ACM SIGCOMM Conference on internet Measurement (Rio de Janeriro, Brazil, October 25 - 27, 2006). IMC '06. ACM,
New York, NY, 71-84. DOI=
http://doi.acm.org/10.1145/1177080.1177090
[10]Grothaus, G., Thakur, S., (2007, August 2). Server location, cross-linking, and web 2.0 technology thougts.
[Online] availbale:
http://googlewebmastercentral.blogspot.com/2007/08/serv er-location-cross-linking-and-web.html.
[11]Trivedi, K.S., Probability, Statistics with Reliability, Queueing and Computer Science Applications. 2nd Ed., Wiley, 2008.
[12]Aggarwal, G., Motwani, R., and Zhu, A. 2006. The load rebalancing problem. J. Algorithms 60, 1 (Jul. 2006), 42-59. DOI= http://dx.doi.org/10.1016/j.jalgor.2004.10.002
[13]Thubert, P. and Levy-abegnoli, E., "Technique for improving load balancing of traffic in a data network using source-side related information," U.S. Patent 7328237, February 5, 2008.
[14]Brisco, T., "DNS support for load balancing," RFC 1794, Rutgers University, April 1995.
[15]Dias, D. M., Kish, W., Mukherjee, R., and Tewari, R. 1996. A scalable and highly available web server. In
Proceedings of the 41st IEEE international Computer Conference (February 25 - 28, 1996). COMPCON. IEEE Computer Society, Washington, DC, 85.
[16]Barnaby Malet and Peter Pietzuch. 2010. Resource allocation across multiple cloud data centres. In
Proceedings of the 8th International Workshop on Middleware for Grids, Clouds and e-Science (MGC '10).
ACM, New York, NY, USA.
DOI=10.1145/1890799.1890804
Erick Fredj is a computational chemical physicist at JCT’s Jerusalem College of Technology, Israel. He received his BS, and MSc in physics from the Technion, and his PhD in chemical physic from the Hebrew University of Jerusalem. Fredj pioneered the use of quantum simulation methods in the study of large molecular systems. Since 1995, he has investigated problems in computational physic spanning length scales from microscopic to macroscopic, focusing on studies in structures, and spectroscopy.
Ariel Stulman received his bachelor's degree in technology and applied sciences from the Jerusalem College of Technology, Jerusalem, Israel, in 1998. He then went on to get his masters from Bar-Ilan University, Ramat-Gan, Israel, in 2002. In 2005 he achieved a Ph.D. from the University of Reims Chanpagne-Ardenne, Reims, France. As of 2006 he holds a position at computer department of the Jerusalem College of Technology. His research interests are in the field of software testing, formal methods, real-time systems, and web testing.