The Role of Education in Poverty Alleviation: Evidence from
Bangladesh
Sacchidanand Majumder1, 2* Dr. Soma Chowdhury Biswas3 1.M. Phil., Department of Statistics, University of Chittagong, Bangladesh
2.Monitoring Specialist, Dhaka Ahsania Mission, Dhaka, Bangladesh 3.Professor, Department of Statistics, University of Chittagong, Bangladesh Abstract
Education provides a foundation for eradicating poverty and fostering economic development. The objective of this study is to investigate the influences of education and other demographic, economic, and social factors on poverty of household in Bangladesh through an analysis of data from the Household Income and Expenditure Survey (HIES) 2010 conducted by Bangladesh Bureau of Statistics (BBS). A total of 12,240 households are considered for analyzing the status of household’s poverty. CBN method is employed for estimating poverty of household. After adjustment in a multivariate logistic regression model an increase in educational level of household’s head had a strong association with the probability of a household being non-poor. Increased the number of literate member or presence of a graduate or higher educated member in household, the probability of household being poor is decreased. Increasing investment in education can lead a household from being poor to non-poor. The study results also highlights that rural households are poorer than urban households and household size; age, sex and employment status of household’s head; construction materials of walls and roofs, source of drinking water all have significant impact on household’s poverty level.
Keywords: Education, Poverty, Household, CBN Method, Logistic regression analysis, Bangladesh. Introduction
Poverty is a multidimensional concept: it is not only the lack of financial resources, but also, the lack of capability to function effectively in society. Inadequate education or income, poor health, insecurity, low self-esteem, sense of powerlessness or the absence of rights such as freedom of speech are different dimensions of poverty that must be taken into account when designing poverty reduction measures (Sen 1992). A study by United Nations Development Program (UNDP) revealed that human poverty not only stands for income poverty: it is the lack of access to opportunities and alternatives for living an endurable life. Lack of education is one such significant opportunity which reflects the poverty of education. Therefore, in a cyclical overview, educational poverty translates into an important measure of human poverty (Espen, 2009).
Education provides a foundation for eradicating poverty and fostering economic development. Education is important in reducing poverty and also increasing the wealth of a nation (UNESCO, 2001). An increase in the educational level of the head of the household significantly reduces the chances of the household being poor (Qureshi and Arif, 2001). Moreover, an increase in the schooling of household heads not only has a positive impact on their productivity and earnings but also enhance the productivity of other members of the household perhaps through persuading them to be educated and/or skill-oriented (Abuka, et. al 2007). The study conducted by Shirazi (1994 as cited in Janjua & Kamal, 2011) reveals that when the education levels for household heads rises, household poverty risk weakens.
An increase in the educational level of the head of the household significantly reduces the chances of the household being poor (Nasir and Nazli, 2000). Moreover, an increase in the schooling of household heads not only has a positive impact on their productivity and earnings but also enhance the productivity of other members of the household perhaps through persuading them to be educated and/or skill-oriented (Qureshi and Arif, 2001)
Appleton (1997) argues that each year in primary school refers to a 2.5% decrease in poverty risk and that almost doubles early secondary education levels. While lower education may lead to higher levels of poverty, poverty may also result in lower levels of education.
There is a positive correlation between education level and income earning abilities. Increased levels of education thus increase economic opportunities and growth. Education also increases social benefits that improve economic development and the conditions of the poor (Haughton and Khandker 2009). Education contributes to poverty reduction by increasing the value of efficiency of the labour force and thus enhances economic growth (Julius et. al, 2009). The higher level of education not only increases the sources of earning or wages but also improves the income level. In the same way, according to Sackey (2005) education has a crucial role in the wellbeing of individual/ household.
Education is regarded as a means of escaping from poverty (Becker, 1993). Education, primary education in particular, is increasingly perceived as playing a pivotal role in poverty alleviation (Jimenez, 1995; Lipton and Ravallion, 1995). Human capital theory, more specifically the rates of return on education, is used as the theoretical foundation for emphasizing the importance of primary and girls’ schooling in developing countries.
This theory assumes that education can both enhance an individual’s productivity and thus improve their earnings and contribute to the economic growth of the country as a whole (Shultz, 1963; Becker, 1993).
Primary education is the initial threshold of human capital but secondary and higher education, and investment in science and technology will give rise to acceleration and sustenance in economic growth and development. The simple regression secondary and higher education is inversely related with poverty, therefore secondary and higher education is important in the inverse relation of education and poverty apart from primary education Tilak, (2005). It has been seen that the likelihood of being poor is higher even for the lower level of education Okojie (2002).
Evidence suggests that cognitive skills have large economic effects on individual earnings and on national growth (Hanushek and Woessmann 2007) and that workers' productivity depends both on years of education and what is learned at school (Heckman, Layne-Farrar, and Todd 1995; Murnane, Willett, and Levy 1995).
Mursa (2007) examined the positive relationship between degree of education and level of employment of working force. It was found that unemployment is due to less education, less aptitudes, knowledge and qualification. He stated that education has very significant economic value due to the complex productive process. He concluded that less qualified person faces unemployment because the companies demand a worker with high techniques and well education. Better education provides better opportunities, increases employment and decreases unemployment risk (Mursa, 2007).
Higher educational degrees act as a signal of diligence to employers, and increase access to a greater number of available jobs. By contrast, lower skilled individuals are less likely to find employment and if they do, they are usually the first to be dismissed during economic slowdowns. The probability of falling into poverty is thus higher for lower educated individuals (Schiller 2008). It is important to note that the emergence of globalisation has increased competition in the labour market, making lower skilled labour ever more replaceable and therefore investment in higher levels of education essential (Bonal 2007, Tarabini 2010).
Some studies have shown that education is strongly associated with poverty reduction in Bangladesh (see for example, Asadullah 2005; Asadullah and Rahman 2005; Al-Samarrai 2007). For these reasons, education is a key component of the government’s attempts to accelerate poverty reduction (GOB 2005). In Bangladesh, poverty levels fall as the educational attainment of people rises. The tendency of reducing poverty among the more educated persons have occurred at an accelerated pace than those having no or little education. Additionally, it is found that the rate of reduction in the incidence of poverty among the illiterate has reduced from 63.1 percent in 2000 to 42.8 percent in 2010 with an annual decrease rate of 3.2 percent at the national level (Mustafizur, 2012).
A district-wide analysis of education and the incidence of poverty gives a more clear and realistic picture regarding this relationship. The correlation coefficient between literacy rate (7 years and above in 2001) and poverty incidences (2003) has been found to be -0.40, which implies that a higher level of educational attainment certainly reduces the poverty incidence in a region. As a result, it can be said that education has a higher impact on reducing poverty at the regional level in Bangladesh; nevertheless, there are other contributing factors besides poverty that affect the level of regional education (Khan and Islam. 2015).
Education and poverty are inversely related. The higher the level of education of the population, lesser will be the number of poor persons because education imparts knowledge and skills which is helpful in higher wages. The direct effect of education on poverty reduction is through increasing the earnings/income or ages. The indirect effect of education on poverty is important with respect to ‘human poverty’ because as education improves the income, the achievement of basic necessities becomes easier and raises the living standard which surely means the fall in human poverty. The education indirectly helps in the fulfillment of basic needs like water and sanitation, utilization of health facilities, shelter, and it also affects the women’s behavior in fertility decisions and family planning. (Awan et al., 2011)
Literature reviewed above enables us to understand the impacts of Education in Poverty Reduction. And according to different scholars who analyzed the empirics of different countries, it can be proved that education causes to decrease in poverty. The objective of the study is to investigate the influences of some education, demographic, economic, and social factors on poverty of household in Bangladesh.
Methodology Source of Data
The data utilized for the present study are picked out from the Household Income and Expenditure Survey (HIES) 2010, which is a nationally representative survey conducted by Bangladesh Bureau of Statistics (BBS). A two stage stratified random sampling technique was followed in drawing sample of HIES 2010 under the framework of Integrated Multipurpose Sample (IMPS) design developed on the basis of the sampling frame based on the Population and Housing Census 2001. The IMPS design consisted of 1000 Primary Sampling Units (PSUs) throughout the country. There were 640 rural and 360 urban PSUs in the sample. The PSU was defined as contiguous two of more enumeration areas (EA) used in Population and Housing Census 2001. Each PSU
comprised of around 200 households. In the first stage about one half, 612 is in exact out of total 1000 IMPS PSUs, were drawn. These PSUs were selected from 16 different strata. There were 6 rural, 6 urban and 4 SMA strata. In the second stage, 20 households were selected from each of the rural PSUs and also PSUs located in the municipal areas and SMAs. Thus, the HIES is a sub-set of IMPS. In HIES-2010, a total of 12240 households were selected where 7840 from rural area and 4400 from urban area.
Cost of Basic Need Method
For determining poverty status of household as dependent variable, the Cost of Basic Needs (CBN) method is used as the standard method for estimating the incidence of poverty. In this method, two poverty lines are estimated:
I. Lower poverty line II. Upper poverty line
A brief description of estimating incidence of poverty using CBN method is as follows: A. Food poverty line
1. A basic food basket (eleven food items) is selected. The food basket consists of eleven items; rice, wheat, pulses, milk, oil, meat, fish, potato, other vegetables, sugar and fruits, as recommended by Ravallion and Sen (1996), based on Alamgir (1974).
2. The quantities in the basket are scaled according to the nutritional requirement of 2,122 k.cal per person per day.
3. The cost of acquiring the basket is calculated. This estimated cost is taken as the Food Poverty Line (FPL) B. Non-food poverty line
A non-food poverty line is calculated by estimating the cost of consuming non-food items by the households close to the food poverty line.
Lower Poverty Line
The extreme poor households are those households whose total expenditures on food and nonfood combined are equal to or less than the food poverty line.
Upper Poverty Line
The upper poverty line is estimated by adding together the food and nonfood poverty lines. The moderate poor households are those households whose total expenditures are equal to or less than the upper poverty line. Logistic Regression Model
To identify determinants of poverty we first computed a dichotomous variable indicating whether the household is poor or non-poor. That is,
0,1,
Here, for estimating the poverty status of household, we employed the Cost of Basic Need (CBN) method in this study.
On the basis of Pearson's Chi-square statistic, we determine whether the predictors household size, age of household’s head, sex of household’s head, educational level of household head, number of literate member (7 years and above) in household, literate all members (7 years and above), any household member completed graduation or higher education, yearly expenditure on education, employment status of household, monthly income of household, land ownership, construction materials of walls, construction materials of roofs, type of latrine, source of drinking water, division of residence and place of residence were associated with the poverty of household.
Then, we used a Logistic regression model, given by
log !#$"" % ∑ '( ()( = '*+ '#)#+ ',),+∙∙∙∙∙∙∙∙∙∙∙∙∙∙∙∙∙ +'#.)#.
where )#, ),, )/∙∙∙∙∙∙∙∙∙∙∙∙∙∙∙, )#. were the predictor variables household size, age of household’s head, sex of household’s head, educational level of household head, number of literate member (7 years and above) in household, literate all members (7 years and above), any household member completed graduation or higher education, yearly expenditure on education, employment status of household, monthly income of household, land ownership, construction materials of walls, construction materials of roofs, type of latrine, source of drinking water, division of residence and place of residence respectively and p denoted the probability that the household was poor, was used.
For the Study purpose, entre method of binary logistic regression analysis is used. Results and Discussion
Results of Bivariate Analysis
of predictors such as Household size, Age of household’s head, Sex of household’s head, Marital status of household’s head, Educational attainment level of household’s head, Number of literate members (7 years and above) in household, Literate all household’s members (7 years and above), Any household’s member completed graduation or higher education, Yearly expenditure on education, Employment status of household’s head, Monthly income of household, Land ownership (in acre) of household, Construction materials of walls of the main room, Construction materials of roofs of the main room, Type of latrine used by household, Source of drinking water, Division of residence, Place of residence and Religion of household are selected to check whether these variables have association with household’s poverty status. On the basis of the finding of chi-square test are executed.
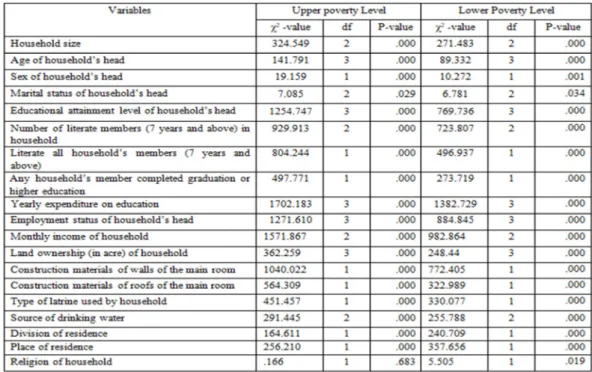
Table 1: Values of Pearson’s χ2-statistic on cross-classifying selected predictors with Poverty Status of Household using both Upper and Lower Level
The result indicates that there exists a highly significant association between poverty status of household and the following predictor variables: Household size, Age of household’s head, Sex of household’s head, Educational attainment level of household’s head, Number of literate members (7 years and above) in household, Literate all household’s members (7 years and above), Any household’s member completed graduation or higher education, Yearly expenditure on education, Employment status of household’s head, Monthly income of household, Land ownership (in acre) of household, Construction materials of walls of the main room, Construction materials of roofs of the main room, Type of latrine used by household, Source of drinking water, Division of residence and Place of residence.
The distribution of households by household size and poverty status results show that the household with 1-2 members, 3-4 members, and 5 and more members, among those 15.1%, 1-24.4% and 36.9% are poor respectively in upper poverty line. Again in lower poverty line, 7.5%, 11.8% and 21.7% household are poor with 1-2 members, 3-4 members, and 5 and more members respectively. The distribution of households by age of household’s head and poverty status results display that in upper poverty line, the households whose head belong to age less than 35 years, age 35-44 years, age 45-59 years, and age 60 years and above, among those, 37.5%, 35.3% and 28.1% households are poor respectively. Again, in lower poverty line, 21.5%, 19.9% and 15.6% households are poor with less than 35 years, 35-44 years, 45-59 years, and 60 years and above aged household head. The result also shows that 32.1% male headed and 26.6% female headed households are poor in upper poverty line. Further, in lower poverty line, 17.9% male headed and 14.6% female headed households are poor. The results indicate that in upper poverty line, 31.4%, 23.3% and 33.9% households are poor, among those whose head are currently married, never married and widowed/ divorced/ separated headed respectively. Again, in lower poverty line, the households whose head are currently married, never married and widowed/ divorced/ separated headed, 17.5%, 10.7% and 19.4% of those households are poor respectively.
The distribution of household by educational attainment level of household’s head and poverty status results illustrate that in upper poverty line, 42.8%, 28.3%, 18.9% and 7.0% households are poor with uneducated, primary education completed, junior secondary education completed and SSC or higher education completed household’s head respectively. Further, in lower poverty line, the households whose head is uneducated, primary
education completed, junior secondary education completed and SSC or higher education completed household head, among those, 25.1%, 14.4% , 8.0% and 3.2% households are poor respectively. The results also show that in upper poverty line, the households whose have no literate member, 1-2 literate members (7 years and above), and 3 and more literate members; 54.1%, 36.6% and 20.8% of those are poor respectively. Further, in lower poverty line, 34.5%, 20.8% and 10.0% households are poor of those households whose have no literate members, 1-2 literate members (7 years and above), and 3 and more literate members respectively. The results shows that in upper poverty line, the households whose all household’s members (7 years and above) are literate and not literate, 11.5% and 37.4% of those households are poor respectively. Further, in lower poverty line, 4.7% and 21.3% households are poor, of those household whose all household’s members (7 years and above) are literate and not literate respectively. It is found that in upper poverty line, the households who’s any household’s member completed graduation or higher education and no household’s member completed graduation or higher education, 3.9% and 34.1% households of those are poor respectively. Again, in lower poverty line, 0.8% and 19.1% households are poor of those household whose any household’s member completed graduation or higher education and no member completed graduation or higher education respectively. The results also display that in upper poverty line, 33.1%, 59.4%, 43.0% and 13.0% households are poor, of those households whose have no expenditure, spent yearly less than Tk.1000, Tk.1000- 5000 and above Tk.5,000 respectively for education purpose. Further, in lower poverty line, the households whose have no expenditure, spent yearly less than Tk.1000, Tk.1000- 5000 and above Tk.5,000 for education purpose, among those, 17.1%, 40.3%, 25.5% and 4.8% households are poor respectively.
The distribution of household by employment status of household’s head and poverty status results indicate that in upper poverty line, 24.0%, 52.1%, 23.2% and 19.7 % unemployed, daily labour, self-employed or employer and employee headed households are poor respectively. Again, in lower poverty line, the households whose head is unemployed, daily labour, self-employed or employer and employee, among those, 12.8%, 31.6%, 12.0% and 9.1% households are poor respectively. The results also mention that in upper poverty line, the household whose monthly income is less than Tk.10,000, Tk.10,000-20,000 and above Tk.20000, 43.9%, 18.3% and 7.0% of those are poor respectively. Further, in lower poverty line, 25.6%, 8.7% and 2.1% households are poor, of those whose monthly income is less than Tk.10,000, Tk.10,000-20,000 and above Tk.20000 respectively. The results also indicate that in upper poverty line, the households whose have no land, less than 1 acre, 1-2 acres and above 2 acres land ownership, among those, 32.7%, 37.3%, 31.8% and 20.6% of those are poor respectively. Again, in lower poverty line, 17.6%, 21.6%, 16.8% and 10.4% households are poor, of those whose have no land, less than 1 acre, 1-2 acres and above 2 acres land ownership respectively.
The distribution of household by construction materials of walls of the main room and poverty status results show that in upper poverty line, 10.5% and 38.7% households are poor with bricked/cemented and non-bricked/cemented walls of the main room respectively. Again, in lower poverty line, 2.8% and 22.6% households are poor with bricked/cemented and non-bricked/cemented walls of the main room respectively. The results also mention that in upper poverty line, the household whose roofs of the main room are constructed by brick/ cement and non-bricked/cemented, 5.3% and 34.6% of those households are poor respectively. Further, in lower poverty line, 1.3% and 19.5% households are poor with bricked/cemented and non-bricked/cemented roofs of the main room respectively. The results also imply that in upper poverty line, the households whose have access to hygienic and unhygienic latrine, 20.8% and 37.6% of those are poor respectively. Again, 10.1% and 21.8% households are poor in lower poverty line, of those whose have access to hygienic and unhygienic latrine respectively. The results also shows that in upper poverty line, the households whose have access to supply water, tube-well and others (pond/river, well, water falls etc.) as source of drinking water, 12.7%, 33.6% and 37.3% of those are poor respectively. Further, in lower poverty line, 3.0%, 19.3% and 18.8% households are poor, of those households whose have access to supply water, tube-well and others (pond/river, well, water falls etc.) as source of drinking water respectively.
According to the division, in upper poverty line, the highest (42.3%) poverty cases have in Rangpur and the lowest (26.2%) poverty cases have in Chittagong. Again, in lower poverty line, the highest 27.7% households are poor in Rangpur and the lowest 13.1% households are poor in Chittagong. The distribution of households by place of residence and poverty status results show that in upper and lower poverty line, 35.2% and 21.1% households in rural are poor respectively. Further, 21.3% and 7.7% unban households are poor in upper and lower poverty line respectively. Again according to religion of household, in upper poverty line, 31.6% Muslim and 31.1% Muslim households are poor. Further, in lower poverty line, 17.8% Muslim and 15.5% non-Muslim households are poor.
Results of Logistic Regression Analysis and Discussion
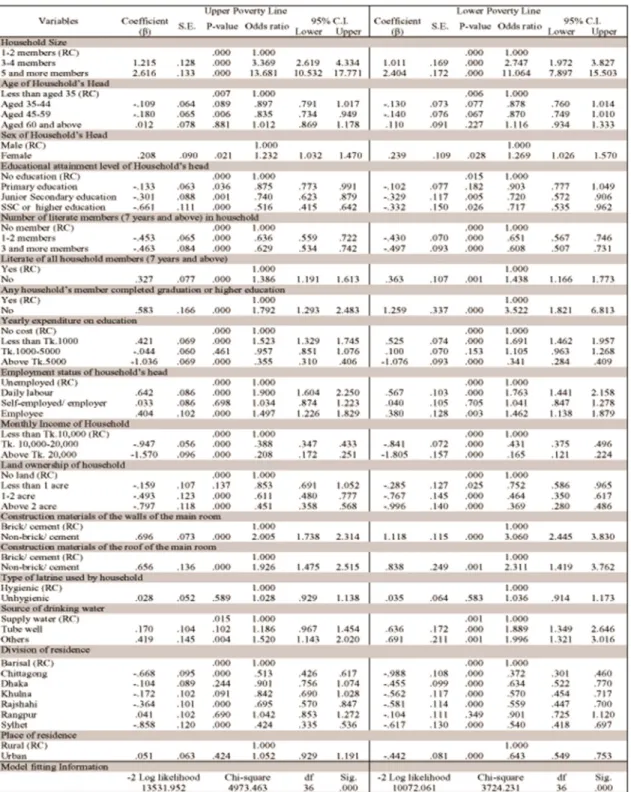
Table: 2 presents the results of the fitted logistic regression model using both upper and lower poverty line separately. In the present analysis, non-poor of household category of outcome variable (Y=0) has been considered as the reference category of dependent variable.
significant with poverty of household using upper poverty line. Again, using lower poverty line, all variables except type of latrine are significant with poverty of household.
The result of logistic analysis shows that the probability of household being poor is highly increased when the household size is increased using both upper (odds ratio: 3.369, 13.681) and lower poverty line (odds ratio: 2.747, 11.064). The results also mention that the probability of a household being poor is comparatively higher with 60 and above aged household’s head as compared to other age group household headed using both poverty lines. Using both upper and lower poverty line, the results illustrate that female headed households are 1.232 and 1.269 times more likely to be poor respectively than male headed households.
The results show that using both poverty lines, the households whose head has no education are more likely to be poor as compared to the households whose head has educated. Using both upper and lower poverty line, the households whose head completed primary education, junior secondary education and SSC or higher education are .875, .740 & .516 times and .903, .720 & .717 times less likely to be poor respectively as compared to those whose head has no education. The results also represent that using both poverty lines, increasing number of literate members in household; the probability of household being poor is decreased. Using upper and lower poverty line, the households with 1-2 members, and 3 and more literate members are .636 & .629 times and .651 & .608 times less likely to be poor respectively as compared to those whose have no literate member. Again, using both upper and lower poverty line, the households whose all members are not literate are 1.386 and 1.438 times more likely to be poor respectively as compared to those whose all members are literate. Further, the results indicate that using both poverty lines, absence a graduate or higher educated member in household, the probability of household being poor are 1.792 and 3.522 times respectively as compared to there are presence it. The results also shows that increasing investment in education, the probability of a household be poor is decreased.
Table 2: Logistic Regression Model for Education and Household’s Poverty Relationship using both Upper and Lower Poverty Line
Using both upper and lower poverty line, the multivariate result shows that the households whose head is daily labour, and employee (odds ratio: 1.900, & 1.497 and 1.763, & 1.462 respectively) are poorer as compared to the household whose head is unemployed. The results illustrate that using both poverty lines; the probability of household being poor is gradually decreased, when monthly income of household is increased. Using both upper and lower poverty line, the odds ratio mentions that the households whose monthly income is Tk.10000-20000, and above Tk.20000 are .388 & .208 times and .431 & .165 times less likely to be poor respectively as compared to those whose monthly income is less than Tk.10,000. Using both upper and lower poverty line, the probability of household’s being poor is decreased gradually with increasing land ownership of household. The households whose have owned less than 1 acre, 1-2 acres and above 2 acres land are .853, .611 & .451 times
and .752, .464 & .369 times less likely to be poor respectively as compared to those have no land.
The results also illustrate that using both upper and lower poverty line, the households whose have non-bricked/cemented walls of the main room are 2.005 and 3.060 times more likely to be poor respectively as compared to those live with bricked/cemented walls. Again, using both upper and lower poverty line, the households with non-bricked/cemented roofs of the main room are 1.926 and 2.311 times more likely to be poor respectively as compared to those have bricked/cemented roofs. Further, using both upper and lower poverty line, the households whose have access to tube well and others source of drinking water are 1.186 & 1.520 and 1.889 & 1.996 times more likely to be poor respectively as compared to the households whose have access to supply water as source of drinking water.
Regional variations are marked with respect to household’s poverty. The logistic result shows that using upper poverty line, the household lives in Sylhet is comparatively less poor (odds ratio: .424) and using lower poverty line, the household lives in Chittagong is comparatively less poor (odds ratio: .372) than the all others divisions. Again, in both poverty lines, the household lives in Rangpur are highest poor than the household lives in other divisions. Using lower poverty line, the logistic model shows that rural households are poorer than urban households.
From the above mentioned discussion, the present study provides information that there exists a strong and effective relationship between poverty and education. The main factors that really play a pivotal role in poverty alleviation are productive quality education. Keeping in the mind these factors, the current economic condition of Bangladesh can be greatly improved by improving the educational conditions.
Conclusion and Recommendation
This study is done to estimate the effect of education on poverty in Bangladesh. The data used for this study is taken from the Household Income and Expenditure Survey (HIES) 2010 conducted by BBS. The results of logistic analysis show that the probability of household being poor is increased, when the size of household is increased in both poverty lines. Thus people should be encouraged to keep their family size small and people should be advised to use contraceptives for spacing and limiting births. Lately the reduction in population growth in Bangladesh has become stagnant. In this situation, policy and decisions makers should review the family planning programs. The study findings displays that female headed household is poorer than male headed household. The employment status of female headed households is very important in addressing the issue of poverty. Policy-makers should continue to implement policies that create employment opportunities for females. The logistic analysis shows that an increase in educational level of household’s head has an impact on the probability of a household being non-poor. Achieving higher education can lead a household from being poor to non-poor. The government of Bangladesh recognizes education is a human rights and a key factor in reducing poverty. Education is a significant tool required to be incorporated in all programs intended to fight poverty. Bangladesh needs to take education seriously since the experience in developing countries has proved its potential in poverty reduction. There is a need for the government of Bangladesh and other stakeholders to improve the quality of education if a positive success in reducing poverty is to be realized. This will involve investing more in education. Again, the study reveals that increasing number of literate members in household, the probability of household being poor is decreased. So, people should be encouraged to send their children in schools or other educational institutions in ensuring education for all members. In this situation, policy and decisions makers should review the policies for achieving and ensuring education for all. The government and NGOs should take a look at the quality of education in all levels.
The results also explain that the probability of household being poor is more times less, when all household’s members (7 year and above) are literate. Presence a graduate or higher educated member in household, the probability of household being poor is more times less than there is absence it. This suggests that there is a need to improve existing access to higher education in order to speed up poverty alleviation. The study shows that increasing investment in education can lead a household from being poor to non-poor. People should be encouraged to invest in education for their child education. The government should consider allocating more financial resources to educational sector, while striving to improve the quality in education and reduce poverty in Bangladesh.
The study also found that daily labour headed households and employee headed households are poorer than unemployed headed household. This then pointed to the need of further investigating into the types of jobs people who are reported to be working are involved in. A policy implication would be that it is not the quantity of jobs that can be a good tool to deal with poverty, but the quality of the job too.
The study shows that the household with low quality of construction materials of walls and roof, and poor sanitation facilities and source of drinking water are poorer as compared to those have high quality. Poverty alleviation efforts should be made to improve housing and sanitation conditions and increase provision of safe drinking water as these are found to be important reasons for poverty in a household. The government should also allot more land to landless households to reduce poverty in Bangladesh. The study result shows that rural
households are poorer than urban households. Poverty alleviation efforts should also be made through grassroots-level planning to raise both farm and nonfarm rural real incomes. This can be done through job creation, micro- and small-scale entrepreneurship.
References
Al-Samarrai S. (2007). Changes in employment in Bangladesh, 2000-2005: The impacts on poverty and gender equity. Working paper prepared for the 2007 Bangladesh poverty assessment, World Bank. Dhaka.
A. M. Khan and I. Islam (2015). Poverty Reduction and Social Development in Bangladesh. Spatial Diversity and Dynamics in Resources and Urban Development. Volume 1: Regional Resources. ISBN 978-94-017-9770-2; ISBN 978-94-017-9771-9 (ebook). DOI 10.1007/ 978--94-017-9771-9. Springer Dordrecht Heidelberg New York London.
Appleton S. (1997). Leaping into the ark: Some reflections on free primary education in Uganda. Cambridge, UK: Centre for the Study of African Economies, University of Oxford.
Asadullah M., N (2005). Returns to education in Bangladesh. Queen Elizabeth House Working Paper Series. Oxford.
Asadullah M., N and S. Rahman (2005). "Farm productivity and efficiency in rural Bangladesh: The role of education revisited." Centre for the study of African economies working paper series. CSAE No.2005-10. Awan M. S., N. Malik, & H. Sarwar (2011). Impact of Education on Poverty Reduction. International Journal of
Academic Research. Vol. 3. No. 1. Part II
Becker G. S. (1993). Human Capital: A Theoretical and Empirical Analysis, with Special Reference to Education, Third Edition, University of Chicago Press.
Bonal X (2007). On global absences: reflections on the failings in the education and poverty relationship in Latin America. International Journal of Educational Development.
Chaudhary, et al. (2010). Does Education Alleviate Poverty? Empirical Evidence from Pakistan. International Research Journal of Finance and Economics, Issue 52.
Espen Dahl E. B. (2009). Low Income and 'Poverty lines' in Norway: A comparison of three concepts. International Journal of Social welfare.
Government of Bangladesh (GOB) (2005). Unlocking the potential: National strategy for accelerated poverty reduction. Dhaka, General Economics Division, Planning Commission: 339.
Hanushek, Eric A., and Ludger Woessmann (2007). The Role of Education Quality for Economic Growth.” Plicy Research Working Paper No. 4122, World Bank, Washington, DC.
Haughton JH, and Khandker SR, (2009). ‘Handbook on Poverty and Inequality’, The World Bank, Washington DC.
Heckman J., Layne-Farrar, A., and Todd, P. (1995). The Schooling Quality–Earnings Relationship: Using Economic Theory to Interpret Functional Forms consistent with the Evidence. National Bureau of Economic Research, NBER Working Paper 5288.
Islam R. (2004): “Labour Market Policies, Economic Growth and Poverty Reduction: Lessons and Non-Lessons from the Comparative Experience of East, South-East and South Asia”. In Employment and Labour Market Dynamics: A Review of Bangladesh’s Development 2002, CPD and UPL, Dhaka.
Janjua P. Z.and Kamal U. A. (2011); The Role of Education and Income in Poverty Alleviation: A Cross-Country Analysis; The Lahore Journal of Economics 16: 1 (Summer 2011): pp. 143-172.
Jimenez E. (1995) “Human and Physical Infrastructure: Public Investment and Pricing Policies in Developing Countries”, in Behrman J. and T. N. Srinivasan eds. Handbook of Development Economics, vol.III, Amsterdam: Elsevier Science Publisher, pp. 2773-2843.
Julius Maiyo, Jane k. Amunga and Irene A. Ashioya (2009). Poverty alleviation: The educational planning perspective. Journal of Education Administration and Policy Studies Vol.1 (2), pp. 015-022, June 2009. Available online at http://www.academicjournals.org/JEAPS © 2009 Academic Journals
Lipton M. and M. Ravallion (1995) “Poverty and Policy”, in Behreman, J. and T. N. Srinivasan eds. Handbook of Development Economics, 3B, Amsterdam: North-Holland.
Murnane, R.J., Willett, J.B., and Levy, F. (1995). The Growing Importance of Cognitive Skills in Wage Determination. The Review of Economics and Statistics, Vol. 77, No. 2, pp. 251–266.
Mursa G. C. (2007). Education and Employment.
Mustafizur K. M. Rahman (2012). POVERTY AT HOUSEHOLD LEVEL. Unnayan Onneshan. Dhaka, Bangladesh. E-mail:info@unnayan.org; Web:www.unnayan.org
Nasir Z. M. & H. Nazli (2000). Education and Earnings in Pakistan. Research Report No. 177. Pakistan Institute of Economics, Islamabad.
Okojie CEE (2002). “Gender and Education as Determinants of Household Poverty in Nigeria”, Discussion Paper No. 2002/37, World Institute for Development Economics Research (WIDER).
No.5.
Sackey H. A. (2005). Poverty in Ghana from an asset-based perspective: An application of probit technique. Blackwell Publishing Ltd, UK.
Schiller B R (2008). The economics of poverty and discrimination. 10th ed. New Jersey: Pearson Prentice Hall Schultz T. (1963). The Economic Value of Education, Columbia University Press.
Sen A., (1992) ‘Inequality reexamined’ Oxford, Oxford University Press.
Shirazi N.S. (1994). An Analysis of Pakistan’s Poverty and its Alleviation through Infaq. (Unpublished doctoral dissertation). International Islamic University, Islamabad.
Tarabini A (2010). Education and poverty in the global development agenda: emergence, evolution and consolidation. International Journal of Educational Development 30: 204-12.
Tilak J. B. G. (2005). Post-elementary Education, Poverty, and Development in India. Post-Basic Education and Training Working Paper Series No. 6, Centre of African Studies, University of Edinburgh.
UNESCO (2001). International Workshop on Education and Poverty Eradication Kampala, Uganda. Retrieved from: http://www.unesco.org/education/poverty/index. (Access on: July 25, 2009).
Sacchidanand Majumder received his M.Phil. degree in Statistics from University of Chittagong, Bangladesh. He also received his B.Sc.(Hons) and M.Sc. in Statistics from University of Chittagong, Bangladesh. Currently, he has been working as a Monitoring Specialist at Dhaka Ahsania Mission (DAM), Bangladesh. His current research interests are education, health, poverty alleviation, water and sanitation, multivariate analysis etc. Soma Chowdhury Biswas is a professor at department of Statistics in the University of Chittagong. She received her B.Sc.(Hons) and M.Sc. in Statistics from University of Dhaka, Bangladesh and M.A. in Demography from ANU Australia and Ph.D. in Biostatistics from RCMPS, University of Chittagong. She is the author of several journal papers. Her current research interests are Markov Chain, GLM and multivariate analysis etc. using health data.