ISSN 1518-3548 CGC 00.038.166/0001-05
Working Paper Series
Edited by:Research Department (Depep) (E-mail: [email protected])
Reproduction permitted only if source is stated as follows: Working Paper Series n. 54. Authorized by Ilan Goldfajn (Deputy Governor for Economic Policy).
General Control of Subscription: Banco Central do Brasil
Demap/Disud/Subip
SBS – Quadra 3 – Bloco B – Edifício-Sede – 2º subsolo 70074-900 Brasília – DF – Brazil
Phone: (5561) 414-1392 Fax: (5561) 414-3165
The views expressed in this work are those of the authors and do not reflect those of the Banco Central or its members. Although these Working Papers often represent preliminary work, citation of source is required when used or reproduced.
As opiniões expressas neste trabalho são exclusivamente do(s) autor(es) e não refletem a visão do Banco Central do Brasil. Ainda que este artigo represente trabalho preliminar, citação da fonte é requerida mesmo quando reproduzido parcialmente.
Banco Central do Brasil Information Bureau Address: Secre/Surel/Diate SBS – Quadra 3 – Bloco B Edifício-Sede – 2º subsolo 70074-900 Brasília – DF – Brazil Phones: (5561) 414 (....) 2401, 2402, 2403, 2404, 2405, 2406 DDG: 0800 992345 Fax: (5561) 321-9453 Internet: http://www.bcb.gov.br E-mails: [email protected] [email protected]
Stock Returns and Volatility
Benjamin Miranda Tabak
*Solange Maria Guerra
*Abstract
This paper examines the relationship between stock returns and volatility over the period of June 1990 to April 2002. We study firm-level relationship between stock returns and volatility for a sample of 25 time series for Brazilian stocks. Using Seemingly Unrelated Regressions (SUR) empirical evidence suggests that contemporaneous returns and volatilities are significantly and positively correlated while there is a negative relationship between changes in volatility and stock returns. Finally, the "leverage effect" seems to hold for Brazilian stocks as shown by the results from an AR (1)-EGARCH(1,1) estimation.
Keywords: Stock Returns, Volatility, Seemingly Unrelated Regressions, EGARCH.
JEL Classification: G10, C53.
*
Research Department, Central Bank of Brazil. Corresponding author’s e-mail address: [email protected]
1. Introduction
A lot of research has been done investigating the relationship between stock returns and volatility for developed markets. Black (1976) and Christie (1982) found that stock prices decline for individual firms raises financial leverage, which resulted in an increase in equity's volatility. They found a negative relationship between changes in volatility and stock returns. Cheung and Ng (1992) using EGARCH models also found evidence of negative relationship between the log of the one-day-ahead conditional volatility and stock returns.
This effect is commonly known in the literature as the "leverage effect". Black (1976) argued that a fall in a firm's stock value relative to the market value of its debt causes a rise in its debt-equity ratio and increases its stock volatility.
French, Schwert and Stambaugh (1987) examine the intertemporal relationship between volatility and expected returns for the U.S. and found evidence that the expected market risk premium is positively related to volatility of stock returns. Cheung and Ng (1992) analyze the relation between stock price dynamics and firm size and found evidence that conditional future volatility of equity returns is negatively related to the level of stock price and that this effect is stronger for small firms and with higher financial leverage.
Theodossiou and Lee (1995) inspect the intertemporal relationship between risk and expected return for ten industrialized countries. The authors use a GARCH in mean model and test for the conditional variance and expected market return relationship. They found no significant relationship between conditional volatility and expected return for any of these countries. Mougoné and Whyte (1996) study the connection between stock returns and volatility for the German and French equity markets. They have found that the impact of volatility on stock returns is insignificant.
De Santis and Imrohoroglu (1997) study the dynamics of expected returns and volatility for emerging markets and found that the level of volatility in emerging markets is considerably higher than that of more mature markets. They also scrutinize the issue of whether liberalization would increase/decrease volatility. They found evidence
suggesting that country-specific risk does not play any role in explaining conditional expected returns.
Duffee (1995) claims that the reason for a negative relationship between stock returns and future changes in stock return volatility is that a positive stock return corresponds to an increase in current volatility. He tested this assertion and found a strong positive contemporaneous relation between firm stock returns and volatility, both using daily and monthly data.
This paper tests whether there is a contemporaneous relation between stock returns and current and future volatility for Brazilian stocks, employing Seemingly Unrelated Regressions. The data covers the period of June 1990 to April 2002. A robustness test has been done analyzing two sub-periods. The first sub-period covers June 1990 to August 1994 while the second August 1994 to April 2002, to account for changes in stock market due to the Real stabilization plan, which has been successful in reducing inflation in Brazil. Empirical evidence suggests that as in the U.S. case studied by Duffee (1995) Brazilian stocks have a positive relationship between stock returns and contemporaneous volatility. Furthermore, using nonparametric techniques we test for firm size, market capitalization and debt/equity ratios as potential explanatory variables for results found.
To the best of our knowledge this is the first paper that addresses the relationship between volatility and stock returns for the Brazilian stock market. This paper focuses on this relationship using two methodologies. The relationship between stock returns and volatility is tested using single regressions methods for the most liquid stocks and Nelson's (1991) exponential GARCH, basically an AR(1)-E-GARCH(1,1) estimation. Results found provide evidence that for the Brazilian stock market there is a strong relationship between stock returns and current volatility.
The paper is organized as follows. In the next section the methodology that is used in the paper is described. Section 3 discusses the data used in the paper and the sampling approach. Section 4 presents empirical results while section 5 concludes the paper.
2. Methodology
Most studies have analyzed the relationship between changes in volatility and stock returns in a single-equation framework similar as in (1).
(
Vt+1 −Vt)
V =α0 +δ0rt +ηt+1 (1)where Vt represents volatility in instant t, rt stands for the current return, α0 and δ0 are
coefficients that can be estimated by Ordinary Least Squares (OLS) and ηt+1 is an error generally assumed to be serially uncorrelated and normally distributed, and V is the average volatility that is used to scale coefficients for all firms. Most studies as Black (1976) and Christie (1982) have found that δ0 is significantly negative. Duffee (1995) has argued that this negative link is due to a positive relationship between stock returns and current volatility.
We follow Duffee (1995) using daily data as a proxy for day t's return volatility the absolute value of day t's return.†. Thus, volatility is defined as Vt = rt . The mean daily absolute return for the entire sample is used to scale estimated coefficients for different firms for daily volatility regressions. Duffee (1995) suggests running (1) and two other regressions. t t t V r V =α1+δ1 +ε (2) 1 2 2 1 + + = + t + t t V r V α δ υ (3)
He found evidence that δ1 is significantly positive for a sample of 2494 North American firms, while a much weaker relation has been found for δ2 depending on the sampling frequency.
We estimate a linear system of equations in which a separate equation is estimated for each firm using generalized least squares. As the coefficients are estimated for overlapping time period’s shocks to returns and volatilities induce dependence between the coefficients. The Seemingly Unrelated Regression (SUR) methodology takes into account such cross-correlations and results in more efficient estimates than ordinary least squares (OLS) estimation. Therefore, a SUR methodology is used.
We analyze the mean coefficients for regressions (1-3) and test for the sign of these coefficients. However in order to make inference on these coefficients we need to correct the standard errors as there is correlation among the coefficients for different stocks. The variance of the mean coefficient VAR
( )
δi,j where the i stands for the i-th firm and the j for the regression type, where j=1, 2 or 3, is given as:( )
δ 1 δ (δ )[
1(
1)
ρ]
1 , , = + − =∑
= N N VAR N VAR VAR j N i j i j i (4) where(
)
∑∑
= ≠ = − = N i ik N j k k N N 1 1 1 1 ρρ and ρikstands for the correlation between coefficients
for different firms, and VAR(δj) is the variance of coefficient δj.
We use the sample variance to estimate this variance and the mean correlation between coefficients running seemingly unrelated regressions for firms.
Another approach that we use in this paper is that we estimate an AR(1)-E-GARCH(1,1) for all stocks and test for the significance of the "leverage effect". The model estimated is given below:
t t t r r =φ0 +φ1 −1 +υ (5a) t t t h ε υ = εt ~ N
( )
0,1 (5b) †Duffee (1995) argue that as daily stocks are characterized by fat tails it is more efficient to estimate volatility relationships with absolute rather than squared residuals.
1 1 1 1 1 log − − − − − + + + = t t t t t t h h σ ε γ σ ε α β ω (5c)
The "leverage effect" is captured by the coefficient γ in (5c). If this coefficient is significant then positive shocks and negative shocks have different impacts on volatility. To test for the association between estimated parameters and firm's size (measured by market capitalization and total assets) and debt equity ratios we use a nonparametric test following Cheung and Ng (1992) and Duffee (1995).
We use Spearman rank correlation that considers paired data
{
(
zi,wi)
;i=1,2,...,n}
. The correlation coefficient is given as:(
)
i i L L w z w z s r r Cov r σ σ , = (6) where L xr is the rank assigned to xi and has a standard deviation L x
σ , where x=
( )
z,w .3. Data Sampling
One of the main problems that emerging markets face is the lack of liquidity for many stocks that are listed in the Exchange. This is not different for the Brazilian stock market.
We have selected stocks from the Index of the São Paulo Stock Exchange (the São Paulo Stock Exchange (BOVESPA) accounts for more than 90% of Brazilian stock market capitalization) as only the most liquid stocks enter the BOVESPA Index.
From the 57 stocks that entered the index only 25 stocks whose price series begun in June 1990 were selected. Differently from Duffee (1995) most stocks have missing observations. Only two stocks, namely Bradesco and Itaú had no missing observations with a total of 2928 observations.
In order to run SUR for these stocks we selected 10 stocks, as we would not have to fill in more than 24 missing observations for these series, which would represent 0.87% of total observations. The SUR was estimated using this 10 stocks representing "continuously traded" firms.
We have also included in our sample the other 15 stocks. Embraer only had 2318 observations for the same time period, representing the stock with the greatest number of missing observations. While Itausa had 2900 observations. All other stocks sample range from 2318 to 2900 observations.
We run OLS regressions with these 15 stocks and analyze the mean coefficients in equations (1-3) adding the 10 "continuously traded" stocks. Thus we have the mean coefficient for 25 stocks, representing the average relationship between stock returns and current and future volatility for the Brazilian stock market.
4. Estimating the relation between stock returns and volatility.
In order to analyze results from regression (1-3) we first test for stationarity of the return and volatility time series. We perform Augmented Dickey and Fuller (1981) unit root tests using a modified Akaike to select the optimal number of lags as suggested in Ng and Perron (1995, 2001).
Table 1 presents results for the unit root tests and evidence suggests that all series can be regarded as stationary as the null of a unit root is rejected in all cases for both stock returns and volatility with 99% level of confidence.
Table 1. Unit Root ADF tests
Firms Returns Volatility
Ambev -36.3482* -6.9382* Bradesco -48.2009* -7.3850* Brasil -52.2031* -7.0667* Cemig -9.2783* -6.5843* Copene -10.8224* -7.2406* Itaú -46.6761* -7.5082* Klabin -9.6629* -6.8132* Petrobras -10.8630* -6.9191* Telesp -9.5276* -7.0632* Vale -14.3941* -7.0206*
The next step is to estimate (1-3) and check the sign of coefficients δ0, δ1 and δ2. Table 2 presents the results using SUR for 10 "continuously traded" stocks. As we can see results are in line with the findings of Duffee (1995). For all stocks coefficient δ0 is significantly negative as in Black (1976), Christie (1982) and Duffee (1995).
Nonetheless, the coefficient δ1 is significantly positive implying a positive contemporaneous relation between stock returns and current volatility. Evidence on the
2
δ coefficient is much weaker.
Table 2. Seemingly Unrelated Regressions of firm stock return volatility on firm stock returns, June 1990 to April 2002, using dollar denominated returns.
Firms δ0 δ1 δ2 Ambev -3.4633* (0.6251) 4.8902* (0.4663) 1.2335* (0.4703) Bradesco -3.3126* (0.5695) 5.7114* (0.4298) 2.0300* (0.4366) Brasil -2.3823* (0.4848) 3.2430* (0.3488) 0.7579** (0.3532) Cemig -3.3904* (0.4207) 4.8046* (0.3131) 1.3786* (0.3204) Copene -2.1649* (0.6195) 5.2948* (0.4579) 2.8258* (0.4633) Itaú -3.0177* (0.5976) 6.9218* (0.4597) 3.5390* (0.4689) Klabin -5.9918* (0.6378) 5.7629* (0.4929) -0.3273 (0.5024) Petrobras -3.2397* (0.4453) 3.3553* (0.3288) 0.0761 (0.3307) Telesp -2.6820* (0.4543) 3.6121* (0.3405) 0.8261** (0.3430) Vale -3.4127* (0.5097) 4.1370* (0.3763) 0.7274*** (0.3801)
* Statistically significant at the 99% confidence level ** Statistically significant at the 95% confidence level *** Statistically significant at the 90% confidence level Standard errors are given in parenthesis.
Despite significance of these coefficients we have found evidence of instability. Using CUSUM test we have found evidence suggesting a structural break in 1994. We have also performed a CHOW test and a structural break could no be rejected for mid 1994. Hence, as robustness checks of the results we perform these SUR for two different sub-periods. The first period begins in June 1990 and ends in August 1994 while the second begins in August 1994 and ends April 2002. Table 3 presents results for the firs
sub-period while table 4 for the second sub-sub-period. CUSUM test show that coefficients are relatively stable for these sub-periods.
As we can see from tables 3 and 4 results are qualitatively the same indicating that when using dollar-denominated returns both periods show strong evidence supporting Duffee's (1995) assertion.
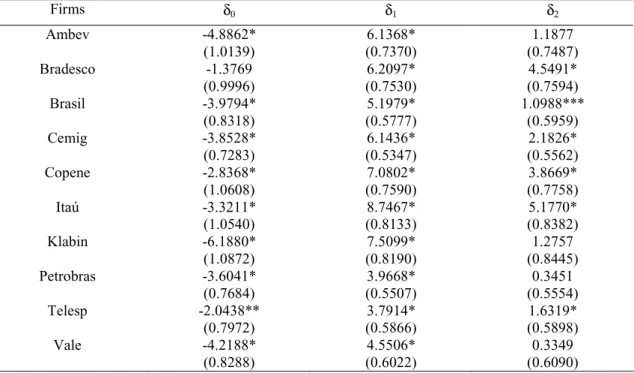
Table 3. Seemingly Unrelated Regressions of firm stock return volatility on firm stock returns, June 1990 to August 1994, using dollar denominated returns.
Firms δ0 δ1 δ2 Ambev -4.8862* (1.0139) 6.1368* (0.7370) 1.1877 (0.7487) Bradesco -1.3769 (0.9996) 6.2097* (0.7530) 4.5491* (0.7594) Brasil -3.9794* (0.8318) 5.1979* (0.5777) 1.0988*** (0.5959) Cemig -3.8528* (0.7283) 6.1436* (0.5347) 2.1826* (0.5562) Copene -2.8368* (1.0608) 7.0802* (0.7590) 3.8669* (0.7758) Itaú -3.3211* (1.0540) 8.7467* (0.8133) 5.1770* (0.8382) Klabin -6.1880* (1.0872) 7.5099* (0.8190) 1.2757 (0.8445) Petrobras -3.6041* (0.7684) 3.9668* (0.5507) 0.3451 (0.5554) Telesp -2.0438** (0.7972) 3.7914* (0.5866) 1.6319* (0.5898) Vale -4.2188* (0.8288) 4.5506* (0.6022) 0.3349 (0.6090)
* Statistically significant at the 99% confidence level ** Statistically significant at the 95% confidence level *** Statistically significant at the 90% confidence level Standard errors are given in parenthesis.
From table 3 we can see that for all 10 stocks the coefficients δ0 have a negative sign as found in previous studies such as in Black (1976), Christie (1982) and Duffee (1995). Even so, we have tested whether the primary reason for this negative relationship would be as suggested by Duffee (1995) that positive returns correspond to increases in current volatility. As we can see, the sign of the δ1 coefficients is significantly positive for all series, which suggest that our sample behaves quite similarly to U.S. stocks.
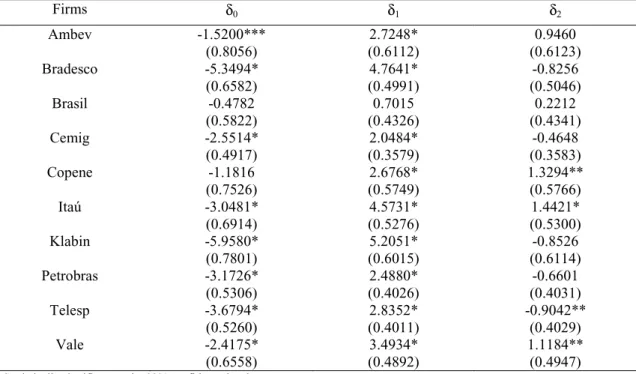
Table 4. Seemingly Unrelated Regressions of firm stock return volatility on firm stock returns, August 1994 to April 2002, using dollar denominated returns.
Firms δ0 δ1 δ2 Ambev -1.5200*** (0.8056) 2.7248* (0.6112) 0.9460 (0.6123) Bradesco -5.3494* (0.6582) 4.7641* (0.4991) -0.8256 (0.5046) Brasil -0.4782 (0.5822) 0.7015 (0.4326) 0.2212 (0.4341) Cemig -2.5514* (0.4917) 2.0484* (0.3579) -0.4648 (0.3583) Copene -1.1816 (0.7526) 2.6768* (0.5749) 1.3294** (0.5766) Itaú -3.0481* (0.6914) 4.5731* (0.5276) 1.4421* (0.5300) Klabin -5.9580* (0.7801) 5.2051* (0.6015) -0.8526 (0.6114) Petrobras -3.1726* (0.5306) 2.4880* (0.4026) -0.6601 (0.4031) Telesp -3.6794* (0.5260) 2.8352* (0.4011) -0.9042** (0.4029) Vale -2.4175* (0.6558) 3.4934* (0.4892) 1.1184** (0.4947)
* Statistically significant at the 99% confidence level ** Statistically significant at the 95% confidence level *** Statistically significant at the 90% confidence level Standard errors are given in parenthesis.
We turn next to analyze aggregate relationships between stock returns and volatility. Table 5 presents results for the mean coefficients for the 10 stocks and uses the corrected standard error suggested in (4). As we can see results are qualitatively the same for the entire sample and for both sub-periods suggesting that there is indeed a strong positive relationship between stock returns and current volatility.
Table 5. Summary of Regressions of firm stock return volatility on firm stock returns. Sample of 10 firms.
Sample Mean δ0 Mean δ1 Mean δ2 June 1990 - April 2002 -3.3057* (0.4103) 4.7733* (0.4840) 1.3067* (0.4835) June 1990 - August 1994 -3.6308* (0.5373) 5.9334* (0.6441) 2.1650* (0.7063) August 1994 - April 2002 -2.9356* (0.6577) 3.1510* (0.5429) 0.1350 (0.3874)
In table 6 we perform OLS regressions on the 15 "non continuously traded" stocks and make some inferences on mean coefficients δ0, δ1 and δ2 for all 25 stocks using corrected standard errors given in (4).
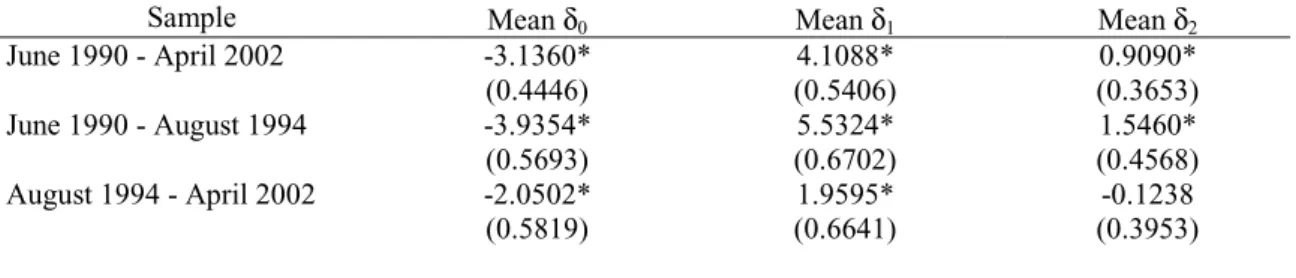
Table 6. Summary of Regressions of firm stock return volatility on firm stock returns. Sample of 25 firms.
Sample Mean δ0 Mean δ1 Mean δ2 June 1990 - April 2002 -3.1360* (0.4446) 4.1088* (0.5406) 0.9090* (0.3653) June 1990 - August 1994 -3.9354* (0.5693) 5.5324* (0.6702) 1.5460* (0.4568) August 1994 - April 2002 -2.0502* (0.5819) 1.9595* (0.6641) -0.1238 (0.3953)
* Rejection of the null with 99% level of confidence
From table 6 we can see that even when taking into account more stocks, results remain qualitatively the same. The relationship between stock returns and future volatility is not clear. In both tables 5 and 6 the coefficient δ2 is not significant for the second sub-period, while it is significantly positive for the first sub-period and when using the entire sample, suggesting some instability. Nonetheless, the coefficient on current volatility (δ1) is significantly positive in all cases but is significantly smaller for the second sub-period (approximately half if we use the reduced sample and one third if we use 25 stocks).
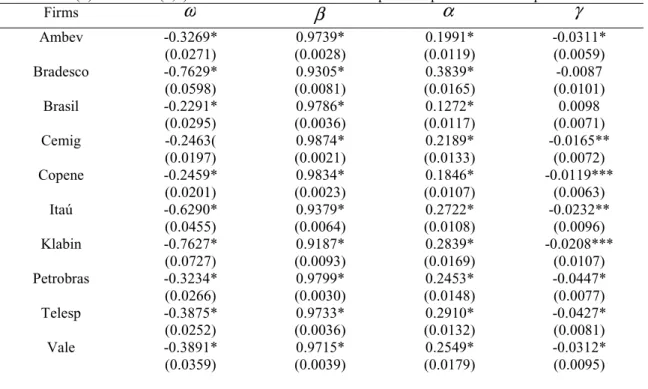
The next step is to present the AR (1)-EGARCH(1,1) estimation. In table 7 we show results for the entire period.
Table 7. AR(1)-EGARCH(1,1) estimates for the 10 stocks sample. Sample: June 1990-April 2002. Firms ω β α γ Ambev -0.3269* (0.0271) 0.9739* (0.0028) 0.1991* (0.0119) -0.0311* (0.0059) Bradesco -0.7629* (0.0598) 0.9305* (0.0081) 0.3839* (0.0165) -0.0087 (0.0101) Brasil -0.2291* (0.0295) 0.9786* (0.0036) 0.1272* (0.0117) 0.0098 (0.0071) Cemig -0.2463( (0.0197) 0.9874* (0.0021) 0.2189* (0.0133) -0.0165** (0.0072) Copene -0.2459* (0.0201) 0.9834* (0.0023) 0.1846* (0.0107) -0.0119*** (0.0063) Itaú -0.6290* (0.0455) 0.9379* (0.0064) 0.2722* (0.0108) -0.0232** (0.0096) Klabin -0.7627* (0.0727) 0.9187* (0.0093) 0.2839* (0.0169) -0.0208*** (0.0107) Petrobras -0.3234* (0.0266) 0.9799* (0.0030) 0.2453* (0.0148) -0.0447* (0.0077) Telesp -0.3875* (0.0252) 0.9733* (0.0036) 0.2910* (0.0132) -0.0427* (0.0081) Vale -0.3891* (0.0359) 0.9715* (0.0039) 0.2549* (0.0179) -0.0312* (0.0095)
* Statistically significant at the 99% confidence level ** Statistically significant at the 95% confidence level *** Statistically significant at the 90% confidence level Standard errors are given in parenthesis.
Residuals for some of these regressions seemed to have some degree of autocorrelation.
We didn't try to find the best model by the means of any information criteria but to estimate a parsimonious model as suggested in the literature. If we include all 25 stocks we have that γ is significantly negative for over 80% of the firms. In only one case this coefficient is significantly positive and for four firms it is not significant. Thus, asymmetric effects on conditional volatility seem to be present form most stocks. A negative γ implies that negative shocks to stock returns tend to have a larger impact than positive shocks a finding that is in line with Cheung ang Ng (1992) and most of the literature.
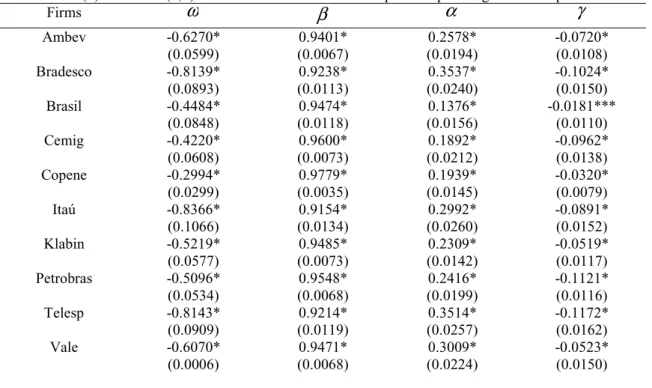
Table 8. AR (1)-EGARCH(1,1) estimates for the 10 stocks sample. Sample: August 1994-April 2002. Firms ω β α γ Ambev -0.6270* (0.0599) 0.9401* (0.0067) 0.2578* (0.0194) -0.0720* (0.0108) Bradesco -0.8139* (0.0893) 0.9238* (0.0113) 0.3537* (0.0240) -0.1024* (0.0150) Brasil -0.4484* (0.0848) 0.9474* (0.0118) 0.1376* (0.0156) -0.0181*** (0.0110) Cemig -0.4220* (0.0608) 0.9600* (0.0073) 0.1892* (0.0212) -0.0962* (0.0138) Copene -0.2994* (0.0299) 0.9779* (0.0035) 0.1939* (0.0145) -0.0320* (0.0079) Itaú -0.8366* (0.1066) 0.9154* (0.0134) 0.2992* (0.0260) -0.0891* (0.0152) Klabin -0.5219* (0.0577) 0.9485* (0.0073) 0.2309* (0.0142) -0.0519* (0.0117) Petrobras -0.5096* (0.0534) 0.9548* (0.0068) 0.2416* (0.0199) -0.1121* (0.0116) Telesp -0.8143* (0.0909) 0.9214* (0.0119) 0.3514* (0.0257) -0.1172* (0.0162) Vale -0.6070* (0.0006) 0.9471* (0.0068) 0.3009* (0.0224) -0.0523* (0.0150)
* Statistically significant at the 99% confidence level *** Statistically significant at the 90% confidence level Standard errors are given in parenthesis.
Residuals for these regressions look much nicer than before. As we can see the leverage coefficient is significant for all stocks and we test for all 25 stocks we find that for 96% of the firms this coefficient is significantly negative a result that is in line with the findings of Cheung and Ng (1992).
The log-likelihood statistics are large for both sub-periods suggesting that the AR(1)-EGARCH(1,1) is a fair representation of daily returns. The EGARCH parameter is statistically significant for all stocks. In both tables the β coefficients are considerably larger than α , which implies that large market surprises induce relatively small revisions in future volatility.
We have also run AR (1)-E-GARCH(1,1)-M estimation and found evidence in line with previous studies for the U.S. and industrialized which have found that the standard deviation in the mean equation is not significant. Out of the 10 "continuously traded" firms only two had a significant M-term.
5. Firm size and leverage
For all firms we have calculated the mean debt/equity ratio, market capitalization and total assets for the entire period and for the August 1994 April 2002 sub-period.
We have used Spearman rank correlation (nonparametric statistic) to check whether the magnitude of the coefficients in the regressions relating volatility and stock returns and in the AR (1)-EGARCH(1,1) were related to these variables.
Nonetheless, in all cases these correlations were not significant for both the entire sample and for the second sub-period. This could be due to two main factors. In the first place, our sample may not be representative of the entire universe and diversity of Brazilian stocks as is very small. Besides, infrequent trading may have influenced the coefficients on the regressions and should be treated somehow.
6. Conclusions
In this paper we have tested the relationship between stock returns and current and future volatility. In line with the findings of Cheung and Ng (1992) and Duffee (1995) we have found evidence suggesting that stock returns are significantly related to current volatility while the relation with future volatility is much weaker.
We have found that there is a structural break in 1994 in the behavior of stock series dynamics. As coefficients on our regressions are unstable and this period has been identified as the major cause of instability. Therefore, we have presented results for the period prior to August 1994 and afterwards.
Evidence presented using both a SUR methodology and an AR (1)-EGARCH(1,1) estimation suggests that changes in volatility are negatively related to stock returns, a result that has been found in the literature examining this relationship since Black (1976). Many explanations have been given for this phenomenon.
Duffee (1995) has argued that this relationship has been found to be negative due to a positive relation between current volatility and stock returns. This test has been applied to 25 Brazilian stocks and we found evidence that Duffee's hypothesis cannot be rejected.
We have finally used Spearman rank correlation (nonparametric statistic) to check whether the magnitude of the coefficients in the regressions relating volatility and stock returns and in the AR (1)-EGARCH(1,1) were related to variables such as firm size (measured by market capitalization and total assets) and debt/equity ratios. These correlations were not significant for the entire sample and for sub-periods analyzed.
Further analysis on these issues is crucial. An interesting extension of this paper would be to use local currency-denominated returns and tests for exchange rate effects on the results. Furthermore, extending the stocks used in our sample will be of some help. Finally, exploring more in depth issues of infrequent trading and the implications for results obtained in this paper would be interesting.
References
Baillie, R.T. and DeGennaro, R.P., 1990, Stock returns and volatility, Journal of Financial and Quantitative Analysis 25, 203-214.
Black, F., 1976, Studies of stock price volatility changes, Proceedings of the 1976 meetings of the American Statistical Association, Business and Economics Statistics Section (American Statistical Association, Washington, DC) 177-181. Cheung, Yin-Wong and Ng, Lilian K., 1992, Stock price dynamics and firm size: an
empirical investigation, The Journal of Finance 47, 1985-1997.
Christie, A., 1982, The stochastic behavior of common stock variances: Value, leverage, and interest rate effects, Journal of Financial Economics 10, 407-432.
De Santis G. and Imrohoroglu, S., 1997, Stock returns and volatility in emerging financial markets, Journal of International Money and Finance 16, 561-579. Dickey, D.A. and Fuller, W.A., 1981, Likelihood ratio statistics for autoregressive time
series with a unit root, Econometrica 49, 1057-1072.
Duffee, G., 1995, Stock return and volatility: A firm level analysis, Journal of Financial Economics 37, 399-420.
French, K.R., Schwert, G.W. and Stambaugh, R.F., 1987, Expected Stock Returns and Volatility, Journal of Financial Economics 19, 3-29.
Mougoué, M. and Whyte, A.M.,1996, Stock returns and volatility: an empirical investigation of the German and French equity markets, Global Finance Journal
7, 253-263.
Nelson, D.B., 1991, Conditional heteroskedasticity in asset returns: A new approach,
Econometrica 59, 347-370.
Ng, S.and Perron, P., 1995, Unit roots tests in ARMA models with data dependent methods for the selection of the truncation lag, Journal of the Americam statistical Association 90, 268-281.
Ng, S. and Perron, P., 2001, Lag length selection and the construction of unit roots tests with good size and power, Econometrica 69, 1519-1554.
Theodossiou, P. and Lee, U., 1995, Relationship between volatility and expected returns across international stock markets, Journal of Business Finance & Accounting 22, 289-300.
Banco Central do Brasil
Trabalhos para Discussão
Os Trabalhos para Discussão podem ser acessados na internet, no formato PDF,
no endereço: http://www.bc.gov.br
Working Paper Series
Working Papers in PDF format can be downloaded from: http://www.bc.gov.br
1 Implementing Inflation Targeting in Brazil
Joel Bogdanski, Alexandre Antonio Tombini and Sérgio Ribeiro da Costa Werlang
July/2000
2 Política Monetária e Supervisão do Sistema Financeiro Nacional no Banco Central do Brasil
Eduardo Lundberg
Monetary Policy and Banking Supervision Functions on the Central Bank
Eduardo Lundberg
Jul/2000
July/2000
3 Private Sector Participation: a Theoretical Justification of the Brazilian Position
Sérgio Ribeiro da Costa Werlang
July/2000
4 An Information Theory Approach to the Aggregation of Log-Linear Models
Pedro H. Albuquerque
July/2000
5 The Pass-Through from Depreciation to Inflation: a Panel Study
Ilan Goldfajn and Sérgio Ribeiro da Costa Werlang July/2000
6 Optimal Interest Rate Rules in Inflation Targeting Frameworks
José Alvaro Rodrigues Neto, Fabio Araújo and Marta Baltar J. Moreira
July/2000
7 Leading Indicators of Inflation for Brazil
Marcelle Chauvet Set/2000
8 The Correlation Matrix of the Brazilian Central Bank’s Standard Model for Interest Rate Market Risk
José Alvaro Rodrigues Neto
Set/2000
9 Estimating Exchange Market Pressure and Intervention Activity
Emanuel-Werner Kohlscheen Nov/2000
10 Análise do Financiamento Externo a uma Pequena Economia
Aplicação da Teoria do Prêmio Monetário ao Caso Brasileiro: 1991–1998
Carlos Hamilton Vasconcelos Araújo e Renato Galvão Flôres Júnior
Mar/2001
11 A Note on the Efficient Estimation of Inflation in Brazil
Michael F. Bryan and Stephen G. Cecchetti Mar/2001
12 A Test of Competition in Brazilian Banking
13 Modelos de Previsão de Insolvência Bancária no Brasil
Marcio Magalhães Janot
Mar/2001
14 Evaluating Core Inflation Measures for Brazil
Francisco Marcos Rodrigues Figueiredo Mar/2001
15 Is It Worth Tracking Dollar/Real Implied Volatility?
Sandro Canesso de Andrade and Benjamin Miranda Tabak Mar/2001
16 Avaliação das Projeções do Modelo Estrutural do Banco Central do Brasil Para a Taxa de Variação do IPCA
Sergio Afonso Lago Alves
Evaluation of the Central Bank of Brazil Structural Model’s Inflation Forecasts in an Inflation Targeting Framework
Sergio Afonso Lago Alves
Mar/2001
July/2001
17 Estimando o Produto Potencial Brasileiro: uma Abordagem de Função de Produção
Tito Nícias Teixeira da Silva Filho
Estimating Brazilian Potential Output: a Production Function Approach
Tito Nícias Teixeira da Silva Filho
Abr/2001
Aug/2002
18 A Simple Model for Inflation Targeting in Brazil
Paulo Springer de Freitas and Marcelo Kfoury Muinhos
Apr/2001
19 Uncovered Interest Parity with Fundamentals: a Brazilian Exchange Rate Forecast Model
Marcelo Kfoury Muinhos, Paulo Springer de Freitas and Fabio Araújo
May/2001
20 Credit Channel without the LM Curve
Victorio Y. T. Chu and Márcio I. Nakane May/2001
21 Os Impactos Econômicos da CPMF: Teoria e Evidência
Pedro H. Albuquerque Jun/2001
22 Decentralized Portfolio Management
Paulo Coutinho and Benjamin Miranda Tabak June/2001
23 Os Efeitos da CPMF sobre a Intermediação Financeira
Sérgio Mikio Koyama e Márcio I. Nakane Jul/2001
24 Inflation Targeting in Brazil: Shocks, Backward-Looking Prices, and IMF Conditionality
Joel Bogdanski, Paulo Springer de Freitas, Ilan Goldfajn and Alexandre Antonio Tombini
Aug/2001
25 Inflation Targeting in Brazil: Reviewing Two Years of Monetary Policy 1999/00
Pedro Fachada
Aug/2001
26 Inflation Targeting in an Open Financially Integrated Emerging Economy: the Case of Brazil
Marcelo Kfoury Muinhos
27 Complementaridade e Fungibilidade dos Fluxos de Capitais Internacionais
Carlos Hamilton Vasconcelos Araújo e Renato Galvão Flôres Júnior
Set/2001
28 Regras Monetárias e Dinâmica Macroeconômica no Brasil: uma Abordagem de Expectativas Racionais
Marco Antonio Bonomo e Ricardo D. Brito
Nov/2001
29 Using a Money Demand Model to Evaluate Monetary Policies in Brazil
Pedro H. Albuquerque and Solange Gouvêa Nov/2001
30 Testing the Expectations Hypothesis in the Brazilian Term Structure of Interest Rates
Benjamin Miranda Tabak and Sandro Canesso de Andrade
Nov/2001
31 Algumas Considerações sobre a Sazonalidade no IPCA
Francisco Marcos R. Figueiredo e Roberta Blass Staub Nov/2001
32 Crises Cambiais e Ataques Especulativos no Brasil
Mauro Costa Miranda Nov/2001
33 Monetary Policy and Inflation in Brazil (1975-2000): a VAR Estimation
André Minella
Nov/2001
34 Constrained Discretion and Collective Action Problems: Reflections on the Resolution of International Financial Crises
Arminio Fraga and Daniel Luiz Gleizer
Nov/2001
35 Uma Definição Operacional de Estabilidade de Preços
Tito Nícias Teixeira da Silva Filho
Dez/2001
36 Can Emerging Markets Float? Should They Inflation Target?
Barry Eichengreen Feb/2002
37 Monetary Policy in Brazil: Remarks on the Inflation Targeting Regime, Public Debt Management and Open Market Operations
Luiz Fernando Figueiredo, Pedro Fachada and Sérgio Goldenstein
Mar/2002
38 Volatilidade Implícita e Antecipação de Eventos de Stress: um Teste para o Mercado Brasileiro
Frederico Pechir Gomes
Mar/2002
39 Opções sobre Dólar Comercial e Expectativas a Respeito do Comportamento da Taxa de Câmbio
Paulo Castor de Castro
Mar/2002
40 Speculative Attacks on Debts, Dollarization and Optimum Currency Areas
Aloisio Araujo and Márcia Leon
Abr/2002
41 Mudanças de Regime no Câmbio Brasileiro
Carlos Hamilton V. Araújo e Getúlio B. da Silveira Filho Jun/2002
42 Modelo Estrutural com Setor Externo: Endogenização do Prêmio de Risco e do Câmbio
Marcelo Kfoury Muinhos, Sérgio Afonso Lago Alves e Gil Riella
43 The Effects of the Brazilian ADRs Program on Domestic Market Efficiency
Benjamin Miranda Tabak and Eduardo José Araújo Lima
June/2002
44 Estrutura Competitiva, Produtividade Industrial e Liberação Comercial no Brasil
Pedro Cavalcanti Ferreira e Osmani Teixeira de Carvalho Guillén
Jun/2002
45 Optimal Monetary Policy, Gains from Commitment, and Inflation Persistence
André Minella
Aug/2002
46 The Determinants of Bank Interest Spread in Brazil
Tarsila Segalla Afanasieff, Priscilla Maria Villa Lhacer and Márcio I. Nakane
Aug/2002
47 Indicadores Derivados de Agregados Monetários
Fernando de Aquino Fonseca Neto e José Albuquerque Júnior Sep/2002
48 Should Government Smooth Exchange Rate Risk?
Ilan Goldfajn and Marcos Antonio Silveira Sep/2002
49 Desenvolvimento do Sistema Financeiro e Crescimento Econômico no Brasil: Evidências de Causalidade
Orlando Carneiro de Matos
Set/2002
50 Macroeconomic Coordination and Inflation Targeting in a Two-Country Model
Eui Jung Chang, Marcelo Kfoury Muinhos and Joanílio Rodolpho Teixeira
Sep/2002
51 Credit Channel with Sovereign Credit Risk: an Empirical Test
Victorio Yi Tson Chu Sep/2002
52 Generalized Hyperbolic Distributions and Brazilian Data
José Fajardo and Aquiles Farias Sep/2002
53 Inflation Targeting in Brazil: Lessons and Challenges
André Minella, Paulo Springer de Freitas, Ilan Goldfajn and Marcelo Kfoury Muinhos