Özgür Arslan Mehmet Baha Karan Cihan Ek¸si This paper attempts to analyze the impact of board structure attributes on their accounting and stock market performance. Our analyses are built on an emerging market, Turkey for the period between1995and 2006. We conduct our analyses through binary logistic methodology. Our findings show that, while board ownership does not have any im-pact on the accounting performance, it has a fairly positive influence on the stock market performance of firms during the crisis period. Simi-larly, the situation when theceoof a firm is also the chairman of the board is not found to have any impact on the corporate performance of firms, although its negative impact is present during the crisis pe-riod. Moreover, board independence is found to not to have an effect on accounting performance, yet the stock market perceives board inde-pendence positively, both in general and in the crisis periods. Finally, board size has a positive impact , both on the accounting and on the stock market performance of firms, yet the impact on the corporate performance reverts to adverse during the crisis period.
Key Words:board size, board independence,roa, Tobin’sQ jelClassification:g14,g20
Introduction
The main purpose of this study is to examine the impact of board attributes on corporate performance in an emerging market, Turkey. Therefore we examine whether a significant difference exists between board size, board independence, board ownership and their accounting and stock market valuation performance measures, specifically return on assets (roa), and Tobin’sQ.
This study contributes to the limited existing body of literature re-garding the emerging markets from various aspects. First, it provides ad-ditional evidence for determination of the direction of the relationship
Dr Özgür Arslan is an Assistant Professor of Finance in the
Department of Business Administration, Hacettepe University, Turkey. Dr Mehmet Baha Karan is a Professor of Finance in the Department of Business Administration, Hacettepe University, Turkey.
between board structure and firm performance in an emerging mar-ket context. Due to the limited number of studies in this field and the contradictory results obtained, there is still not a consensus on whether board structure improves firm performance in emerging markets. More-over, most empirical research studying the relationship between board structure and corporate performance uses data from theusor other de-veloped economies and provides mixed results.¹However, the ability to generalize these results regarding the board structure-performance rela-tionship may not extend across national boundaries. While the assump-tion of a utility maximizing agent is universal, each country’s regulatory and economic environment, the strength of capital markets, and cur-rent governance practices are diffecur-rent. As a result, the importance and value of various governance structures should be separately examined in each country. Furthermore, this study presents evidence from an emerg-ing market and a civil law country which possesses relatively different characteristics to those of the common law and developed countries that have been extensively studied by the majority of the existing studies in the corporate governance literature.
There have only been a few studies addressing Turkey related with this topic. As compared with the contents of previous studies, this study is the most detailed one that is directed towards examing the performance effects of board structure in Turkey. Moreover, having elaborated an emerging market, one must also take into consideration the fluctuations in the market. Therefore we also study the role of the board attributes during the economic constriction periods in Turkey.
We study the period between1995 and2006 on a total of 999 firm level observations and we conduct our analyses through logistic regres-sions. Despite the finding of Selekler-Goksen and Karatas (2008) that board structure does not have a significant impact on performance, our in–depth analyses goes beyond this finding. Firstly, our findings indicate that while board ownership does not have any impact on the accounting performance, it has a fairly positive influence on the stock market per-formance of firms during the crisis period. Similarly, the situation when theceoof a firm is also the chairman of the board is not found to have any influence on corporate performance of firms, however its negative impact is observed only during the crisis period. Moreover, board inde-pendence is found not to have an affect on accounting performance, yet the stock market perceives board independence positively, not only in general but also during the crisis periods. Finally, our most interesting
results are related to the board size. Generally, board size has a positive impact on both the accounting and the stock market performance of firms. Nevertheless, the impact of board size on the corporate perfor-mance reverts to adverse during the crisis period.
The remainder of the paper proceeds as follows. Section two reviews the related literature and builds hypotheses. Section three explains briefly the data and methodology, and section four reports the results of the analyses of performance measures for the each of the attributes of the board structure. Finally, section five concludes the paper.
Literature Review and Hypothesis Development
The finance literature covers a vast array of research concerning the rela-tionship between board structure and firm performance. In other words, the main two tasks of the board are advising and monitoring the ac-tivities of management. The better these acac-tivities are accomplished the more improvement in corporate performance will be achieved. There-fore this section summarizes the literature and builds the hypotheses.
This paper centers on the departure from a basic model of the owner-manager firm and approach to the separation of ownership from con-trol. In this paper we concentrate on the concept which leads to the agency problem (Jensen and Meckling,1976). The information advan-tage of controller over owners creates potential for opportunistic behav-ior. Therefore, we hypothesize that, as the ownership level of board mem-bers increases, the corporate performance of firms rises in turn, owing to diminished agency problem. At first, Morck, Shleifer, and Vishny (1988) find no robust link between the amount of equity owned by members of the board and firm value. However, through using accounting data, Bhagat, Carey and Elson (1999) show a significant correlation between stock owned by outside directors and company performance. Moreover, Bagnani et al (1994) report a positive relationship between bond returns and the ownership level, whereas Guest, Gosh, Hughes (2006) find in ukfirms that board ownership has a strong positive impact on long run share returns and a weak positive impact on operating performance. Fi-nally Coles, Lemmon and Wang (2008) concludes that ownership does not have any explanatory power on the firm performance measured by Tobin’sQ.
Chairs are special board members who have the job of overseeing the entire board’s activity. However when a manager of a firm is also chair-man of the board in the same firm, then the board is not assumed to
be independent in monitoring and advising activities, because the ob-jectivity in judgment of the performance of the company is likely to be impaired. When the board is independent it can serve as a balance to tip the scales in favor of better corporate performance. Rosenstein and Wy-att (1997) find that independent directors cause stock market investors to give a positive response and increase the market value of the firm. West-phal (1999) emphasizes thatceo’s intervention on the board, or even taking up the chairman position, may end up in diminished involvement and effectiveness of board members by reducing their tendency to con-trol management decision making. Finally, Millstein and Macavoy (1998) find a significant correlation between board independence and superior economic profit.
As for Turkey, Küçükçolak and Özer (2007) show that10.4 percent of all the ise members have separated the responsibilities of ceo and chairman. Furthermore, Kula (2005) studies mostly small and non-listed companies in Turkey and finds that separation of chairman and gen-eral manager positions has a significant positive effect on firm perfor-mance. Nevertheless, through studying both accounting and stock mar-ket data, Bhagat and Black (1999) do not obtain evidence that greater in-dependence results from higher performance. In accord with this, Nickell (1995) states that non-executive directors may not have adequate incen-tives to remove managers when the stock market performance of the firm declines.
Board size is the most elaborated board structure in the corporate fi-nance literature, and in general the relationship between board size and corporate performance is found to be inversely related. Using both To-bin’sQandroaas the performance measures, Yermack (1996) confirms a negative association between board size and firm value because benefits of monitoring from enlarging boards are outweighed by problems asso-ciated with the increased asymmetric information and deteriorated com-munication issues. This result is rooted in the finding of Jensen (1993), which suggests that there is a likelihood that the gap between owner-ship and control expands as the boards gets bigger. As the size of boards increases the percentage of independent directors, who have no or very low ownership in firm, is expected to increase as well.²A recent study by Cheng (2008) also concludes that board size has a negative impact on both the accounting and the stock market performance of the board size. Finally, Coles, Daniels and Navrees (2008) find that there is a U-shaped relationship between the firm size and corporate performance.³
Data and Methodology
This study is built on non-financial firms listed on Istanbul Stock Ex-change (ise). We have a balanced panel including999observations. Our study period is between the years1995and2006. Therefore we are able to study the role of the crisis period on the board structure–corporate per-formance relationship as well. We collect financial data directly from the isewebsite (www.imkb.gov.tr), whereas the ownership data are gathered from theYearbook of Firms,which is issued annually by theise.
Our aim is also to investigate how the relationship between board structure and corporate performance is affected during the crisis years. Therefore we interact every board attribute with a crisis dummy in the regressions. Turkey was adversely affected by the Russian debt default in the year1998due to the contagion effect. Moreover Turkey was severely hit by a domestic financial crisis, which reflected its influence during the years2001and2002. Therefore the crisis dummy takes the value of unity if the observation years coincide with the years1998,2001and2002, and zero otherwise.⁴
We use logistic regression methodology for conducting our analyses. Our estimation technique allows for a binary dependent variable, which rules out the usual regression analysis, including the linear probability model. The probabilities in our model are bounded by zero and unity, hence linear functions are inappropriate for our models given that they are inherently unbounded. In specific, our logit model contains a two state dependent variable, namely: State1= High Corporate Performance and State0 = Low Corporate Performance. Put differently, we assume that the dependent variable is a dummy variable which takes the value of unity if a firm is reported to have a high corporate performance, and zero otherwise. A firm is accepted to have a high (low) corporate performance if the value of its Tobin’sQ(roa) is ranked at the top (bottom)25percent of the sample. We exclude all the observations falling between the top and bottom quartiles of the sample in order to eliminate the shadow variables. Finally the total number of observations falling into the top (bottom) quartile is500(499).
A common representation of the logit model used in our estimation is as follows;
Pti =f(Xti−1,Et−1), (1)
in yeartand takes the value of zero if otherwise. VectorXti−1represents board characteristics of the firm. VectorEt−1represents other attributes of the firm such as the financial attributes. More explicitly, the probabil-ity of having a high corporate performance is a random event and un-known, but can be estimated. The probability of having a high corporate performance is:
P[Yi=1]=p0. (2)
Furthermore, the probability of having a low corporate performance is:
P[Yi=0]=1−p0. (3)
The probabilities are determined by some firm specific variables and
Xiare assumed to come from a logistic distribution function. Then, we can write the probability of having a high corporate performance as a function ofXas follows:
P[Yi=1|X]= 1
1+expjXijβ1
. (4)
Finally, the probability of having low corporate performance would be: P[Yi=0|X]= exp jXjiβ1 1+expjXjiβ1 . (5)
We concentrate on the odds ratios while interpreting the regression results. The coefficients of the model are estimated by the maximum likelihood method. Furthermore, we include the following control vari-ables into the model; age , size, debt maturity structure, leverage and cash holding behavior of the firm.
Results
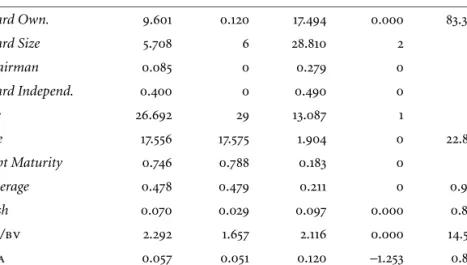
As seen from table1, our first results provide the descriptive statistics on the variables. The average board ownership is found to be only9.6 per-cent. Moreover, the average of persons on the board is5.7.Chairmanis a dummy variable taking the value of1if the manager of the firm is also the chairman of the board, and zero otherwise. Our results show that in most firms managers do not simultaneously work as a chairman on the board.Board Independ.represents board independency and is a dummy
table 1 Descriptive statistics
Variables Mean Median Std. Dev. Minimum Maximum
Board Own. 9.601 0.120 17.494 0.000 83.320 Board Size 5.708 6 28.810 2 45 Chairman 0.085 0 0.279 0 1 Board Independ. 0.400 0 0.490 0 1 Age 26.692 29 13.087 1 95 Size 17.556 17.575 1.904 0 22.885 Debt Maturity 0.746 0.788 0.183 0 1 Leverage 0.478 0.479 0.211 0 0.984 Cash 0.070 0.029 0.097 0.000 0.850 mv/bv 2.292 1.657 2.116 0.000 14.585 roa 0.057 0.051 0.120 –1.253 0.854 notes This table presents descriptive statistics for the whole sample.Board Own. rep-resents total ownership percentages of the board members in the firm.Board Sizeis the total number of members on the board.Chairmanis a dummy variable taking the value of1if the manger of the firm is also the chairman of the board, and zero otherwise.Board Independ.represents board independence and is a dummy variable taking the value of1 if the manager is also a board member, and zero otherwise.Ageis the number of years a firm has been operating.Sizeis the natural logarithm of total assets.Debt Maturityis the ratio of short term debt to total debt.Leverageis the ratio of total debt to total assets.
Cashis the ratio of cash and marketable securities to total assets.mv/bvis calculated as [(Book Value of Assets–Book Value of Equity+Market Value of Equity)]/Book Value of Assets. Finally,Return on Assets(roa) is estimated as net profits scaled by total assets.
variable taking the value of1if the manager is also a board member, and zero otherwise. On average, managers are not found to be a member on boards, since the average value of the dummy variable is0.4. Generally, firms in our sample are found to be young yet large in size. Firms on average hold short maturity of debt and have a fair leverage yet low cash holdings. Finally, firms in the sample have on average high growth op-portunities and a positive return on assets.
Table2presents the Pearson Correlation matrix across the variables. We are assured that we have no threat of multicollinearity since the cor-relation coeffcient does not exceed0.50for any of our variables.
board ownership
We firstly look at the association between ownership levels of board members and the stock market performance of firms. Table 3
demon-table 2 P earson cor re lat ion mat rix Va ri ab le s B oar d O w n . B oar d Size Chair m an B oar d Ind. A ge Size D ebt M at. L eve ra ge Cash Bo ar d O w n . 1 B oar d S ize – 0 . 20 3 * 1 Chair m an 0 . 209 *– 0 . 137 * 1 Bo ar d In d . – 0 . 01 0 0 . 03 6 0 . 098 1 Ag e – 0 . 16 5 *– 0 . 208 *– 0 . 02 1 0 . 06 2 1 Size – 0 . 14 3 * 0 . 16 9 *– 0 . 04 8 0 . 03 9 0 . 15 1 * 1 Debt M at . 0 . 060 – 0 . 053 – 0 . 00 2 0 . 081 – 0 . 095 – 0 . 17 1 * 1 Le ve ra ge – 0 . 00 7 – 0 . 201 * 0 . 06 9 0 . 01 7 – 0 . 06 7 – 0 . 04 3 – 0 . 02 9 1 Cash – 0 . 01 6 0 . 13 4 * 0 . 050 0 . 056 0 . 02 0 0 . 161 * 0 . 03 7 – 0 . 186 * 1 no tes This table p re sents P earson ’s C or re lation mat rix for the main var iables u sed in o ur analysis. Bo ar d O w n . re pr esents to tal o w n ership per centages o f the boar d m embers in the fi rm . B oar d S ize is the total n u mber of members o n the boar d. Chair m an is a d umm y var iable taking the val u e o f 1 if the m anger o f the fir m is also the ch air m an of the b oar d ,a nd ze ro other w ise. Bo ar d In d . R epr esents boar d independency and is a d umm y var iable taking the val ue of 1 if the m anager is also a b oar d member , and ze ro other w ise. Ag e is the n umber o f years a fir m h as been o p er ating . Size is the n atur al log ar ithm o f total assets .D eb tM at . is the rat io of shor t ter m d ebt to total debt. Le ve ra ge is the ratio of to tal d ebt to total assets. Cash is the ratio of cash and m ar ke table secur ities to total assets. mv / bv is calculat ed as [( Bo ok V al u e of A ss et s – B oo k V alue of E quit y + Ma rk et V al u e of Equit y )]/ B oo k V alue of A ss et s. Finally , Re tu rn on As se ts ( ro a ) is estimat ed as net p ro fits scaled b y total assets. * Indicat es that co rr elation is sig nificant at the 5 % le vel (tw o -tailed).
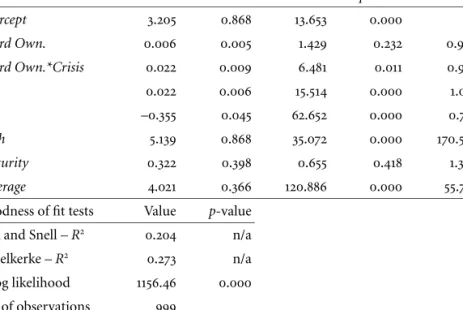
table 3 Board Ownership and the Stock Market Performance
Variables Coefficient Std. Error Wald p-value Odds
Intercept 3.205 0.868 13.653 0.000 Board Own. 0.006 0.005 1.429 0.232 0.994 Board Own.*Crisis 0.022 0.009 6.481 0.011 0.979 Age 0.022 0.006 15.514 0.000 1.023 Size –0.355 0.045 62.652 0.000 0.701 Cash 5.139 0.868 35.072 0.000 170.579 Maturity 0.322 0.398 0.655 0.418 1.380 Leverage 4.021 0.366 120.886 0.000 55.783
Goodness of fit tests Value p-value Cox and Snell– R2 0.204 n/a Nagelkerke– R2 0.273 n/a –2log likelihood 1156.46 0.000 No. of observations 999
notes This table presents the results of the logistic regression, while the independent variable ismv/bv, which is calculated as [(Book Value of Assets–Book Value of Equity+
Market Value of Equity)]/Book Value of Assets.The independent variable is a binary one which takes the value of1if themv/bvof that company is situated at the top25percent of the sample and zero if it is situated at the bottom25percent of the sample.Board Own.represnts total ownership percentages of the board members in the firm.Board Own.*Crisisis an interaction betweenBoard Own.and the crisis years.Crisisis a dummy variable taking the value of1if the observation is at the years1998,2001and2002and zero otherwise.Ageis the number of years a firm has been operating.Sizeis the natural logarithm of total assets.Debt Mat.is the ratio of short term debt to total debt.Leverage
is the ratio of total debt to total assets.Cashis the ratio of cash and marketable securities to total assets.
strates the regression results, where our dependent variable is the dummy variable which takes the value of unity (zero) if the value of Tobin’sQof the firm is situated at the top (bottom) quartile of the sample.
In general, board ownership is not found to have any influence on the stock market performance of firms. However, we see that board own-ership has a positive influence during the crisis period. Specifically, a1 percent increase in the ownership level of board members is likely to have a21percent increase in the stock market performance of that firm. We conclude that investors opt for the firms having owner members on boards during the economic constriction periods.
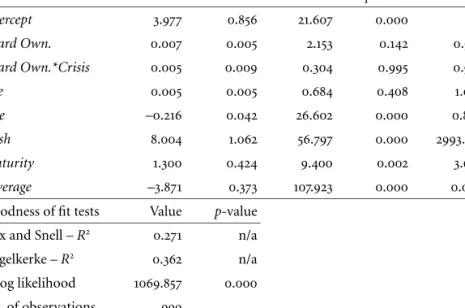
table 4 Board Ownership and the Accounting Performance
Variables Coefficient Std. Error Wald p-value Odds
Intercept 3.977 0.856 21.607 0.000 Board Own. 0.007 0.005 2.153 0.142 0.993 Board Own.*Crisis 0.005 0.009 0.304 0.995 0.978 Age 0.005 0.005 0.684 0.408 1.005 Size –0.216 0.042 26.602 0.000 0.806 Cash 8.004 1.062 56.797 0.000 2993.418 Maturity 1.300 0.424 9.400 0.002 3.668 Leverage –3.871 0.373 107.923 0.000 0.000
Goodness of fit tests Value p-value Cox and Snell– R2 0.271 n/a Nagelkerke– R2 0.362 n/a –2log likelihood 1069.857 0.000 No. of observations 999
notes This table presents the results of the logistic regression, while the independent variable isroa, which is defined as the return on assets and estimated as net profits scaled by total assets. The independent variable is a binary, one which takes the value of 1if theroaof that company is situated at the top25percent of the sample, and zero if it is situated at the bottom25percent of the sample.Board Own.represents total owner-ship percentages of the board members in the firm.Board Own.*Crisisis an interaction betweenBoard Own.and the crisis years.Crisisis a dummy variable taking the value of 1if the observation is at the years1998,2001and2002, and zero otherwise.Ageis the number of years a firm has been operating.Sizeis the natural logarithm of total assets.
Debt Mat.is the ratio of short term debt to total debt.Leverageis the ratio of total debt to total assets.Cashis the ratio of cash and marketable securities to total assets.
seen that, firm age is found to be positively related to Tobin’sQ, whereas firm size is associated with a low stock market performance. As con-firmed by the finding of Arslan, Florackis, and Ozkan (2006) firms with high growth opportunities are found here to hoard a high level of cash. However, despite the highlighted reasoning of a negative association be-tween long term debt and growth opportunities by Myers (1977), we do not find any significant relationship between the variables in this regres-sion.
Our next set of results as presented in table4reveals the relationship between the board ownership and the accounting performance of a firm. Here dependent variable is the dummy variable which takes the value of unity (zero) if the value of theroa of the firm is situated at the top
(bottom) quartile of the sample. Interestingly, we find no relationship between board ownership and the roaof firms. Even the interaction with the crisis period yields an insignificant relationship. Therefore we conclude that ownership of board members does not play a significant role in reducing agency costs and asymmetric information problems in firms.
Regarding the results on the control variables, firm age is not found to have a significant impact on the accounting performance of firms. Firm size has a negative impact on the accounting performance since a one percent increase in firm size reduces theroaby almost20percent. Prof-itable firms are likely to have a higher level of cash flow, and the posi-tive and significant coefficient of the cash–holding variable confirms our reasoning. Profitable firms are found to hold a higher level of short term debt relative to the long term debt. Finally leverage and profitability are found to be negatively related. This finding confirms the pecking order theory of Myers and Majluf (1984) in the sense that profitable firms firstly resort to their internal funds for financing.
manager as a chairman of the board
Here we investigate the situation when aceoof a firm also acts as chair-man of the board. Table5provides the results on the relationship of the separation between the manger and chairman positions in a firm and its stock market performance.
The separation is not found to have any impact on the stock market performance of firms. However the interaction with the crisis dummy shows us that the market perceives the situation when such a separation is not fulfilled in a firm as being a bad signal during the crisis period. Therefore, a one percent increase in the occurrence of an event of non-separation of a managerial and a chairman position in a firm is likely to decrease its stock market performance by66percent. The results on the relationship between the control variables and the stock market perfor-mance go hand in hand with those reported in table3.
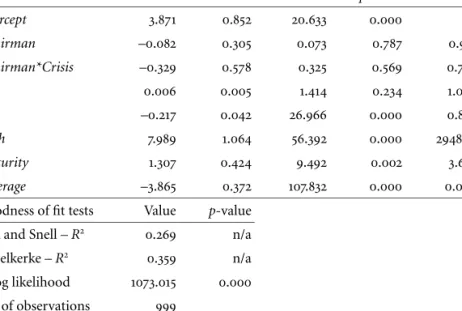
When we move to the impact of the degree of separation between the manager and chairman roles on the accounting performance of firms, we regard the results reported in table6.
Interestingly we can not find a statistically significant relationship be-tween theChairmandummy and the accounting performance, neither in general nor specifically in the crisis period. Therefore we conclude that the non-separation between theceoand chairman positions in a firm is
table 5 Manager as the Chairman of the Board and the stock market performance Variables Coefficient Std. Error Wald p-value Odds
Intercept 2.698 0.883 9.323 0.002 Chairman 0.112 0.286 0.152 0.697 1.118 Chairman*Crisis –1.070 0.532 4.039 0.044 0.343 Age 0.024 0.006 18.663 0.000 1.025 Size –0.339 0.044 58.884 0.000 0.713 Cash 5.242 0.872 36.173 0.000 188.965 Maturity 0.307 0.396 0.598 0.439 1.359 Leverage 3.991 0.363 120.711 0.000 54.128
Goodness of fit tests Value p-value Cox and Snell– R2 0.199 n/a Nagelkerke– R2 0.265 n/a –2log likelihood 1163.62 0.000 No. of observations 999
notes This table presents the results of the logistic regression, while the independent variable ismv/bv, which is calculated as [(Book Value of Assets–Book Value of Equity+
Market Value of Equity)]/Book Value of Assets.The independent variable is a binary one, which takes the value of1if themv/bvof that company is situated at the top25percent of the sample, and zero if it is situated at the bottom25percent of the sample.Chairman
is a dummy variable taking the value of1if manager of the firm is also the chairman of the board, and zero otherwise.Chairman*Crisisis an interaction betweenChairman
and the crisis years.Crisisis a dummy variable taking the value of1if the observation is at the years1998,2001and2002, and zero otherwise.Ageis the number of years a firm has been operating.Sizeis the natural logarithm of total assets.Debt Mat.is the ratio of short term debt to total debt.Leverageis the ratio of total debt to total assets.Cashis the ratio of cash and marketable securities to total assets.
not found to be as hazardous as expected for the accounting performance of firms. In other words, managers, who also hold chairman position in a firm, are not likely to transfer wealth to their benefit at the expense of the shareholders. The results on the control variables align with those reported in table4.
board independence
Table7presents the results of the estimation for a possible relationship between board independence and the stock market performance. Here, we are only interested in the situation in which a manager is only a mem-ber of the board, not a chairman. Therefore the results in this section are different in interpretation to those reported in the previous section.
table 6 Manager as the Chairman of the Board and the accounting performance Variables Coefficient Std. Error Wald p-value Odds
Intercept 3.871 0.852 20.633 0.000 Chairman –0.082 0.305 0.073 0.787 0.921 Chairman*Crisis –0.329 0.578 0.325 0.569 0.720 Age 0.006 0.005 1.414 0.234 1.006 Size –0.217 0.042 26.966 0.000 0.805 Cash 7.989 1.064 56.392 0.000 2948.91 Maturity 1.307 0.424 9.492 0.002 3.695 Leverage –3.865 0.372 107.832 0.000 0.000
Goodness of fit tests Value p-value Cox and Snell– R2 0.269 n/a Nagelkerke– R2 0.359 n/a –2log likelihood 1073.015 0.000 No. of observations 999
notes This table presents the results of the logistic regression, while the independent variable isroa, which is defined as the return on assets and estimated as net profits scaled by total assets. The independent variable is a binary one, which takes the value of 1if theroaof that company is situated at the top25percent of the sample, and zero if it is situated at the bottom25percent of the sample.Chairmanis a dummy variable, taking the value of1if manager of the firm is also the chairman of the board and zero other-wise.Chairman*Crisisis an interaction betweenChairmanand the crisis years.Crisisis a dummy variable, taking the value of1if the observation is at the years1998,2001and 2002, and zero otherwise.Ageis the number of years a firm has been operating.Sizeis the natural logarithm of total assets.Debt Mat.is the ratio of short term debt to total debt.
Leverageis the ratio of total debt to total assets.Cashis the ratio of cash and marketable securities to total assets.
Our results show that board independence is negatively related with Tobin’sQof a firm. A1percent increase in the board independence is ex-pected to decrease the stock market performance by almost74percent. Similarly, board independence is also perceived as a bad signal during the crisis period. Observing a1 percent increase in the board indepen-dence is likely to decrease the stock market performance by almost 63 percent. The results concerning the control variables are in accord with those previously reported.
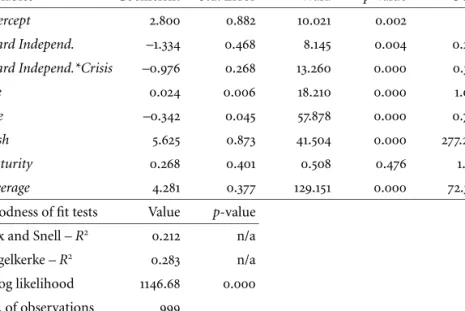
Our next results are reported in table7and they demonstate the direc-tion of the associadirec-tion between board independency and the accounting performance. We find no statistically significant role of board
indepen-table 7 Board Independence and the Stock Market Performance
Variables Coefficient Std. Error Wald p-value Odds
Intercept 2.800 0.882 10.021 0.002 Board Independ. –1.334 0.468 8.145 0.004 0.263 Board Independ.*Crisis –0.976 0.268 13.260 0.000 0.377 Age 0.024 0.006 18.210 0.000 1.025 Size –0.342 0.045 57.878 0.000 0.710 Cash 5.625 0.873 41.504 0.000 277.298 Maturity 0.268 0.401 0.508 0.476 1.331 Leverage 4.281 0.377 129.151 0.000 72.322
Goodness of fit tests Value p-value Cox and Snell– R2 0.212 n/a Nagelkerke– R2 0.283 n/a –2log likelihood 1146.68 0.000 No. of observations 999
notes This table presents the results of the logistic regression, while the independent variable ismv/bv, which is calculated as [(Book Value of Assets–Book Value of Equity+
Market Value of Equity)]/Book Value of Assets. The independent variable is a binary one, which takes the value of1if themv/bvof that company is situated at the top25percent of the sample, and zero if it is situated at the bottom25percent of the sample.Board Independ.represents board independence and is a dummy variable taking the value of 1if the manager is also a board member, and zero otherwise.Board Independ.*Crisisis an interaction betweenBoard Independ.and the crisis years.Crisisis a dummy variable, taking the value of1if the observation is at the years1998,2001and2002, and zero other-wise.Ageis the number of years a firm has been operating.Sizeis the natural logarithm of total assets.Debt Mat.is the ratio of short term debt to total debt.Leverageis the ratio of total debt to total assets.Cashis the ratio of cash and marketable securities to total assets.
dence in the accounting performance of firms, not only in general but also within its interaction with the crisis period. Furthermore, the con-trol variables are identical in sign and significance with the previous find-ings.
We conclude that board independence has an adverse impact on cor-porate performance in general. It is likely that independent board mem-bers in Turkish firms do not have sufficient incentives to monitor man-agement, due to the following reasons. First of all, the executive and non-executive split may be non-artificial for Turkish firms. In other words, the benefits of board members may be informally parallel to those of the managers in expense at the shareholders. Furthermore, there may be an
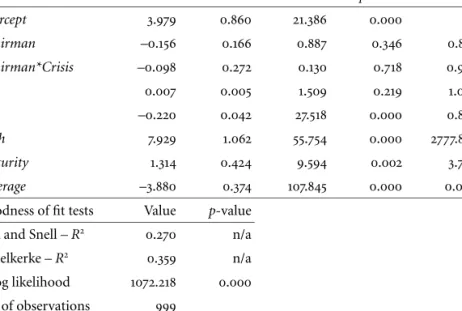
table 8 Board Independence and the Accounting Performance
Variables Coefficient Std. Error Wald p-value Odds
Intercept 3.979 0.860 21.386 0.000 Chairman –0.156 0.166 0.887 0.346 0.856 Chairman*Crisis –0.098 0.272 0.130 0.718 0.907 Age 0.007 0.005 1.509 0.219 1.007 Size –0.220 0.042 27.518 0.000 0.802 Cash 7.929 1.062 55.754 0.000 2777.879 Maturity 1.314 0.424 9.594 0.002 3.720 Leverage –3.880 0.374 107.845 0.000 0.000
Goodness of fit tests Value p-value Cox and Snell– R2 0.270 n/a Nagelkerke– R2 0.359 n/a –2log likelihood 1072.218 0.000 No. of observations 999
notes This table presents the results of the logistic regression, while the independent variable isroa, which is defined as the return on assets and estimated as net profits scaled by total assets. The independent variable is a binary one, which takes the value of1if the roaof that company is situated at the top25percent of the sample, and zero if it is situated at the bottom25percent of the sample.Board Independ.represents board independence and is a dummy variable taking the value of1if the manager is also a board member, and zero otherwise.Board Independ.*Crisisis an interaction between
Board Independand the crisis years.Crisisis a dummy variable taking the value of1if the observation is at the years1998,2001and2002, and zero otherwise.Ageis the number of years a firm has been operating.Sizeis the natural logarithm of total assets.Debt Mat.is the ratio of short term debt to total debt.Leverageis the ratio of total debt to total assets.
Cashis the ratio of cash and marketable securities to total assets.
asymmetry of information between non-executive and executive mem-bers on a board. Therefore, the quality of financial or strategic informa-tion divulged to non-executive members by the executive ones may be poor.
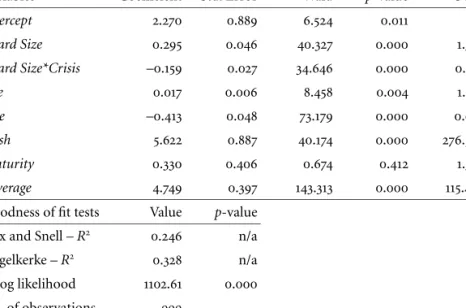
board size
Table9presents results on the relationship between board size and firm performance. In contrast to to the general findings in the literature, board size is found to have a positive impact on the stock market per-formance of firms. Specifically, a1percent increase in the size of a board is likely to increase the stock market performance of firms by1.3times. However board size is found to be negatively affecting the stock market
table 9 Board Size and the Stock Market Performance
Variables Coefficient Std. Error Wald p-value Odds
Intercept 2.270 0.889 6.524 0.011 Board Size 0.295 0.046 40.327 0.000 1.343 Board Size*Crisis –0.159 0.027 34.646 0.000 0.853 Age 0.017 0.006 8.458 0.004 1.017 Size –0.413 0.048 73.179 0.000 0.661 Cash 5.622 0.887 40.174 0.000 276.503 Maturity 0.330 0.406 0.674 0.412 1.395 Leverage 4.749 0.397 143.313 0.000 115.493
Goodness of fit tests Value p-value Cox and Snell– R2 0.246 n/a Nagelkerke– R2 0.328 n/a –2log likelihood 1102.61 0.000 No. of observations 999
notes This table presents the results of the logistic regression, while the independent variable ismv/bv, which is calculated as [(Book Value of Assets–Book Value of Equity+
Market Value of Equity)]/Book Value of Assets.The independent variable is a binary one, which takes the value of1if themv/bvof that company is situated at the top25percent of the sample, and zero if it is situated at the bottom25percent of the sample.Board Sizeis the total number of members on the board.Board Size*Crisisis an interaction between
Board Sizeand the crisis years.Crisisis a dummy variable, taking the value of1if the observation is at the years1998,2001and2002, and zero otherwise.Ageis the number of years a firm has been operating.Sizeis the natural logarithm of total assets.Debt Mat.is the ratio of short term debt to total debt.Leverageis the ratio of total debt to total assets.
Cashis the ratio of cash and marketable securities to total assets.
performance during the crisis period. A1percent increase in the board independence is likely to decrease the stock market performance by al-most15percent. Control variables have similar sign and significance lev-els to those of the previous findings.
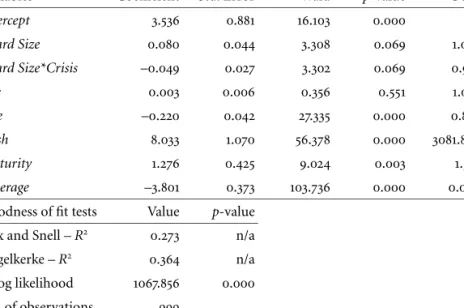
Results in table10show the relationship between board independence and the accounting performance. Similar to the previous findings, board size increases the accounting performance of firms. A1percent increase in the size of the board increases the accounting performance by almost 1.08percent. In a similar fashion, board size has a negative influence on theroaof firms. A 1 unit increase in the board size decreases the ac-counting performance of firms by almost5 units. The significance and signs of the control variables align with those of the previous findings.
table 10 Board Size and the Accounting Performance
Variables Coefficient Std. Error Wald p-value Odds
Intercept 3.536 0.881 16.103 0.000 Board Size 0.080 0.044 3.308 0.069 1.084 Board Size*Crisis –0.049 0.027 3.302 0.069 0.952 Age 0.003 0.006 0.356 0.551 1.003 Size –0.220 0.042 27.335 0.000 0.803 Cash 8.033 1.070 56.378 0.000 3081.806 Maturity 1.276 0.425 9.024 0.003 1.558 Leverage –3.801 0.373 103.736 0.000 0.000
Goodness of fit tests Value p-value Cox and Snell– R2 0.273 n/a Nagelkerke– R2 0.364 n/a –2log likelihood 1067.856 0.000 No. of observations 999
notes This table presents the results of the logistic regression, while the independent variable isroa, which is defined as the return on assets and estimated as net profits scaled by total assets. The independent variable is a binary one, which takes the value of 1if theroaof that company is situated at the top25percent of the sample, and zero if it is situated at the bottom25percent of the sample.Board Sizeis the total number of members on the board.Board Size*Crisisis an interaction betweenBoard Sizeand the crisis years.Crisisis a dummy variable, taking the value of1if the observation is at the years1998,2001and2002, and zero otherwise.Ageis the number of years a firm has been operating.Sizeis the natural logarithm of total assets.Debt Mat.is the ratio of short term debt to total debt.Leverageis the ratio of total debt to total assets.Cashis the ratio of cash and marketable securities to total assets.
effect on the corporate performance through increasing effectiveness in advising the decision-making in a firm through the diversified experi-ence and know-how of the various members. Similarly, the marginal costs of monitoring the managerial activity are observed to be decreasing as the board size increases. However the situation reverts during the crisis period, and board size becomes disadvantageous for the corporate per-formance of firms. It is likely that communication problems arise during the economic downturn times, hence the costs of the board size then outweigh its benefits.
Conclusion
The impact of the attributes of the board structure is not elaborated in detail in the corporate finance literature from an emerging market
per-spective. Therefore, this study shows the relationship between the cor-porate performance, namely the accounting and the stock market per-formance, and the board independence, separation of the tasks of man-agement and chairman, board ownership and the board size. We build our analyses on the a total of999observations of Turkish non-financial listed firms for the period between1995and2006. We conduct our anal-yses through logistic methodology by eliminating the shadow variables. We also study how the relationship is affected during the crisis periods.
Our findings indicate that, while board ownership does not have any impact on the accounting performance, it has a fairly positive influence on the stock market performance of firms during the crisis period. Sim-ilarly, the situation when theceoof a firm is also the chairman of the board is not found to have any impact on the corporate performance of firms, although its negative impact is observed during the crisis period. Moreover, board independence is found not to have affect on accounting performance, yet the stock market perceives board independence pos-itively both in general and in the crisis periods. Finally, our most in-teresting results are related to the board size. Generally, board size has a positive impact on both the accounting and the stock market perfor-mance of firms. Nevertheless, the impact of board size on the corporate performance reverts to adverse during the crisis period.
Notes
1 See among others Hermalin and Weisbach 1991; Agrawal and Knoeber 1996; Brickley, Coles, and Terry1994.
2 In accord with this, Bhagat and Black (1996) find that the median owner-ship percentage of independent directors is1percent.
3 Following this finding we have checked the Turkish data, however our re-sults do not confirm a noneconomic U-shape relationship between board size and bothroaand Tobin’sQ. Therefore, in our analyses, we assume that the association is linear.
4 We also take the1997 Asian crises into account, however the contagion effect of this incidence was midly felt in Turkey. Besides, our results do not change when we include the years1997as a unity dummy in our analyses. References
Agrawal, A., and C. R. Knoeber.1996. Firm performance and mechanisms to control agency problems between managers and shareholders. Jour-nal of Financial and Quantitative AJour-nalysis31(3):377–97.
Arslan, Ö., C. Florackis, and A. Ozkan.2006. The role of cash holdings on investment-cash flow sensitivity: Evidence from a financial crisis period in an emerging market.Emerging Markets Review4(7):320–38. Bagnani, E., N. Milonas, A. Saunders, and N. Travlos.1994. Managers, owners, and the pricing of risky debt: An empirical analysis.Journal of Finance49(2):453–77.
Bhagat, S., and B. Black,1999. The uncertain relationship between board composition and firm performance.Business Lawyer54:921–63. Bhagat, S., D. Carey, and C. Elson.1999. Director ownership, corporate
performance, and management turnover.Business Lawyer54:885–919. Brickley J., J. Coles, and R. Terry.1994. Outside directors and the adoption
of poison pills.Journal of Financial Economics35(3):371–90.
Cheng, S.2008. Board size and variability of corporate performance. Jour-nal of Financial Economics87(2):157–176.
Coles J. L., N. D. Daniel, and L. Naveen.2008. Boards: Does one size fits all.Journal of Financial Economics87(2):329–356.
Coles, J. L., M. Lemmon, and Y. A. Wang.2008. The joint determinants of managerial ownership, board independence, and firm performance. Working Paper. Tempe: Arizona State University.
Hermalin B., and M. Weisbach.1991. The effect of board composition and direct incentives on firm performance.Financial Management21(4): 101–12.
Jensen M.1993. The modern industrial revolution, exit and the failure of internal control system.Journal of Finance48(3):831–80.
Jensen, M., and W. Meckling.1976. Theory of the firm: Managerial behav-ior, agency costs, and ownership structure.Journal of Financial Eco-nomics3(4):305–60.
Kula, V.2005. The impact of the roles, structure and the process of boards on firm performance: Evidence from Turkey. Corporate Governance: An International Review13(2):265–276.
Kücükcolak, A., and L. Özer.2007. Do corporate governance, independent boards and auditors affect market and financial performance: An ap-plication to Istanbul stock exchange.Review of Business28(1):18–31. Millstein, I. M., and P. Macavoy.1998. The active board of directors and
performance of the large publicly traded corporation.Columbia Law Review98(5) :1283–321.
Morck R., A. Shleifer, and R. Vishny.1988. Management ownership and market valuation: An empirical analysis. Journal of Financial Eco-nomics20(1):293–315.
Myers, S. C.1977. Determinants of corporate borrowing.Journal of Finan-cial Economics52(2):147–75.
decisions when firms have information that investors do not have. Journal of Financial Economics13(2):187–221.
Nickel, S.1995.Performance of companies.London: Blackwell.
Rosenstein S., and J. Whatt.1997. Inside directors, board effectiveness and shareholder wealth.Journal of Financial Economics44(2):229–50. Selekler-Goksen, N., and A. Karatas 2008. Board structure and
perfor-mance in an emerging economy: Turkey.International Journal of Busi-ness and Ethics4(2):132–147.
Yermack D. 1996. Higher market valuation of companies with a small board of directors.Journal of Financial Economics40(2):185–211.