THE ANALYSIS OF FINANCIAL PERFORMANCE ON STOCK PRICE
OF PT. BUKIT ASAM Tbk. YEAR 2010 – 2013
Waseso Segoro and Mohamad Septian Andrian [email protected] and [email protected]
Faculty of Economics, Gunadarma University Jl. Margonda Raya No.100, Depok
ABSTRACT
The purpose of this study was to determine the effect of financial performance using a variable current ratio (CR), Net Present Margin (NPM), Return on Assets (ROA), Return on Equity (ROE) and Earnings Per Share (EPS) to the stock price on PT Bukit Asam Tbk during the period 2010-2013. The reason the author chose PT Arpeni Pratama Ocean Line Tbk as the object of the study is that the stock price rose then declined during the study period.
Data collection methods using secondary data that the mining company's annual report in 2010-2013 that enclose all variables needed. The sample used is a mining company that enclose the entire annual report for 2010-2013 and attach all the variables required, the company has been noted that the determination of eligible sample of 16 companies. The analytical tool used is the classic assumption test and multiple regression analysis.
Based on the results of multiple linear regression analysis, the five independent variables (Current Ratio, Net Present Margin, Return on Assets, Return on Equity and Earnings Per Share) jointly (simultaneously) influence the stock price to the value of 4.866 F count> F table 3.357 and 0.016 significance level. Partially only net profit margin variable that significantly influence the stock price with a t value of 3.548> t table with a significance level of 0.005. The results show that only net profit margin (NPM), which affect the stock price caused by the sale of which is currently experiencing lethargy reduced force production company.
Keywords: Current Ratio (CR), Net Present Margin (NPM), Return on Assets (ROA), Return on Equity (ROE) and Earnings Per Share (EPS)
INTRODUCTION
Capital markets have an important role for the economy of a country because of the stock market run two functions, namely as a means for funding a business or as a means for companies to obtain funds from investors or investors. The company that will be chosen by the investors to invest is a healthy company and have management and good corporate performance.
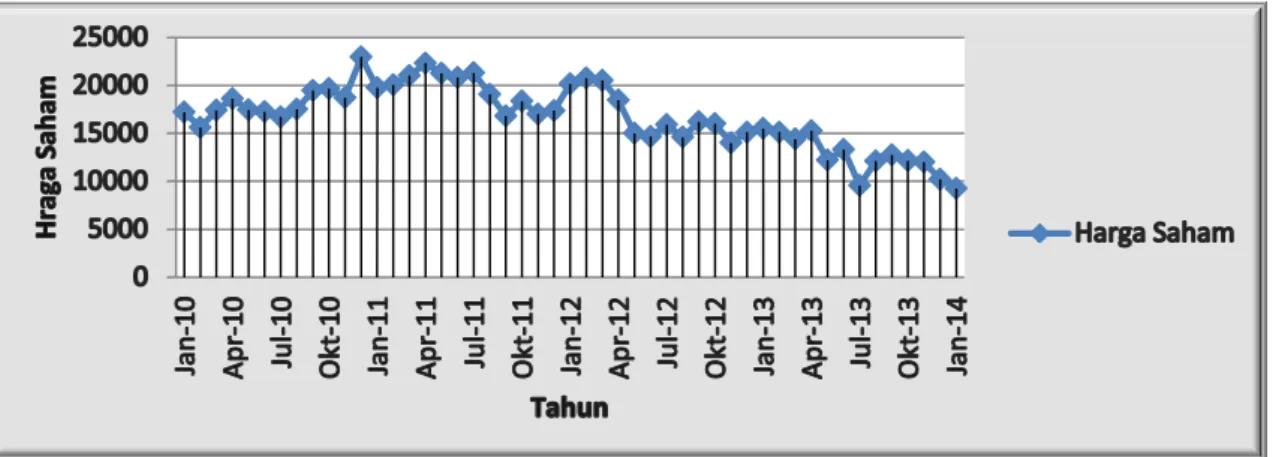
In response to the weakening of the selling price of coal pursuing a strategy for managing the sales margin, ie controlling production costs, increase operational efficiency and focus on selling coking coal to get the selling price baik.Hasilnya, PT Bukit Asam won net profit margin (NPM) In 2013 over 16% amid a decline of coal. The following financial performance data of PT Bukit Asam per quarter.
Figure 1.1: Graph of Shares owned by PT Bukit Asam 2010-2013 Source: Report of Stock Price PT. Bukit Asam
The variables used in this study is the Current Ratio (CR), Net Present Margin (NPM), Return on Assets (ROA), Return on Equity (ROE) and Earnings Per Share (EPS) as the independent variable and the stock price as the dependent variable .
Based on the background of the problem, the purpose of the formulation of this study are as follows:
1. To determine the effect of variables CR, NPM, ROA, ROE and EPS to the stock price of PT Bukit Asam Tbk from 2010 through 2013.
2. To determine the effect of NPM variables to the stock price of PT Bukit Asam Tbk from 2010 through 2013.
3. To determine the effect of ROA to the stock price of PT Bukit Asam Tbk from 2010 through 2013.
4. To determine the effect of ROE on the stock price of PT Bukit Asam Tbk from 2010 through 2013.
5. To determine the effect of variable EPS of the stock price of PT Bukit Asam Tbk from 2010 through 2013.
6. To determine the effect of variables CR, NPM, ROA, ROE and EPS to the stock price of PT Bukit Asam Tbk from 2010 through 2013.
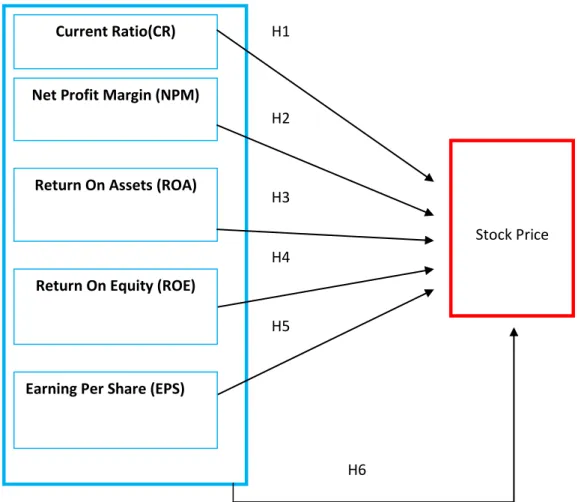
Figure 1.2: Research Framework Research Hypothesis
Based on the research model above, the writer can conclude the following hypothesis: H1 = CR effect on stock prices partially.
H2 = NPM effect on stock prices partially. H3 = ROA effect on stock prices partially. H4 = ROE effect on stock prices partially. H5 = EPS affect stock prices partially.
H6 = CR, NPM, ROA, ROE and EPS affect stock prices simultaneously.
Current Ratio(CR)
Net Profit Margin (NPM)
Stock Price
Return On Assets (ROA)
Return On Equity (ROE)
Earning Per Share (EPS)
H6 H1 H2 H3 H4 H5
Net Profit After Tax Selling
Net Profit After Tax Total Assets
RESEARCH METHODOLOGY A. Object Research
The object of this study is PT Bukit Asam is located at Menara Kadin 15th Floor Jl. Transmitted by Rasuna Said Kav X-5 Block. 2-3
B.Metode Data Collection
In this study, the data used by the authors are secondary data from financial reports monthly and monthly historical data period 2010-2013 were obtained from the website of PT. Bukit Asam is http://ptba.co.id/en/home.
Operational research variables, namely: 1. Variables
The independent variables in this study include: a. Current Ratio (CR)
Jumingan (2006) argues that the current ratio (current ratio) is the ratio obtained by dividing the current assets (current liabilities) and current liabilities. CR can be calculated using the following formula:
Current Ratio (CR) = x 100%
b. Net Profit Margin (NPM)
Net Profit Margin (NPM) is a ratio used to demonstrate the company's ability to generate net profit after tax of NPM can be calculated using the following formula:
Net Profit Margin (NPM) = x 100%
c. Return on Assets (ROA)
ROA is a ratio used to measure the net benefits derived from the use of assets (Lestari and Sugiharto, 2007). ROA can be calculated can be calculated using the following formula:
Return On Assets (ROA)= x 100%
Current Assets Current liabilitie
Net Profit After Tax Capital Owners
Net Profit After Tax Number of Shares
Outstanding
Return On Equity (ROE)
Return On Equity is often called the rate of return on Net Worth that company's ability to generate profits with their own capital owned, so there is a mention ROE as profitability of own capital (Sutrisno, 2008). Here is the formula for calculating the ROE:
Return On Equity (ROE) = x 100%
e. Earning Per Share (EPS)
Earnings per share is the ratio that compares the net profit after tax in the financial year to the number of shares issued. This ratio shows how much the ability to generate earnings per share (Harahap, 2007). The formula for calculating EPS is as follows:
Earning Per Share (EPS) =
2. Variable Bound
The dependent variable in this study is the stock price of PT Bukit Asam Tbk when the closing price at the end of the quarter.
C. Analysis Tools Used
Data analysis was performed quantitative analyzes are expressed with numbers and calculations using statistical methods assisted by SPSS. To determine the effect of independent variables on the dependent variable used analisaberganda. In multiple linear regression, the first step taken is mengujipersyaratan analysis is carried out test data normality, multicollinearity, autocorrelation, and heterokedasitas.
After testing the assumptions of regression, testing the model provisions or commonly known by the significance test that can be measured by the value of the F-statistic (ANOVA), coefficient of determination (R2), the t-test statistic.
Results and Discussion
From the regression model used, there are six hypotheses tested. The result using the classical assumption test (test data normality, multicollinearity, autocorrelation, and heterokedasitas), multiple linear regression analysis and hypothesis testing are shown in the table, as follows: Model Test F (Sig.) Test t Explanation Meaning Sig. Value CR 0,544 0,629
No Effect On The Stock Market
CR good state of condition that does not affect the decline in stocks.
NPM 0,005 3,548 Influential Share Price
NPM state conditions are not so good that affects the stock decline.
ROA 0,855 -0,187
No Effect On The Stock Market
ROA good state of condition so as not to affect the stock decline.
ROE 0,604 0,535
No Effect On The Stock Market
ROE good state of condition so as not to affect the stock decline.
EPS 0,113 -1,739
No Effect On The Stock Market
EPS good state of condition so as not to affect the stock decline.
Regression 0,016 Influential Share Price
From the analysis, the variable that is most dominant and influential NPM.
From the research above, can be obtained by a multiple linear regression equation as follows: Y = 3072.079 + 7.067X1 + 475.900X2 - 233.589X3 + 487.156X4 - 11.957X5 + e Based on the above equation the value obtained constants (α) is 3072,079 show that if the CR, NPM, ROA, ROE, and EPS value (0), then acquisition of stock prices (Y) value is Rp. 3072.079
CONCLUSION
This study aims to investigate the influence of the Current Ratio (CR), Net Profit Margin (NPM), Return on Assets (ROA), Return on Equity (ROE) and Earnings Per Share (EPS) on
stock prices at PT Bukit Asam Tbk. Based on the results of research and discussion, it can be concluded as follows:
1. Significance Value (0,544)> 0.05, then Ho is accepted. So it can be concluded that the CR does not affect the stock price.
2. Significance Value (0.005) <0.05, then Ho is rejected. So it can be concluded that the NPM affect the stock price.
3. Significance Value (0.855)> 0.05, then Ho is accepted. So it can be concluded that ROA does not affect the stock price.
4. The significance value (0.604)> 0.05, then Ho is accepted. So it can be concluded that the ROE does not affect the stock price.
5. The significance value (0.113)> 0.05, then Ho is accepted. So it can be concluded that the EPS did not affect the stock price.
6. The level of significance 0.016 <0.05, it indicates that Ho is accepted and variable CR, NPM, ROA, ROE and EPS jointly have a significant effect on stock prices.
ADVICE
After a discussion and analysis of the fundamentals of PT Bukit Asam Tbk, the author tries to give you advice that may be used as a basis for the company and other parties concerned. The suggestions are as follows:
1. For investors and potential investors are advised to continue to pay attention to fundamentals. If you want to invest it is suggested that invest in companies with good financial performance. PT Bukit Asam Tbk only Net Profit Margin (NPM), which have a significant effect on stock prices. This indicates that the poor performance of this company.
2. In this study proved that the net profit margin (NPM) effect on stock prices, while other variables, namely, the Current Ratio (CR), Return on Assets (ROA), Return on Equity (ROE) and Earnings Per Share (EPS) has no effect significantly influence stock prices, are thus expected PT Bukit Asam Tbk in order to spur themselves to manage sales and improve its financial performance to generate a profit or a bigger profit, so as to attract investors to join and invest their shares in PT Bukit Asam Tbk.
3. Due to the limited time of the study and the selection of the company's fundamentals variables which only consists of a variable current ratio (CR), Net Profit Margin (NPM), Return on Assets (ROA), Return on Equity (ROE) and Earnings Per Share (EPS) . This allows the neglect of other fundamental factors that could potentially have an influence on the stock price of PT Bukit Asam Tbk. Future studies should be able to add a period of research and use other variables as one of the independent variables in order to get more accurate results. In addition, further research can also add other supporting factors such as inflation, interest rates, corporate profits, political and economic conditions should be more attention.
MANAGERIAL IMPLICATIONS
The results of this study indicate that the majority of financial ratios are used by investors to predict the stock price. The results of this study is to formulate a development of previous research that beberpa variables of financial ratios used in the regression model to predict stock prices. Investors should always pay attention to and use of information about the performance of the company (issuer) of the financial ratios, especially for the company that is the ratio of profitability. This is so that investors can make the right decisions in investing.
1.Current ratio
CR very good condition, it can be seen from the condition of current assets that is able to meet its short term obligations so the company must maintain the conditions that will not affect the decline and fall of stock prices.
2.Net Profit Margin
NPM condition was incompatible with the company's expectations, as sales were not as expected so the company had to increase its sales to increase their income so that they would not affect the decline in stock prices.
3.Return On Assets
ROA condition is very good, because the company is able to meet its obligations to investors that the company must maintain the condition that will not affect the decline and fall of stock prices.
4.Return On Equity
ROE condition is very good, because the company is able to meet the total assets as expected even though the conditions of sale are not as expected so the company must maintain the condition that will not affect the decline and fall of stock prices.
5.Earning Per Share
EPS condition is very good, this is because the number of shares issued by companies of interest to investors and increased so that the company must maintain these conditions so that investors will be increased and the existing investors are not out of the company and does not affect the decline in stock prices.
REFERENCES
Harahap, Sofyan Syafri. 2007. Analisis Kritis atas Laporan Keuangan. Jakarta: PT Raja Grafindo Persada.
Http://ptba.co.id/en/home.
Lestari, Maharani Ika dan Toto Sugiharto. 2007. Kinerja Bank Devisa dan Bank Non Devisa dan Faktor-faktor yang Mempengaruhinya. PESAT Vol. 2.
Munawir, S. 2007. Analisa Laporan Keuangan. Yogyakarta: Lyberty Yogyakarta
Priyatno, Duwi. Belajar Cepat Olah Data Statistik dengan SPSS. Yogyakarta : Penerbit ANDI.
Sutrisno. 2008. Manajemen Keuangan Teori, Konsep, dan Aplikasi. Yogyakarta : Ekonisia. Wijaya, Toni. Praktis dan Simpel cepat menguasai SPSS 20 untuk olah dan