Center for Financial Studies Goethe-Universität Frankfurt House of Finance
No. 2008/35
Cognitive Abilities and Portfolio Choice
Dimitris Christelis, Tullio Jappelli,
and Mario Padula
Telefon: +49 (0)69 798-30050 Fax: +49 (0)69 798-30077
Center for Financial Studies
Center for Financial Studies
The Center for Financial Studies is a nonprofit research organization, supported by an association of more than 120 banks, insurance companies, industrial corporations and public institutions. Established in 1968 and closely affiliated with the University of Frankfurt, it provides a strong link between the financial community and academia. The CFS Working Paper Series presents the result of scientific research on selected topics in the field of money, banking and finance. The authors were either participants in the Center´s Research Fellow Program or members of one of the Center´s Research Projects.
If you would like to know more about the Center for Financial Studies, please let us
know of your interest.
Prof. Dr. Jan Pieter Krahnen Prof. Volker Wieland, Ph.D.
* We thank for helpful comments Dimitris Georgarakos, Luigi Guiso, Michalis Haliassos, Mike Hurd, Anna Sanz de Galdeano, and participants to the Conference on Housing and Household Portfolios (Copenhagen, 9-11 June 2005), CSEF-IGIER Symposium on Economics and Institutions (Anacapri, 22-27 June 2005), 4th Conference on Research on Economic Theory and Econometrics (Syros, 11-14 July 2005), 1st Share-ELSA-HRS User Conference (Lund, 26-28 September 2005). This work has been supported by the European Union under contract HPRN-CT-2002-00235 (Economics of Aging in Europe - AGE) and the Italian Ministry of Universities and Research (MUR
1 University of Salerno and CSEF, e-mail: [email protected], work phone: (+39) 089 964435
2 University of Naples Federico II, CSEF, CFS and CEPR, e-mail: [email protected], work phone: (+39) 081 675042
CFS Working Paper No. 2008/35
Cognitive Abilities and Portfolio Choice*
Dimitris Christelis
1, Tullio Jappelli
2, and Mario Padula
3April 27, 2008
Abstract:
We study the relation between cognitive abilities and stockholding using the recent Survey of Health, Ageing and Retirement in Europe (SHARE), which has detailed data on wealth and portfolio composition of individuals aged 50+ in 11 European countries and three indicators of cognitive abilities: mathematical, verbal fluency, and recall skills. We find that the propensity to invest in stocks is strongly associated with cognitive abilities, for both direct stock market participation and indirect participation through mutual funds and retirement accounts. Since the decision to invest in less information-intensive assets (such as bonds) is less strongly related to cognitive abilities, we conclude that the association between cognitive abilities and stockholding is driven by information constraints, rather than by features of preferences or psychological traits.
JEL Classification: E2, D8, G1
1. Introduction
A large body of empirical research documents that many individuals do not invest in stocks and other financial assets. Limited financial market participation has important implications for individual welfare and the explanation of the equity premium puzzle, and is one of the most active areas of research in the field of household finance (Campbell, 2006). The literature relies on transaction and information costs broadly interpreted as the main explanation for why some individuals choose zero holdings for stocks and other financial assets (Haliassos and Bertaut, 1995, Vissing-Jorgensen, 2004). But the exact nature of these costs is not well understood, and the challenge of current research is to single out the factors that prevent large sectors of the population from holding stocks. In this paper we focus on lack of cognitive abilities (such as reading skills and ability to perform simple numerical calculations) as a potential explanation for limited financial market participation.
There are several channels through which cognitive skills might affect the decision to buy stocks and other financial assets. A priori, the sign of the relation is ambiguous. On the one hand, cognitive impairments limit investors’ ability to gather and process information; by increasing the actual or perceived costs of processing information, they can act as a barrier preventing stockholding. Recent research also shows that cognitive abilities tend to be associated with certain features of preferences, such as risk aversion, that reduce the willingness to bear financial risks. On the other hand, low cognitive abilities might be associated with risk misperception and overconfidence, the tendency of some investors to overestimate the precision of one’s information. Overconfident investors trade more and take more financial risk than rational agents with unbiased perceptions. To the extent that overconfidence is more common among low-skill investors, there will be a negative relation between cognitive skills and stockholding. To distinguish between competing explanations, we also estimate the effect of cognitive abilities on the decision to invest in bonds, admittedly a less information-intensive asset than stocks.
In order to study the impact of cognitive factors on stockownership, we exploit within and across country variability in cognitive abilities, stockholding and socioeconomic variables using data drawn from the first release of the Survey of Health, Ageing and Retirement in Europe (SHARE), which surveys people aged 50 and above in 11 European countries: Austria, Belgium,
Denmark, France, Germany, Greece, Italy, Netherlands, Spain, Sweden and Switzerland. The survey asks detailed questions on demographics, physical and mental health, employment, income, assets, social activities, and expectations. All questions are standardized across countries, allowing consistent international comparisons.
Most importantly from the point of view of this paper, the survey has a complete and accurate set of indicators of ability in reading, performing numerical operations, and recalling. Cognitive abilities are known to vary across countries even taking education into account. For instance, evidence from the OECD Programme for International Student Assessment (PISA) shows that among 15 years olds with the same level of schooling there is large international variability in mathematical and science test scores and that there is a consistent North-South gradient in skills. Our sample focuses on the elderly, and in the empirical analysis we need to recognize that the elderly face substantial mortality risk, especially at advanced ages, reducing their planning horizon. Moreover, while the retired face more limited labor income risk, they have much more uncertainty about medical expenditures. Controlling for the potential effects of health status and bequest motives on the willingness to bear financial risk is therefore particularly important in our context.
Understanding the reasons for financial market participation is important in a number of ways. Cocco, Gomes and Maenhout (2005) show that the welfare loss from non-participation in the stock market is between 1.5 and 2 percent of consumption in calibrated life-cycle models. Limited participation and changes in participation over time are relevant also for studying the equity premium puzzle (Mankiw and Zeldes, 1991; Attanasio, Banks and Tanner, 2002), the distribution of wealth (Guvenen, 2006), household choices regarding individual retirement accounts (Bernheim and Garrett, 2003), and wealth effects on consumption (Dynan and Maki, 2001).
From a policy point of view, European pension reforms are likely to increase reliance on individual retirement accounts and investors’ exposure to stock market investment. These investment opportunities will bring higher expected returns, but excessive or ill-advised trading of stocks can significantly reduce realized returns, and poor judgment in allocating retirement wealth can create major financial distress at a point in the life-cycle where the potential for offsetting adjustments is quite limited. Therefore policy intervention to improve the quality of
financial information and investors’ awareness depend crucially on the extent to which cognitive abilities affect financial decisions.
The rest of the paper is organized as follows. Section 2 provides a simple framework to understand how cognition might affect stock market participation. Section 3 describes the microeconomic data and our three indicators of cognitive abilities, and Section 4 the set of variables that will be used in the empirical analysis to explain stockholding decisions. Section 5 presents the empirical results for the probability of investing in stocks, either directly or through mutual funds and investment accounts. The results are summarized in Section 6.
2. The effect of cognitive abilities on stock market participation
Cross-country comparisons offer potentially very useful scenarios to understand household portfolio choice. In countries like Sweden or the US over 50 percent of households have stocks. In Southern Europe the same proportion does not exceed 20 percent. Indeed, within and across countries there is wide heterogeneity in stockholding, in particular with respect to investors’ wealth, education and horizon (Guiso, Haliassos, and Jappelli, 2002; Ameriks and Zeldes, 2004). Recent studies have also found associations between stockholding and background income risk (Guiso, Jappelli and Terlizzese, 1996; Heaton and Lucas, 2000), health status (Rosen and Wu, 2003), culture and social interactions (Grinblatt and Keloharju, 2001; Hong, Kubik and Stein, 2004), computer and Internet use, Bogan (2006), financial literacy (Van Rooij, Alessie, and Lusardi, 2007). Our paper complements this literature studying the relation between cognitive skills and stockholding, and offers also a systematic account of the main factors affecting household portfolio choice in Europe using fully comparable microeconomic data. It represents therefore a significant improvement over previous work based on individual country data.
There are at least three different channels through which cognitive abilities might affect the decision to invest in stocks. First of all, managing a portfolio requires a specific human capital investment, in terms of time and effort needed to familiarize oneself with the notions of transaction costs, asset returns, volatility, and covariance between assets returns. Information costs represent therefore a significant barrier to entry in the stock market. Low cognitive abilities are likely to raise such costs. Campbell (2006) argues that information barriers to invest in stocks
come from psychological factors that make stockownership uncomfortable for some households. Korniotis and Kumar (2006) point out that the perception of having limited abilities might also increase the cost of stock market participation. Low cognitive abilities might increase the perceived cost of investing in the stock market and the case for non-participation.
A second channel between the participation decision and stockholding is the potential relation between cognitive abilities and the curvature of the utility function. Indeed, starting with Kahneman and Tversky (1979), a growing strand of literature challenges the assumptions of
exponential discounting and expected utility maximization.1 Benartzi and Thaler (1995) and
Barberis, Ming and Thaler (2006) cite myopic loss aversion and narrow framing as potential explanations for limited participation in financial markets. Frederick (2005) reports experimental evidence relating cognitive ability, time and risk preferences. Benjamin, Brown, and Shapiro (2006) provide experimental evidence that greater cognitive ability is associated with more
patient and less risk averse behavior.2 Lower cognitive skills would then be associated with a
higher risk aversion coefficient, making participation less likely. Dohmen et al. (2007) find that in a random sample of 1000 German adults, lower cognitive ability is associated with significantly more impatient behavior, and with greater risk aversion, even controlling for educational attainment, income, and measures of credit constraints.
Finally, evidence from psychology shows that poor cognitive skills might be associated with low ability of processing information and that memory affects the ability to perceive conditional probabilities and to distinguish between relevant and irrelevant information (Spaniol and Bayen, 2005). One way to formalize this concept is to posit that poor cognitive skills are associated with overconfidence (Barber and Odean, 2001). Overconfident investors underestimate the risk of stockownership which makes them more likely to hold stocks. Experimental evidence shows that overconfidence differs considerably across individuals and tasks, and that overconfidence is more likely to manifest itself when individuals face relatively
1 For instance, Laibson (1997) replaces exponential discounting with hyperbolic discounting to explain the
co-movement of consumption and income during the life cycle.
2 Benjamin, Brown and Shapiro (2006) find that in the US Longitudinal Survey of Youth mathematical skill is
associated with more asset accumulation, knowledge of pension plans, and greater financial market participation. Here we analyze a sample of mature individuals, and control for a much wider set of variables, including financial wealth, social activities, health status, and education.
difficult tasks, such as finance (Yates, 1990). Individuals with low cognitive abilities might
therefore underestimate financial risks.3
Even though in our data we cannot identify the specific channels (information costs, risk aversion, overconfidence) through which cognitive abilities affect stockholding, we will provide indirect evidence on their relative importance analyzing the relation between cognitive abilities and bondholding. Since bonds are a less information-intensive asset than stocks, if the effect of cognitive functions on stockholding operates mainly through the information channel, one should find a weaker correlation of cognitive abilities with bondholding than with stockholding. Instead, a finding that the correlations are similar would imply that information barriers are not likely to explain the correlation between cognitive abilities and stock market participation
Our paper is also related to the recent literature on financial education, financial literacy, and portfolio choice. Bernheim and Garrett (2003) show that workers’ saving choices are affected by the employer-based programs of financial education. Lusardi and Mitchell (2006) find a negative association between planning for retirement and financial education and Graham, Harvey, and Huang (2005) show that investors who claim to understand investment products hold more efficient portfolios. Van Rooij, Alessie and Lusardi (2007) find that in a Dutch household survey those who have low financial literacy are also less likely to invest in stocks. In contrast to this literature, we consider a broader notion of cognitive abilities which does not suffer from the endogeneity problems of variables based on financial literacy. This helps us to circumvent the causality issue that arises when one finds a positive association between financial education and participation. Indeed, since our indicators will refer to basic numerical, verbal and recall abilities, it is hard to conceive that these skills are affected by stockownership.
3. Measuring cognitive abilities
We study the relation between cognitive abilities and the decision to hold stocks either directly or indirectly, through managed accounts or mutual funds. We use the most recent data release of the Survey of Health, Aging and Retirement in Europe (SHARE), which is a
3 Investor rationality is not however incompatible with the inability to estimate correctly the risk (and return) of
representative sample of the population aged 50+ in 11 European countries. The interviews took
place in 2004, and wealth data refer to December 2003.4,5 The survey covers 19,548 households
and 32,405 individuals, and a wide range of topics, encompassing physical health, socioeconomic status, financial transfers, and intensity of social interaction. Some of the questions refer to the household (for instance, assets) while others are posed to the respondent and partner; for instance, the cognitive ability indicators, an overall assessment of health status, family networks and social
activities.6 In these cases, we combine information on both partners (a more detailed description
can be found in Appendix A.1).
In this section we describe the indicators of cognitive abilities that can be constructed with SHARE and document their international variability and relation with age and education. SHARE devotes a section of the questionnaire on measuring cognitive functions. The cognitive psychology literature identifies four main domains of ability: orientation, memory, executive function and language. These abilities depend on genetic endowment and environmental factors, such as home environment in childhood and education, and change over time, see Richards et al. (2004). SHARE provides results on all these domains, and in this paper we focus on the ones that seem more relevant for financial planning: ability to perform numerical operations (which we term numeracy), planning and executive function (fluency), and memory.
The indicator of numeracy measures the ability to perform basic numerical operations. This, in turn, affects how people make financial decisions and manage their portfolios in a manner that reflects their preferences. SHARE respondents are asked to perform the following simple calculations: (1) find 10 percent of a number; (2) find one half of a number; (3) find the number of which another known number represents two thirds; (4) find 10 percent of another number at the end of 2 years. On the basis of these four questions Dewey and Prince (2005)
making their economic decisions. Namely, low cognitive skills limit the accuracy with which investors estimate stock market returns.
4The SHARE data collection has been primarily funded by the European Commission through the 5th framework
program (project QLK6-CT-2001-00360 in the thematic program Quality of Life). Additional funding came from the US National Institute on Ageing (U01 AG09740-13S2, P01 AG005842, P01 AG08291, P30 AG12815, Y1-AG-4553-01 and OGHA 04-064). Data collection in Austria (through the Austrian Science Foundation, FWF), Belgium (through the Belgian Science Policy Administration) and Switzerland (through BBW/OFES/UFES) was nationally funded. The SHARE data set is introduced in Börsch-Supan et al. (2005).
5 In an earlier working paper (Christelis, Jappelli and Padula, 2006) we used data from a preliminary Release 1 of
construct a numeracy indicator, which ranges from 1 to 5; details on its construction and the questions themselves are given in Appendix A.2. In Figure 1 we report the sample distribution of numeracy (upper-left graph). The sample average is 3.4, and the standard deviation is 1.2. Less than 25 percent of the sample achieves the maximum score (5). Descriptive analysis shows that numeracy is positively associated with education and income, while it is negatively associated with age and self-perceived health.
Executive function is measured by asking the respondent to name as many animals as she or he can in exactly one minute. Each respondent is then given a score, which is equal to the number of animals that she or he can name. We call this indicator “verbal fluency”, or simply fluency. Fluency affects the ability to read and understand written texts, as financial newspaper, and therefore may turn to be an important determinant of portfolio choice. The distribution of fluency is plotted in Figure 1 (upper-right graph). The sample average of fluency is 19.4, and the standard deviation is 8.3. The bulk of the distribution (50 percent of the sample) scores between 14 and 25, but a significant number (10 percent) scores above 32 or below 10.
In order to construct the memory indicator, respondents are first submitted a list of ten words, and then asked to list which ones they remember. The indicator is constructed by counting the number of words recalled, and it ranges from 0, in case no word is recalled, to 10. In the rest of the paper, we will refer to this indicator as recall, borrowing the terminology from the cognitive psychology literature. Recall is at the heart of the ability of comparing facts and situations at distant points in time, and accordingly might play an important role in shaping individual financial decisions. The sample mean the distribution of the memory indicator is 3.6, and the standard deviation is 2.1. Figure 1 (lower graph) shows that 50 percent of the samples scores between 2 and 5, and only 10 percent above 6. The SHARE data also indicate a moderate North-South gradient in cognitive abilities: basic mathematical skills, fluency and memory are higher in Northern than in Southern Europe.
6 The questionnaire and the sample design are patterned after the U.S. Health and Retirement Survey (HRS) and the
English Longitudinal Study of Ageing (ELSA). Börsch-Supan et al. (2005) report details on sampling, response rates and definitions of variables.
Cognitive psychologists and epidemiologists recognize age and education as important
determinants of cognition.7 It is therefore useful to check how much cognitive functions are
related to age and education and if, after controlling for such observables, there is any variation left. This is crucial since both age and education might have a direct effect on portfolio choice, independently of their effect on cognitive functions. Descriptive analysis suggests that cognitive functions decline with age. But we find ample variation in cognitive abilities even among individuals belonging to the same age group. For instance, the coefficient of variation of numeracy is 0.26 in the age group 50-59 and 0.48 for those aged 80 and above. For the same age groups, the coefficient of variation of fluency is 0.35 and 0.54, respectively; for recall, 0.43 and 0.98 respectively.
Our analysis of the relation between cognitive functions and education shows that each of the three indicators is positively associated with education. As with age, there is however ample
variation within each education group: among college graduates,8 the coefficient of variation of
numeracy is 0.20, and the coefficient of variation of fluency and recall are 0.32 and 0.40,
respectively.9
Figure 2 plots the relation between cognitive abilities and stockholding (direct and total). The figure shows that each of the indicators is positively associated with stockholding. For instance, the probability to hold stocks directly increases from 2.5 to 15.3 percent when numeracy increases from 2 to 4, while total stockholding – including also equity mutual funds and investment accounts – increases from 10.2 to 33.3 percent; the two other indicators have similar large and positive effects. The figure also shows that the association between the probability of stockholding and the cognitive indicators is approximately linear. In the rest of the paper we control for many other potential determinants of stockholding, and establish that the association between cognitive abilities and stockholding is a genuine fact, and not the result of spurious
7
Schaie (1989) points out that cognitive decline starts at the age of fifty and that memory is the first function to be affected. Kaplan et al. (2001) study the effect of childhood socio-economic environment on cognitive function in middle age.
8 This includes college degrees as well as degrees granted by vocational schools and technical institutes.
9 The variability of cognitive skills among people with similar level of education is not a unique feature of our data.
For instance, the OECD PISA shows a North-South gradient in mathematical skills among young (less than 15 years old) Europeans with the same level of schooling. Frederick (2005) also reports considerable differences in cognitive abilities among US students.
correlations. We also study which indicator of cognitive abilities is more strongly correlated with stockholding.
4. Empirical specification
While traditional finance theory predicts that investor’s willingness to take financial risks depends only on risk aversion and investment opportunities, dynamic models of portfolio choice emphasize that investment opportunities and wealth itself change over time, that investors usually face other background risks, and that transaction costs, information costs and borrowing constraints limit household financial decisions. Gollier (2001) surveys some of the recent developments. On the empirical front, the literature has sought to single out the variables that are able to explain the patterns of portfolio choice in microeconomic data. In this section we describe how we use SHARE data to study the decision to buy stocks and other financial assets.
4.1. Financial wealth and stockholding
SHARE has detailed information on financial and real assets. Financial assets are grouped in bank and other transaction accounts, government and corporate bonds, stocks, mutual funds, individual retirement accounts, contractual savings for housing, and life insurance policies. The questions on real assets refer to the value of the house of residence, other real estate, business wealth, see Christelis, Jappelli and Padula (2005) for details.
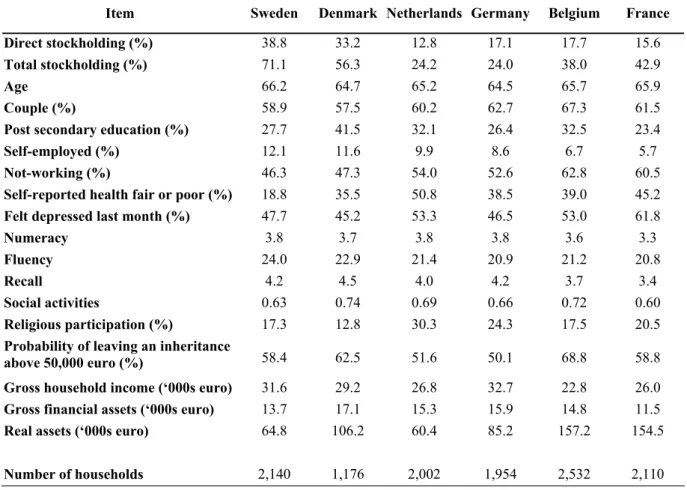
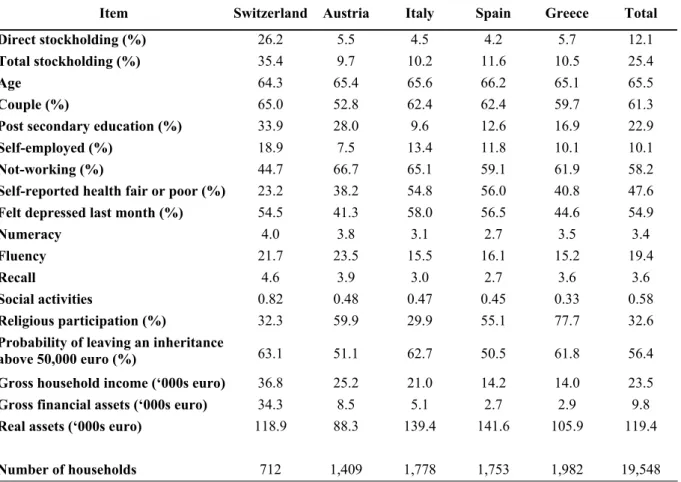
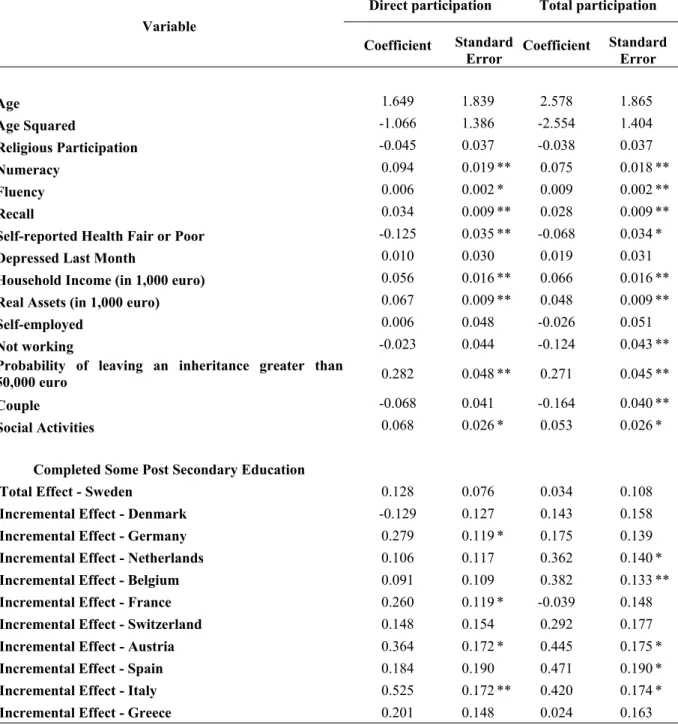
Selected sample statistics by country are reported in Table 1. The average age of the household head is approximately 64-66 years in all countries, while the percentage of couples ranges from 53 percent in Austria to 67 percent in Belgium. Individuals in Denmark, Belgium, the Netherlands and Switzerland are much more likely to have a post-secondary education degree. The share of households where the head (for singles) or both partners (for couples) are not working, either because they are unemployed or because they are retired, ranges between 45 percent in Switzerland to 67 percent in Austria. Household gross financial wealth also varies widely across Europe, with Switzerland clearly above the rest, followed by Sweden, while households in Italy, Spain and Greece report lower gross financial assets. The ranking between
Scandinavian and Mediterranean countries is reversed if one looks at real assets, with median values of around 157,000 euro in Belgium, 139,000 euro in Italy and 65,000 euro in Sweden.
We adopt two definitions of stockownership: direct stockownership and total stockownership, defined as stocks held directly plus stocks held through mutual funds and investment accounts (assuming that whoever holds mutual funds and retirement accounts has
some stocks in them).10 Table 1 reports the direct and total stockholding in the 11 countries of
our sample. Direct stockholding ranges from less than 5 percent in Italy and Spain to 39 percent in Sweden. Total stockholding goes from about 10 percent in Austria, Greece and Italy to 71
percent in Sweden.11 In broad terms there is a negative gradient going from Northern to Southern
Europe, with a group in the middle consisting of France, Germany, Belgium, Netherlands and Switzerland. Sweden and Denmark have by the far the highest percentages of both direct and total stockholding, while Austria, Spain, Greece and Italy are at the other end of the spectrum. The histogram suggests that country effects are potentially quite important in explaining stockholding decisions of European investors. Our regression framework pays therefore particular attention to cross-country interaction effects.
4.2. Health status
While the elderly are unlikely to face significant income risk, except for the inflation risk associated with annuities, they typically face a much higher health risk and therefore controlling for health is quite important in our sample.
There are several channels through which health risk might negatively affect the decision to hold stocks. Edwards (2005) shows that uninsurable morbidity risk induces investors to become effectively more risk averse, thereby reducing the asset share allocated to stocks. He documents this correlation using the Health and Retirement Study (HRS) and the Survey on Assets and Health Dynamics Among the Oldest Old (AHEAD) and finds that current health status and expectations about future health affect negatively the share of risky assets.
Qiu (2004) and Goldman and Maestas (2005) argue that health risks increase the variability of future medical expenditures. As with other background risks, health risks cannot be easily
avoided or diversified, and so investors will tend to reduce exposure to avoidable risks, such as financial risk. This suggests that there is a negative correlation between health risk and stockownership. These studies measure health risk by whether individuals have supplemental insurance and show that the effect of the reduced health risk through insurance is both statistically and economically significant.
A further reason for health to affect stockownership is that health status is correlated with individual resources, along the lines suggested by Smith (1999). Poor health is then associated with low wealth and therefore with less investment in stocks. Rosen and Wu (2004) use the HRS and estimate the relation between health status, asset ownership and asset share invested in risky assets, and find that poor health tends to be negatively related to ownership and investment in risky assets. Rosen and Wu are also able to show that the negative association is not due to the omission of variables that simultaneously affect health and financial decisions, such as planning horizon, risk aversion and health insurance status.
While objective health data are not affected by different reporting styles across individuals
and are therefore more reliable, subjective data describe individual perceptions.12 In our context,
self-reported health status might be even more relevant than objective health indicators. If people buffer health risks by investing less in stocks, it is the perception of such risks (not necessarily their actual presence) that determines financial decisions. Furthermore, using self-reported health status delivers results more easily comparable to other studies using the same variable, such as Rosen and Wu (2004).
Self-reported health status is ranked on a 1-5 scale (1=Excellent, 2=Very Good, 3=Good,
4=Fair, 5=Poor). A high value of the index corresponds therefore to poorer health. Self-assessed
health measures are well known to correlate strongly with objective indicators (Currie and Madrian, 1999), and may directly affect economic behavior. The distribution of self-reported health status indicates that 3.1 percent of households view their health as excellent, 11.3 percent
11 See Engstrom, and Westerberg (2003) for an analysis of stock market participation in Sweden.
12 Empirically, health status is an intrinsically unobservable variable. Researchers generally seek to measure it using
household surveys or medical-administrative records. Currie and Madrian (1999) suggest eight different categories of health indicators: (1) subjective health status; (2) health limitations to the ability to work or to carry normal activities; (3) functional limitations on normal activities; (4) chronic disease; (5) permanent disability; (6) health care utilization; (7) nutritional status, as measured by the body mass index, (8) expected mortality. SHARE has information on all these measures and provides a good means of checking whether these measures are mutually consistent and whether health outcomes can be foretold from subjective feelings about health status (Börsch-Supan et al., 2005).
as very good, 38 percent as good, 34.3 percent as fair and the rest as poor.13 Table 1 shows the percentage of households heads who answer that their health is fair or poor. Interesting differences across countries arise. In Spain and Italy households claim more often that they are in
poor or very poor health, while the they are least likely to report so in Switzerland.14
4.3. Social activities
In addition to the information that investors can collect from media and financial advisors, there are information spillovers from informed to uninformed consumers in the same social circle. Individuals often learn about investment opportunities from others, and how this occurs depends on the specific process of social learning and on how people interact. Previous literature shows that social interaction affects portfolio outcomes.
Duflo and Saez (2002) show that in the US the decision to participate in tax deferred retirement accounts is significantly affected by a similar decision of employees in the same department. Thus, the experience of peers about the performance of their investments is passed on to others. Hong, Kubik and Stein (2004) show that stock market participation is higher among more socially connected individuals. Furthermore, this effect is stronger among individuals living in communities with a higher participation rate to begin with, implying that social learning interacts positively with learning induced by market development.
A related line of research points out that trust is an important determinant of economic exchange, and financial transactions in particular. Guiso, Sapienza and Zingales (2004) find that in Italian provinces with relatively high social trust, the proportion of stockholders is higher, other things equal. People more active socially might have a stronger tendency to trust, and therefore the effect of sociability and trust are difficult to distinguish empirically.
As pointed out by Hong, Kubik and Stein (2004), word-of-mouth and observational learning are two channels through which social interaction might influence stock market
13
Individuals in SHARE are also asked if they suffer from chronic disease and disability. Chronic diseases affect over one third of the sample, and 13 percent report some form of disability (such as blindness, deafness or disabilities limiting mobility).
14 Note that some of these differences may be due to differences in reporting styles across countries that result in
participation. In contrast to their analysis that focuses only on whether people interact with neighbourhoods or take part in religious activities, we can condition on a much larger set of variables.
Our data also allow us to test if social activities amplify or dampen the effect of cognitive ability on the participation decision. In principle, the effect is ambiguous, making the empirical analysis more informative and interesting. On one hand, social learning and cognitive ability can be viewed as complements, in that the effect of cognitive ability is larger among socially connected individuals. On the other, lack of cognitive ability can be supplemented by social learning and therefore cognitive ability is more important among less socially active investors.
In order to construct our indicator of social activities we rely on a set of questions on various kinds of social activities that individuals have performed in the month prior to the interview. The possible activities that we consider as indicating some form of social interaction are (1) participating in a sport, social or other kind of club; (2) taking part in a political or
community-related organization; (3) participation to religious organization.15We convert the first
two activities in dummy variables and construct a household level indicator of social interaction as the sum of the two dummies. We enter religious participation as a separate variable to check if religion is associated with higher stock market participation, as in Hong, Kubik and Stein (2004). Table 1 indicates that household religious activity ranges from approximately 13 percent in Denmark to 78 percent in Greece.
The distribution of the indicator of social activities across countries shows that in Denmark and Switzerland the index is equal to 0.74 and 0.82, meaning that households in these countries have engaged, on average, in approximately 0.78 social activities in the previous month. The level of social interaction in Spain and Greece is lower, averaging only 0.45 and 0.33 activities per household respectively.
When looking at some of the different components of social interaction, Hank and Erlinghagen (2005) find that volunteering displays a strong North-South gradient, just as our constructed index of social activities. In addition, volunteering is positively correlated with participation in organizations and with the provision of informal help and care to other people.
15 SHARE also has information on voluntary work, care for a sick adult, helping family and friends, attendance of an
educational or training course. The coefficients of these indicators were not statistically different from zero and are therefore excluded from the final specification.
Interestingly, they also find that the latter two activities are also more prevalent in Northern than Southern countries, which is surprising since one might expect that providing help in the South, at least within families, would be more prevalent.
4.4. Investors’ horizon and bequest motives
One reason why the portfolio of the elderly might differ from that of other investors is that the elderly face mortality risk, and have, of course, shorter horizons than the non-elderly. The time horizon for a couple as a unit is even shorter (Hurd, 2002). Standard finance theory with CRRA preferences, no background risk and frictionless markets, suggests that portfolio allocations are independent from investors’ horizons. Departing from these assumptions, investors’ horizons affects portfolio allocations, but the relation is far from simple depending, at the very least, on the choice of the utility function, the correlation of income and rate of return shocks, and the presence of transaction costs (Ameriks and Zeldes, 2004).
Even though the theoretical effect of changing the investor’s horizon is ambiguous a priori, Ameriks and Zeldes (2004) present ample evidence that professionals and mutual fund companies suggest reducing stock exposure as the horizon declines. A typical advice is that the asset share invested in stocks should decline with age, for instance that the share should be 100 minus investor’s age. Thus, even if there are no compelling theoretical reasons to reduce risk exposure with age, people might nevertheless do so following standard financial advice.
The time horizon interacts with the bequest motive. While both young and old persons might have a bequest motive, “… for a young person the event of a bequest is so remote as not alter behavior. For the elderly, however, a bequest motive could extend the time horizon, reducing or eliminating any effects of mortality risk” see Hurd (2002, p. 433). For this reason, in our sample of elderly individuals, we control for bequest motives and intention to leave a bequest. Our expectation is that intention to leave a bequest impacts portfolio allocations in the same direction as investors’ horizons.
SHARE contains three questions on the expectation of leaving an inheritance, which are asked to all financial respondents in the household. The first question asked is whether there is a chance that the person interviewed expects to leave an inheritance greater than 50,000 euro. If the answer is affirmative then the next question asked is whether she expects to leave an inheritance
greater than 150,000 euro. If, on the other hand, the answer to the first question is negative, then she is asked whether there is a chance that she will leave any inheritance. We use the first answer to construct an indicator of the probability to leave an inheritance (details on the construction and the original questions can be found in Appendix A.4).
Table 1 reports the distribution of the expected probability of leaving an inheritance across countries, which ranges from 69 percent in Belgium to 50 percent in Germany and Spain. The expectation of leaving an inheritance is strongly positively correlated with current wealth, as shown by Jürges (2005b). He also finds that roughly one third of the households expect to bequeath at least half of their current wealth.
5. Econometric results
To model the participation decision, households compare the utility gain from owning stocks with the entry cost. We express the net utility gain as:
h h
h z
y* 'G H
(1)
where h is the household index, and the observable variables affecting the utility gain from
owning stocks. Utility also depends on unobservable variables, which enter (1) through h
z
h
H , a
standard normally distributed random term. Household h owns stocks if , which implies
that the probability of observing stockownership is
0 * t h y ) (zhG
) . If the unobserved factors Hh are
normally distributed, we can use the probit model and estimate G with standard maximum
likelihood methods.
Our estimation exercise deals carefully also with item non-response. Non-response can bias the estimates and also lead to serious efficiency loss, which can be quite substantial due to the high number of variables involved in the regression. SHARE data are imputed using a multiple imputation methodology – see Christelis (2008) for details - with five implicate datasets
generated from the original dataset that contain the imputed values.16 Since multiple imputation is performed on the data, we estimate separately our model on each of the five implicates and
then combine the coefficients and the standard errors using the results in Rubin (1987).17
Coefficients are computed as the means of the five within imputation coefficients, while standard errors account for within and between imputation variability of the estimates. Appendix A.1 provides more details on the imputation procedure used.
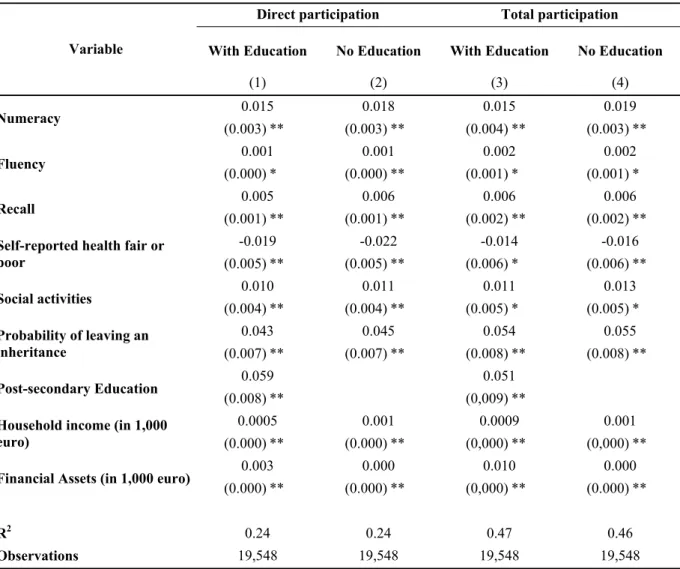
5.1. Baseline results
To single out the determinants of financial market participation, we study separately direct and total stockholding, which also includes stocks owned through managed investment accounts and mutual funds. The results turn out to be similar also focusing only on indirect participation, and for brevity these regressions are not reported.
We assume that stock market participation depends on demographic variables, such as age, a dummy for couples, a dummy for not working, which is meant to account for the possible effect of public pensions on stock market participation, indicators of household resources (gross financial and real assets and household disposable income), a self-reported health status dummy, a dummy for self-employment as a rough proxy for risk-aversion, indicators of religious and social activities, expectations to leave an inheritance. To proxy for the role of overconfidence we add to the regressions also an indicator of depression. Finally, stock market participation is related to the three cognitive function indicators.
Given the different institutions and constraints facing investors in each country, we start out
with a flexible specification in which we interact each variable with the country dummies.18 This
means that the effect of, say, numeracy, social activities or health status in the initial specification
16 This is also the number of implicates used in the US Survey of Consumer Finances (Kennickell, 1991). The
efficiency of the estimates depends on the number of implicates and on the fraction of missing data. Rubin (1987) shows that efficiency increases with the number of implicates.
17 If one adopts the most stringent definition of imputed values, i.e. a value of a household-level variable (like direct
or total stockholding) is considered imputed if any one of its constituent parts is imputed for any household member, then the percentages for direct and total stockholding are 6.2 percent and 7.7 percent of imputed values, respectively. For wealth, there are 28.8 percent of households in which at least one component of real wealth values is imputed (55.7 percent in case of financial wealth).
is not restricted to be the same in the 11 countries of the sample. For each regression, we then test the hypothesis that the coefficients of all variables, except for education, financial wealth and the country dummies, are the same across countries. The hypothesis is not rejected at standard confidence levels (p-values were equal to 0.77 for direct stockholding and to 0.17 for total
stockholding).19 We therefore present the estimates for the restricted specification; the results for
the unrestricted models are available on request.
We choose to report the estimated average of the marginal effects evaluated at each observation and the associated standard errors of the main variables of interest. The average of the individual marginal effects measures the average impact on the population of a change in the variables. This measure is preferable to the commonly used practice of evaluating the marginal effects at the mean of the regressors since the latter can be shown to lead to seriously biased results (Train, 2003). The estimated marginal effects are averages of non-linear functions of the coefficients and thus the computation of their standard errors is not straightforward. We chose to calculate these standard errors by using 200 bootstrap replications. The probit coefficients and standard errors of two baseline regressions for direct and total participation are fully reported in Table A1. For brevity, the coefficients of the other regressions are available on request.
The baseline specification is reported in Table 2, where columns (1) and (2) refer to direct and (3) and (4) to total stockholding. To save on space and increase readability, in the paper we do not report all marginal effects, but only a subset of them. The estimation shows that the effect of the cognitive indicators is positive, precisely estimated and economically important. If numeracy increases by 1.2 units (equivalent to one standard deviation of the variable), the probability of direct and total stockownership increases by 1.5×1.2=1.8 percentage points. Since the sample average of direct stockholding is 12 percent, an increase in numeracy of one unit is associated with an increase of stockholding of about 15 percent of its initial value. For total stockholding the effect of an increase in numeracy by one standard deviation would be also equal to 1.8 percentage points, which is 7 percent of total stockholding. Raising fluency by one standard deviation (8.3 points) increases the probability of direct stockholding by 0.001×8.3=0.83 percentage points and that of total stockholding by 1.7 percentage points. Finally, raising the
18 Our framework does not explicitly account for cross-country differences in tax regimes and other country-specific
institutions. This is one reason why all our regressions employ a full set countries dummies and why we test for the stability of the coefficients across countries.
recall indicator by one standard deviation (2.1) is associated with an increase in direct and total stockholding of 1.1 and 1.3 points respectively. Overall, the results support the hypothesis that
higher cognitive abilities raise stock market participation.20
Table 2 reports also other interesting results. The effects of health status on stockholding is negative, possibly because poor health is associated with higher health risk and risk expenditures, higher risk aversion or lower household resources, confirming the empirical findings of Rosen and Wu (2004) with US data. Socially active households are more likely to own stocks either directly or indirectly by about 1 percentage point. Raising the chance of leaving an inheritance from zero to 1 is associated with an increase in the probability of stockholding of roughly 5 percentage points (4.3 percent for direct and 5.4 for total stockholding, as shown in columns 1 and 3 of Table 2).
The coefficient of the post-secondary education dummy reveals by how much differences in education account for differences in stock market participation. The effect of having a post-secondary degree is 5.9 percentage points for direct stockholding and 5.1 points for total stockholding. The effect of education is strong: it might reflect the fact that individuals with higher education are more financially sophisticated and thus face lower costs of stockholding, or differences in permanent income and resources.
As a further measure for household resources, we use financial wealth and income. Financial wealth is strongly associated with the probability of stockholding. The most natural interpretation is that fixed transaction costs prevent poor households from becoming stockholder. The probit regression indicates that raising financial wealth by 1,000 euro increases the average probability of direct and total stockholding by 0.3 and 1 percentage points respectively, while raising income by 1,000 euro increases the corresponding propensities by around 0.05 and 0.09 percentage points respectively. It is worth stressing that in the probit regressions financial wealth is interacted with the country dummies, and that in Table 2 we report the average effect across countries.
Since cognitive skills are partly acquired through education, it is also of interest to omit education from the regression. The estimated effects in columns (2) and (4) of Table 2 represent
19 Hypothesis testing was conducted using F-tests that account for multiple imputation as in Li et al. (1991).
20 Computing the change in the probability of owning stocks when each of the three indicators increases from the 25th
the “gross effects” of cognitive abilities on participation. The effect of numeracy (when augmented by one standard deviation) for direct stockholding increases from 1.8 to 2.2 percentage points with respect to the specification that includes education, while for total stockholding it increases from 1.8 to 2.3 percentage points. On the other hand, omitting education the effects of fluency and recall are hardly affected.
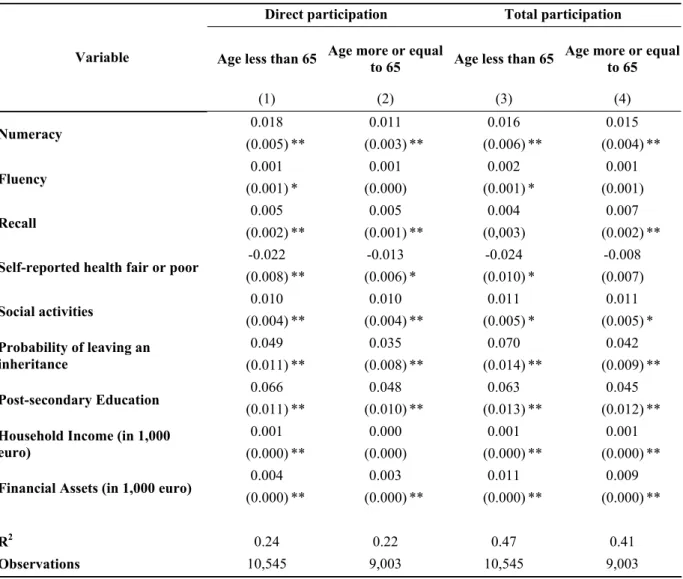
5.2. Sample splits
Since cognitive abilities deplete over time and since we know that the elderly are less likely to hold stocks, one wonders if the results are driven by the oldest portion of our sample. In Table 3 we therefore estimate our baseline regression splitting the sample by age (younger or older than 65, which is the male retirement age in most of our countries). Although there are some
differences between the two sub-samples,21 the marginal effects of all three cognitive variables
are broadly similar in both age groups. Therefore, these results suggest that our sample of elderly households does not bias the results towards finding a positive association between stockholding and cognitive abilities.
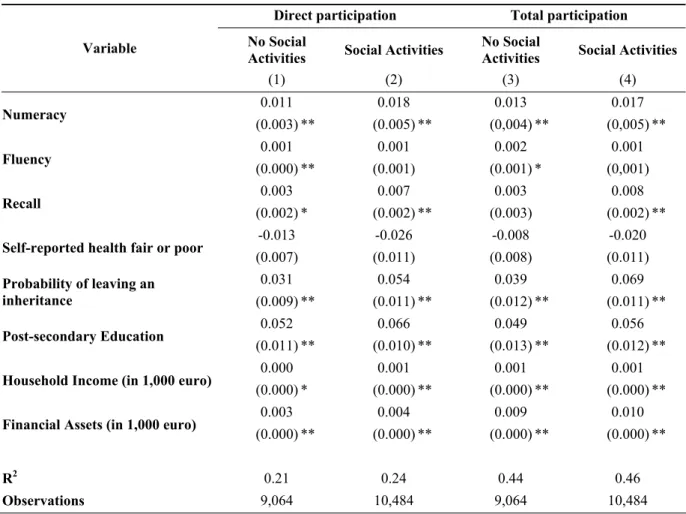
Hong, Kubik and Stein (2004) have emphasized the role of social activities as one of the channels through which people learn about financial matters, and therefore as one vehicle enhancing stock market participation. They show that social investors - investors who are more active socially - are more likely to participate and that a social multiplier operates in such a way that the effect of the determinants of stockholding is magnified among more socially active individuals.
To establish if there is a social multiplier we split the sample between social (53.6 percent of the sample) and non-social investors (46.4 percent) and estimate the model within each of the two sub-samples. The social multiplier theory suggests that the effect of cognitive ability is higher in the sample of more socially active investors. The results are reported in Table 4. Comparing columns (1) and (2), we find that the effect of numeracy and recall on direct and total stockholding is larger among socially active households, while the effect of fluency is similar
across the two sub-samples and perhaps stronger for total participation in the no social activities sub-sample. The results for total participation are similar. This suggests that social interactions
magnify the effect of mathematical skills and memory on stock market participation.22
Social interactions also amplify the effect of the chance of leaving an inheritance and of education on direct and total participation, which is again consistent with the existence of a social multiplier. Among the more socially connected, the effect of post-secondary education on direct stockholding is 6.6 percentage points, against 5.2 points in the sample of individuals who don’t engage in social activities. The pattern of results is similar for total participation.
5.3. Robustness checks
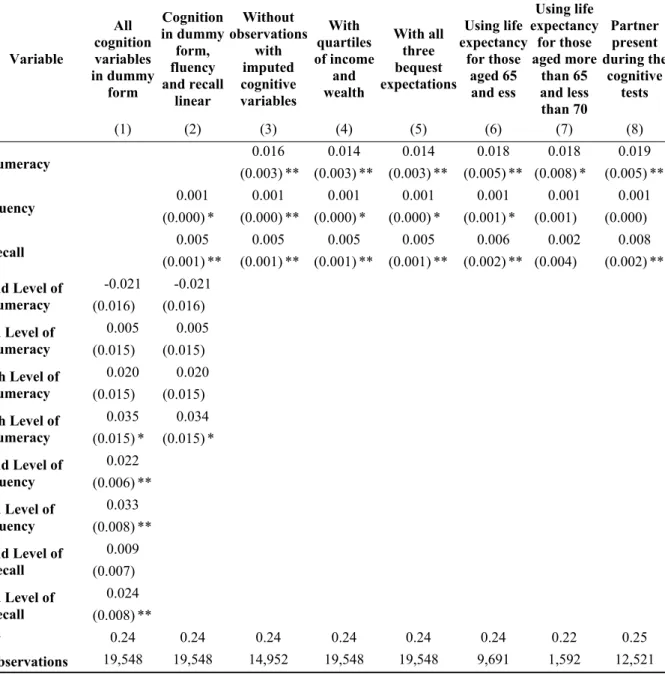
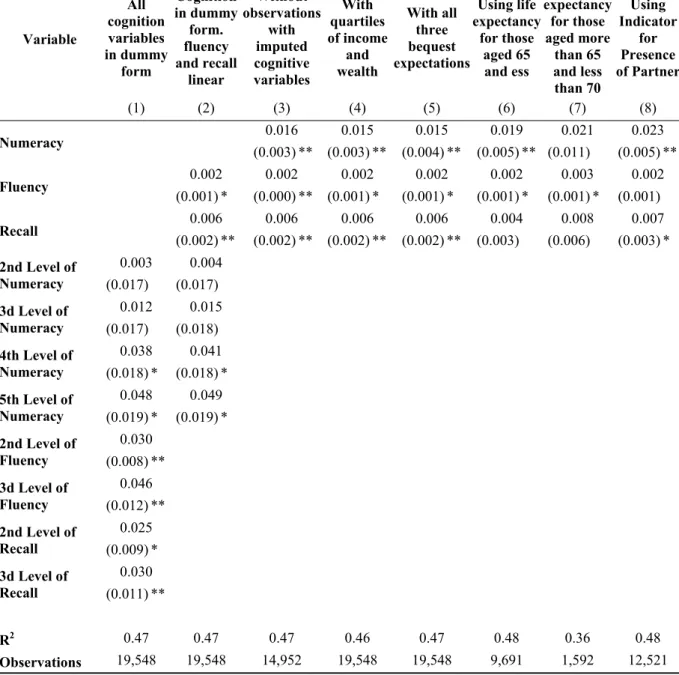
In this section we perform several robustness checks. In particular, we investigate if alternative parameterization of the effect of cognition and resources on participation, the role of additional proxies for the bequest motive and for longevity, the possible impact of our imputation procedure, and the interaction between partners during the interview. The results for direct participation are reported in Table 5, and for total participation in Table 6. For brevity, we focus only on the marginal effects for the cognition variables.
Column (1) of Tables 5 and 6 show the results allowing all cognitive variables to enter our specification in dummy form. The evidence confirms the positive link between cognition and stockholding (direct and total), though the coefficients are sometimes less precisely estimated. Precision improves in column (2), where numeracy is dummified and recall and fluency enter linearly in the regression. Again the association between cognition and stock market participation is positive.
To establish if these alternative parameterization of the effect of cognition on participation provides a better description of the data, we compute the Bayesian Information Criterion (BIC) for the baseline specification (with all cognitive variables in linear form), for the specification
21 The Chow tests for equality of coefficients suggest that the 2 samples are statistically different for total
stockholding (see column 3 in Table A2), whereas the results are less clear for direct stockholding (column 1 in Table A2).
22
In this case, a Chow test shows that the hypothesis that the coefficients of the two regressions are equal is not rejected (columns 2 and 4 in Table A2), therefore the differences in the marginal effects of cognitive variables across the two subsamples are due to differences in the distribution of household characteristics (including cognition).
where all cognition variables are dummified, and for the specification where only the numeracy variable is dummified. The results for direct and total participation are reported in Table A3 of the Appendix and show that both for direct and total participation the baseline specification has a much more negative BIC, which clearly indicates a better fit. Therefore, the test lends support to the linear form in which cognitive variables are entered in the baseline specification.
A number of households refuse to answer the cognitive abilities questions. Instead of imputing a value for these households, we estimate the model using only the non-imputed observations for the cognitive variables. This is a relevant check since imputations are based on variables that might have an independent effect on participation. Column (3) of Tables 5 and 6 report the results, which are basically unchanged with respect to the baseline specification both for direct and total stockholding (Tables 5 and 6 respectively).
We also investigate whether financial wealth and income might have a non-linear effect on participation, perhaps due to transaction costs affecting stockholding only at low levels of income and wealth. This is done by entering dummies for financial wealth and income quartiles, a specification that might also reduce the impact of measurement error in income and wealth. The results are reported in column (4) of Tables 5 and 6, and are consistent with those of the baseline specification (Table 2). Therefore, while non-linearities in financial wealth and income are potentially important, they don’t obscure the effect of cognition on participation.
To explore the possible effect of planning horizon on participation, we add two proxies for bequest expectations: the chance of leaving an inheritance larger than 150,000 euro and any positive amount. The results in column 5 of Tables 5 and 6 are similar to the baseline specification for both direct and total stock market participation. We also explore the effect of alternative and perhaps better proxies of planning horizon, such as life expectancy at the age of
65 and less, and life expectancy between 65 and 70.23 The results are reported in column 6 of
Tables 5 and 6 and are, if anything, stronger than in the baseline specification.
The last column of Tables 5 and 6 adds a dummy for the presence of the partner during the cognitive function test. Identifying the precise channel through which the presence of one partner might affect the performance in the cognitive test of the other partner is beyond the scope of this paper. However, since the presence of the partner might improve (or reduce) the other partner’s
performance in the cognitive test, we see as a valuable check adding a variable to control for whether the partner is present during the interview. The results are however very similar to the baseline specification, which seem to suggest that the presence of the partner does not play a role in shaping the relation between participation and cognitive abilities.
The results presented so far are robust to a number of checks and point toward a positive association between stock market participation and cognitive abilities. However, they don’t help telling what lies behind this association. This is what we turn in the next section.
5.4. Bondholding
Not all assets require the same degree of sophistication. Dealing with return, lower-risk assets, such as bonds, typically requires a lower degree of financial sophistication than stocks. The degree of financial sophistication and the ability to process economic and financial data is in turn affected by cognitive abilities. Therefore, one might expect that the demand for less information-intensive assets, such as bonds, is less affected by cognitive impairments. On the other hand, if cognitive impairments prevent individuals from investing in any financial assets, one should find that the effect of cognitive skills is independent of the specific financial investment considered. This would imply that information barriers are not likely to explain the correlation between cognitive abilities and stock market participation.
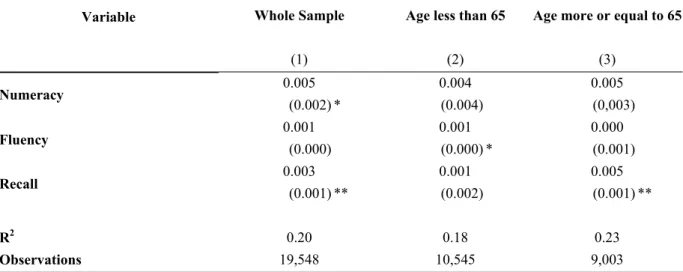
In Table 7 we therefore estimate separate probit regressions for bonds, using the same specification as in Table 2. The effect of numeracy (0.5 percentage points) and recall (0.3 percentage points) is smaller than for stocks, while that of fluency is not statistically different from zero.
We also check if the results are driven by the correlation between cognitive functions and participation in particular age groups. This is done by estimating the bond market participation equation in the same sub-samples as in Table 3 (head younger or older than 65). The results are reported in columns (2) and (3) of Table 7 and confirm that cognitive variables affect more
23 In SHARE individuals aged 65 and less are asked to give the chance of survival to the age of 75 and those aged
stockholding then bondholding.24 Overall, the results for bondholding suggest that information barriers, rather then preference heterogeneity, might indeed explain the association between cognitive abilities and portfolio decisions.
6. Conclusions
The Survey of Health, Ageing, and Retirement in Europe shows that there is substantial heterogeneity in the rate of financial markets participation, both within and across countries. This is not a new feature of the microeconomic data, as recent evidence for EU countries and the US shows that heterogeneity in stockownership is a widespread phenomenon, with large international differences. But SHARE data are collected on a comparable basis for 11 European countries, and are an extremely rich source to account for investors’ heterogeneity.
In particular, SHARE allows us to investigate the relation between cognitive abilities, as measured in the psychological and epidemiological literature, and the decision to invest in stocks, either directly or through mutual funds and other investment accounts. Cognitive abilities might reduce the perceived cost of investing in the stock market, and be correlated with risk tolerance and the ability to process financial data, raising stock market participation.
We focus on three domains of cognitive abilities (numeracy, verbal fluency and memory), and find that they all affect stockownership. Since our regressions control also for education, our results imply that cognitive abilities have an independent effect on the decision to hold stocks. The survey contains many indicators related to the life of the elderly in Europe, ranging from physical health, socio-economic status, intensity of social interaction, and intention to leave bequests. This gives us the opportunity to quantify the contribution of many different factors in explaining heterogeneity in stockownership in Europe. Other things equal, we find that cognitive impairments reduce the propensity to hold stocks. The effects are statistically significant and economically important.
To explore further the reasons behind the association between cognitive skills and stock market participation, we focus on the effect of cognition on the propensity to hold less information intensive assets, such as bonds. The results reveal a weaker association of cognitive
abilities with bond holdings, suggesting that the association between cognitive abilities and stockholding is driven by information constraints, rather than other reasons such as overconfidence or high propensity to take financial risks
We also report other interesting results. Health status is associated with lower stockownership, while social activities are positively correlated with the decision to own stocks. Those who intend to leave an inheritance are more likely to participate in the stock market. Finally, the effect of cognitive abilities on participation is larger among the more socially connected individuals, suggesting that social learning and cognitive skills are complementary in enhancing stock market participation.
References
Ameriks, J., and S. P. Zeldes (2004), “How do Portfolio Shares Vary with Wealth?” Columbia University, mimeo.
Attanasio, O. P., J. Banks, and S. Tanner (2002), “Asset Holding and Consumption Volatility.”
Journal of Political Economy, 102, 771-92.
Barber, B. M., and T. Odean (2001), “Boys Will Be Boys: Gender, Overconfidence, and
Common Stock Investment.” Quarterly Journal of Economics, 116, 261-92.
Barberis, N., H. Ming, and R. H. Thaler (2006), “Individual Preferences, Monetary Gambles and
Stock Market Participation.” American Economic Review, 96, 1069-90.
Benartzi, S., and R. H. Thaler (1995), “Myopic Loss Aversion and the Equity Premium Puzzle.”
Quarterly Journal of Economics, 110, 75-92.
Benjamin, D. J., S. A. Brown, and J. M. Shapiro (2006), “Who is Behavioral? Cognitive Ability and Anomalous Preferences.” Harvard University, mimeo.
Bernheim, D., and D. M. Garrett (2003), “The Effects of Financial Education in the Workplace:
Evidence from a Survey of Households.” Journal of Public Economics, 87, 1487-1519.
Bogan, V. (2006), “Stock Market Participation and the Internet”, Journal of Financial and
Quantitative Analysis, forthcoming.
Börsch-Supan, A., A. Brugiavini, H. Jürges, J. Mackenbach, J. Siegriest, and G. Weber (2005),
Health, Aging and Retirement in Europe: First Results from the Survey of Health, Aging and Retirement in Europe. Mannheim: Mannheim Research Institute for the Economics of Aging.
Christelis, D. (2008), “Item Non-response in SHARE Wave 2”. Forthcoming in First Results
from the Survey of Health, Ageing and Retirement in Europe (2004-2007): Starting the Longitudinal Dimension. A. Börsch-Supan, A. Brugiavini, H. Jürges, A. Kapteyn, J. Mackenbach, J. Siegriest and G. Weber, eds. Mannheim: Mannheim Research Institute for the Economics of Aging.
Campbell, J. Y. (2006), “Household Finance.” Journal of Finance, 61, 1553-1604.
Christelis, D., T. Jappelli, and M. Padula (2005), “Wealth and Portfolio Composition.” In Health,
Aging and Retirement in Europe: First Results from the Survey of Health, Aging and Retirement in Europe, A. Börsch-Supan, A. Brugiavini, H. Jürges, J. Mackenbach, J. Siegriest and G. Weber, eds. Mannheim: Mannheim Research Institute for the Economics of Aging.
Christelis, D., T. Jappelli, and M. Padula (2006), “Cognitive Abilities and Portfolio Choice”. CSEF Working Paper No. 157.
Cocco, J. F., F. J. Gomes, and P. J. Maenhout (2005), “Consumption and Portfolio Choice Over
the Life-Cycle.” Review of Financial Studies, 18, 490-533.
Currie, J., and B. Madrian (1999), “Health, Health Insurance and the Labor Market.” In
Handbook of Labor Economics, O. Ashenfelter, P. Richard and G. Layard, eds. Amsterdam: North Holland.
Dewey, M. E., and M. J. Prince (2005), “Cognitive Function.” In Health, Aging and Retirement
in Europe: First Results from the Survey of Health, Aging and Retirement in Europe, A. Börsch-Supan, A. Brugiavini, H. Jürges, J. Mackenbach, J. Siegriest, and G. Weber, eds. Mannheim: Mannheim Research Institute for the Economics of Aging.
Dohmen, T., A. Falk, D. Huffman, U. Sunde (2007), “Are Risk Aversion and Impatience Related to Cognitive Ability?”, IZA Discussion Paper n. 2735.
Duflo, E., and E. Saez (2002), “Participation and Investment Decisions in a Retirement Plan: the
Influence of Colleagues’ Choices”. Journal of Public Economics, 85, 121-48.
Dynan, K., and D. M. Maki (2001), “Does Stock Market Wealth Matter for Consumption?” Finance and Economics Discussion Series 2001-23. Washington: Board of Governors of the Federal Reserve System.
Edwards, R. D. (2005), “Health Risk and Portfolio Choice.” Rand Corporation, mimeo.
Engstrom, S. and Westerberg, A. (2003), “Which individuals make active investment decision in
the new Swedish pension system?” Journal of Pension Economics and Finance 2, 1-21.
Frederick, S. (2005), “Cognitive Reflection and Decision Making.” Journal of Economic
Perspectives, 19, 25-42.
Goldman, D. and N. Maestas (2005), “Medical Expenditure and Household Portfolio Choice,” NBER Working Paper n. 11818.
Gollier, C. (2005), “What Does the Classical Theory Have to Say about Household Portfolios?” In Household Portfolios, L. Guiso, T. Jappelli, and M. Haliassos eds. Cambridge: MIT Press.
Graham, J. R., C. R. Harvey, and H. Huang (2005), “Investor Competence, Trading Frequency, and Home Bias.” NBER Working Paper n. 11426.
Grinblatt, M., and M. Keloharju (2001), “How Distance, Language and Culture Influence
Stockholding and Trades.” Journal of Finance, 56, 1053-73.
Guiso, L., T. Jappelli and D. Terlizzese (1996), “Income risk, Borrowing Constraints and
Portfolio Choice. “ American Economic Review, 86, 158-172.
Guiso, L., M. Haliassos, and T. Jappelli (2005), Household Portfolios. Cambridge: MIT Press.
Guiso, L., P. Sapienza, and L. Zingales (2004), “The Role of Social Capital in Financial
Development.” American Economic Review, 94, 526-556.
Guvenen, F. (2006), “Reconciling Conflicting Evidence on the Elasticity of Intertemporal
Substitution: A Macroeconomic Perspective.” Journal of Monetary Economics, 53,
1451-72.
Hank, K., and M. Erlinghagen, (2005), “Volunteer Work”. In Health, Aging and Retirement in
Europe: First Results from the Survey of Health, Aging and Retirement in Europe, A. Börsch-Supan, A. Brugiavini, H. Jürges, J. Mackenbach, J. Siegriest, and G. Weber, eds. Mannheim: Mannheim Research Institute for the Economics of Aging.
Haliassos M and C. Bertaut (1995), “Why do so few hold stocks?”. Economic Journal, 105,
1110-1129.
Heaton, J. and D. Lucas, (2000), “Portfolio Choice and Asset Prices: the Importance of
Entrepreneurial Risk.” Journal of Finance, 55, 1163-98.
Hong, H., J. D. Kubik, and J. C. Stein, (2004), “Social Interaction and Stock Market
Participation.” Journal of Finance, 59, 137-63.
Hurd, M. (2002), “Portfolio Holdings of the Elderly”. In Household Portfolios, L. Guiso, M.
Haliassos and T. Jappelli eds. Cambridge: MIT Press.
Jürges, H. (2005a), “Cross-Country Differences in General Health.” In Health, Aging and
Retirement in Europe: First Results from the Survey of Health, Aging and Retirement in Europe, A. Börsch-Supan, A. Brugiavini, H. Jürges, J. Mackenbach, J. Siegriest, and G. Weber, eds. Mannheim: Mannheim Research Institute for the Economics of Aging.
Jürges, H. (2005b), “Gifts, Inheritances and Bequest Expectations.” In Health, Aging and
Retirement in Europe: First Results from the Survey of Health, Aging and Retirement in Europe, A. Börsch-Supan, A. Brugiavini, H. Jürges, J. Mackenbach, J. Siegriest, and G. Weber, eds. Mannheim: Mannheim Research Institute for the Economics of Aging.
Kahneman, D., and A. Tversky (1979), “Prospect Theory: An Analysis of Decision under Risk,”
Kaplan, G. A., G. Turrell, J. W. Lynch, S. A. Everson, E. Helkala, and J. T. Salonen, (2001),
“Childhood Socioeconomic Position and Cognitive Function in Adulthood.” International
Journal of Epidemiology, 30, 256-263.
Kennickell, A. (1991), "Imputation of the 1989 Survey of Consumer Finances: Stochastic
Relaxation and Multiple Imputation," Proceedings of the Section on Survey Research
Methods, American Statistical Association.
Korniotis, G., and A. Kumar (2005), “Does Investment Skills Decline due to Cognitive Ageing or Improve with Experience?” University of Nôtre-Dame, mimeo.
Laibson, D. (1997), “Golden Eggs and Hyperbolic Discounting.” Quarterly Journal of
Economics, 112, 443-77.
Li, K. H., T.E. Raghunathan, and D. B. Rubin, (1991), “Large Sample Significance Levels from Multiply Imputed Data using Moment-Based Statistics and an F Reference Distribution”.
Journal of the American Statistical Association 86, 1065-73.
Lusardi, A., and O. S. Mitchell (2006), “Financial Literacy and Planning: Implications for Retirement Well-Being.” Pension Research Council WP 2006-1, The Wharton School, University of Pennsylvania.
Mankiw, N.G., and S. P. Zeldes (1991), “The Consumption of Stockholders and
Nonstockholders”.Journal of Financial Economics, 29, 97-112.
Qiu, J. (2004), “Precautionary Saving and Health Insurance: A Portfolio Choice Perspective.” Wilfrid Laurier University, mimeo.
Richards, M., B. Shipley, R. Furher, and M.E. Wadsworth (2004), “Cognitive Ability in
Childhood and Cognitive Decline in Mid-life: Longitudinal Birth Cohort Study.” British
Medical Journal, 328-552.
Rosen, H. S., and S. Wu (2004), “Portfolio Choice and Health Status.” Journal of Financial
Economics, 72, 457-84.
Rubin, D. B. (1987), Multiple Imputation for Non-response in Surveys. New York: Wiley.
Schaie, K. W. (1989), “The Hazards of Cognitive Aging.” Gerontologist, 29, 484-493.
Spaniol, J. and U. J. Bayen (2005), “Ageing and Conditional Probability Judgments: a Global
Matching Approach.” Psychology and Ageing, 20, 165-81.
Sims, C. (2003), “Implications of Rational Inattention.” Journal of Monetary Economics, 50,
Smith, J. P. (1999), “Healthy Bodies and Thick Wallets: the Dual Relation between Health and
Economic Status.” Journal of Economic Perspectives, 13, 145-66.
Train, K. E. (2003), Discrete Choice Methods with Simulation. Cambridge: Cambridge
University Press.
Van Rooij, Marten, Rob Alessie, and Annamaria Lusardi (2007), “Financial Literacy and Stock Market Participation,” mimeo.
Vissing-Jorgensen, A. (2004), “Perspectives on Behavioral Finance: Does Irrationality Disappear
with Wealth? Evidence from Expectations and Actions.” In NBER Macroeconomics Annual
2003, M. Gertler and K. Rogoff eds. Cambridge: MIT Press.