Archive University of Zurich Main Library Strickhofstrasse 39 CH-8057 Zurich www.zora.uzh.ch Year: 2010
The components of working memory updating: an experimental
decomposition and individual differences
Ecker, U K H ; Lewandowsky, S ; Oberauer, Klaus ; Chee, A E H
Abstract: Working memory updating (WMU) has been identified as a cognitive function of prime impor-tance for everyday tasks and has also been found to be a significant predictor of higher mental abilities. Yet, little is known about the constituent processes of WMU. We suggest that operations required in a typical WMU task can be decomposed into 3 major component processes: retrieval, transformation, and substitution. We report a large-scale experiment that instantiated all possible combinations of those 3 component processes. Results show that the 3 components make independent contributions to updating performance. We additionally present structural equation models that link WMU task performance and working memory capacity (WMC) measures. These feature the methodological advancement of esti-mating interindividual covariation and experimental effects on mean updating measures simultaneously. The modeling results imply that WMC is a strong predictor of WMU skills in general, although some component processes—in particular, substitution skills—were independent of WMC. Hence, the reported predictive power ofWMUmeasures may rely largely on common WM functions also measured in typical WMC tasks, although substitution skills may make an independent contribution to predicting higher mental abilities.
DOI: https://doi.org/10.1037/a0017891
Posted at the Zurich Open Repository and Archive, University of Zurich ZORA URL: https://doi.org/10.5167/uzh-28479
Journal Article
Originally published at:
Ecker, U K H; Lewandowsky, S; Oberauer, Klaus; Chee, A E H (2010). The components of working memory updating: an experimental decomposition and individual differences. Journal of Experimental Psychology: Learning, Memory, and Cognition, 36(1):170-189.
The Components of Working Memory Updating:
An Experimental Decomposition and Individual Differences
Ullrich K. H. Ecker and Stephan Lewandowsky
University of Western Australia University of Bristol
Klaus Oberauer
Abby E. H. Chee
University of Western Australia
Working memory updating (WMU) has been identified as a cognitive function of prime importance for everyday tasks and has also been found to be a significant predictor of higher mental abilities. Yet, little is known about the constituent processes of WMU. We suggest that operations required in a typical WMU task can be decomposed into 3 major component processes: retrieval, transformation, and substitution. We report a large-scale experiment that instantiated all possible combinations of those 3 component processes. Results show that the 3 components make independent contributions to updating performance. We additionally present structural equation models that link WMU task performance and working memory capacity (WMC) measures. These feature the methodological advancement of estimating interindividual covariation and experimental effects on mean updating measures simultaneously. The modeling results imply that WMC is a strong predictor of WMU skills in general, although some component processes—in particular, substitution skills—were independent of WMC. Hence, the reported predictive power of WMU measures may rely largely on common WM functions also measured in typical WMC tasks, although substitution skills may make an independent contribution to predicting higher mental abilities.
Keywords:working memory, memory updating, structural equation modeling, individual differences
Working memory (WM) can be characterized as a mechanism, or collection of mechanisms, dedicated to holding selected repre-sentations available for further cognitive processing. For example, mental arithmetic would be impossible without storage of inter-mediate sums in WM (Fu¨rst & Hitch, 2000). One implication of the involvement of WM in many cognitive tasks is that the content of WM must be continuously updated. For instance, a simple task like counting sheep in a paddock consists of updating a number in WM with each new object counted (Garavan, 1998). If one is counting ewes and rams separately, then two numbers must be continuously updated and retained, and that number rises to three if one is also keeping track of lambs. Likewise, when reading a story, the reader follows the unfolding course of events by building a situation model that is updated according to the events described
(Morrow, Greenspan, & Bower, 1987). While driving, every glance into the rearview mirror updates the driver’s representation of the surrounding traffic, thus providing “situational awareness” (Gugerty, 1997, p. 42). Language comprehension also depends on rapid updating of syntactic representations, for instance, when encountering garden-path sentences, such as “While the scientists explored the cave remained undiscovered” (Christianson, Holling-worth, Halliwell, & Ferreira, 2001).
Updating of WM has long been recognized as an important topic of study in cognitive psychology and the neurosciences. One of the first experiments on WM updating was conducted by Yntema and Mueser (1962), who presented subjects with a long list of words and asked people to remember the last exemplar in each of a varying number of categories. In the related running memory task, subjects are asked to recall the lastnitems of a long list. This task has been used by Morris and Jones (1990) to study updating within the “central executive” of Baddeley’s (1986) WM model. It should be noted, however, that the utility of the running memory task as a tool to investigate updating (e.g., Postle, 2003) has recently been questioned (e.g., Bunting, Cowan, & Saults, 2006; see also Geiger & Lewandowsky, 2008).
WM updating has also been identified as one of three correlated factors that capture individual differences in executive functions (Miyake et al., 2000). Indeed, the “updating” factor has been found to be the only executive function that predicts fluid intelligence (Chen & Li, 2007; Friedman et al., 2006). Accordingly, difficulties in WM updating— especially the inability to inhibit information that is no longer relevant— have been proffered as the cause of poor comprehension skills (Carretti, Cornoldi, De Beni, &
Ullrich K. H. Ecker, Stephan Lewandowsky, and Abby E. H. Chee, School of Psychology, University of Western Australia; Klaus Oberauer, Department of Psychology, University of Bristol.
Klaus Oberauer is now at the University of Zurich.
Preparation of this article was facilitated by a Discovery Grant from the Australian Research Council to Stephan Lewandowsky and Klaus Ober-auer, as well as an Australian Professorial Fellowship awarded to Stephan Lewandowsky. We thank Lee-Xieng Yang and Charles Hanich for pro-gramming and research assistance, respectively.
Correspondence concerning this article should be addressed to Ullrich K. H. Ecker, School of Psychology (M304), University of Western Aus-tralia, 35 Stirling Highway, Crawley, WA 6009, Australia. E-mail: [email protected] or [email protected]. Web address: http:// www.cogsciwa.com
Romano, 2005; Palladino, Cornoldi, De Beni, & Pazzaglia, 2001). In the neurosciences, Donchin and Coles (1988) proposed that one of the most prominent event-related potential components, the P300, reflects updating of WM.
The obvious and acknowledged importance of WM updating stands in contrast to our limited understanding of the underlying processes (for similar arguments, see Kessler & Meiran, 2008; Oberauer & Kliegl, 2001). Kessler and Meiran (2008) argued that updating must involve distinct subprocesses because WM needs to be stable and flexible at the same time. Specifically, when updat-ing information, WM must be protected against interference by outdated information, but it must also allow for the modification of memorial content when appropriate. Those two competing de-mands are unlikely to be met by a single unitary process, although at present nothing is known about what constituent processes might govern WM updating. In our study, we sought to make the first step toward filling this void by (a) experimentally manipulat-ing the components involved in a comprehensive updatmanipulat-ing task and (b) considering how those components relate to individual differ-ences in WM capacity.
WM Updating and Individual Differences
The consideration of individual differences has a long history in WM research (Daneman & Carpenter, 1980; Fry & Hale, 1996; Just & Carpenter, 1992), and the pattern of correlations between tasks can address issues relating to the number or nature of processes or com-ponents involved in WM. For instance, Oberauer and colleagues (Oberauer, Su¨ß, Schulze, Wilhelm, & Wittmann, 2000; Oberauer, Su¨ß, Wilhelm, & Wittman, 2003) have used such an approach to decompose the WM capacity construct into functional components (simultaneous storage and processing, relational integration/ coordination, and supervision/speed) and content facets (verbal/ numerical vs. spatial WM), which were then used to investigate the relations between functional WM components and higher cognitive functions such as reasoning (Oberauer, Su¨ß, Wilhelm, & Wittmann, 2008) or attention (Buehner, Krumm, & Pick, 2005).
We already noted that WM updating (WMU from here on) has been found to predict fluid intelligence (Friedman et al., 2006); however, the issue is far from settled. For instance, in their studies of individual differences in executive functions, Miyake et al. (2000) and Friedman et al. (2006) measured two kinds of executive functions— task shifting and inhibition— by subtracting an experimental condi-tion requiring those funccondi-tions from a control condicondi-tion not requiring them. WMU, in contrast, was measured simply by the accuracy on WM tasks that required updating, such as a running memory task (termed letter task in their article). These tasks obviously do not supply a pure measure of WMU but additionally involve other WM functions such as memory maintenance. Therefore, we do not know whether the correlation between the “updating” factor and fluid in-telligence (Friedman et al., 2006) reflects a relation between intelli-gence and the ability to update WM or simply a correlation between intelligence and WM capacity (WMC from here on). Recently, Schmiedek, Hildebrandt, Lo¨vde´n, Wilhelm, and Lindenberger (in press) have argued that common WM abilities underlie performance in both WMC (e.g., complex span tasks) and WMU tasks and that hence both types of task are strongly related and predict higher cognitive abilities to a similar degree.
In contrast, some researchers have claimed that there is only a weak link between WMU and WMC; for instance, Radvansky and Copeland (2001) reported that the ability to update the situational representation of a verbally described unfolding event was unre-lated to WMC. Moreover, it has been suggested that WMU abil-ities (as opposed to WMC abilabil-ities) are relatively preserved in old age (Radvansky & Dijkstra, 2007) but disproportionately affected in schizophrenia (Van Raalten, Ramsey, Jansma, Jager, & Kahn, 2008).
Hence, the relation between WMU and WMC remains to be examined: On the one hand, prominent theories of WM that assume a tight link between WMC and executive functions (Bad-deley, 1986; Engle, Kane, & Tuholski, 1999; Kane et al., 2004) should predict that updating processes are closely related to mea-sures of WMC because updating is regarded as one executive function (Miyake et al., 2000). This has been supported by recent evidence (Schmiedek et al., in press). On the other hand, WMU and WMC may be dissociable dimensions of mental ability, as suggested, for instance, by the results of Radvansky and colleagues (Radvansky & Copeland, 2001; Radvansky & Dijkstra, 2007).
To address this issue in addition to the main updating task we describe, we included three different WM tasks in our study, thus permitting a reliable estimate of each participant’s WMC. These WMC estimates could then be statistically related to the individual component processes of WMU1that were isolated by our
experi-mental manipulations.
Components of WMU
In the absence of any relevant precedent or prior theorizing, we began our examination of the components of WMU by conducting a task analysis of previously used experimental updating para-digms. This task analysis identified three putative subprocesses: retrieval, transformation, and substitution. Our experiment orthog-onally manipulated these three components, thus permitting their empirical identification and assessment of their interrelationship.
First, updating may or may not involve the requirement to retrieve information. For example, suppose a restaurant manager is told, “20 patrons are expected tonight.” This information would need to be updated when the new information—“Actually, it will be five patrons more than the initially expected 20”— becomes available; however, in this instance, no retrieval of the initial information is required because it is present in the updating prompt. By contrast, the prompt “Actually, it will be five patrons more than initially expected” requires retrieval of the initial num-ber to ensure accurate updating.2
Second, updating may or may not involve transformation. Both of the examples just given involved transformation of informa-tion—adding 5 to 20 in order to arrive at the final result of 25.
1Whenever we refer to the termcomponent processes of WMU, it would
be more formally correct to use the phrasecomponent processes potentially required for performance in WMU tasks, as not all updating necessarily involves all three subprocesses described in the following paragraph.
2We use the termretrievalin a theoretically neutral manner to refer to
whatever cognitive processes are required to use information that is not presented. In some models, the actual process may be more accurately described asaccessto already-retrieved information; we will take up those theoretical nuances after all the data have been presented.
However, the need for transformation is not inevitable; for exam-ple, the prompt “Actually, it will be 25 patrons” permits updating without the need to transform earlier information.
Finally, updating may or may not involve a substitution of information. The three preceding examples all replaced informa-tion (25 instead of 20 patrons), but again this is not inevitable. For example, one may receive the information “Actually, we are expecting five groups of four patrons,” or “Three patrons canceled their reservation, but we got three new bookings.” Although these prompts will likely elicit some transformative processing (e.g., multiplying 4 by 5), the result does not require a substitution of the old information.
The various WMU tasks used in the literature employ these three processes to varying degrees. Some of the most commonly used updating tasks are summarized in Table 1. For each task, we have identified the extent to which it involves the three distinct subprocesses just discussed. For example, the n-back task, in which people are presented with a series of items and have to judge whether each one is identical to the item presentednsteps before, clearly involves a retrieval component— because one has to re-member at least the lastnitems and retrieve thenth one back at every step— but it does not involve any transformation because the information must be retrieved in a form that is identical to the form in which it was presented. By contrast, the memory updating (MU) task involves both retrieval and transformation. In the MU task, people have to hold in memory a set of items (typically single digits), each presented in a separate frame, and are then presented with a prompt (e.g., “?⫹1”) directing them to retrieve the content of one particular frame and transform this information as per the prompt and from then on to retain the result of that transformation in memory.
The table clarifies that there is considerable cognitive heteroge-neity among updating tasks. Some tasks involve all three
pro-cesses, whereas others require only a subset of processes. More-over, these three component processes are not necessarily unique to updating tasks; for instance, retrieval by definition obviously plays a role in virtually all tests of memory. It follows that the heterogeneity in the observed relationship between updating and WMC may partially stem from differences between the various WMU tasks. In particular, the different tasks may tap the proposed underlying subprocesses of updating in different ways or to dif-ferent extents. In order to shed more light on these component processes and their relations to higher cognitive functioning, we aimed to decompose the processes involved in a single updating task and to investigate their contribution to updating performance and also their covariation with general WMC.
The Present Study
The present study investigated the three component processes potentially required for performance in WMU tasks—retrieval, transformation, and substitution. Our goal was to isolate these components from other processes and variables and to observe their interactions. To this end, we used a variant of the MU task previously used by Salthouse, Babcock, and Shaw (1991) and Oberauer et al. (2000). Subjects memorized three letters and then performed a sequence of operations that selectively required up-dating of one of the memoranda and that variously did or did not require retrieval, transformation, and substitution. Hence, this task— described later in detail—involved multiple processes. In order to assess the interplay among the processes, we used a multilevel regression approach.
In addition, we combined those experimental manipulations with psychometric analysis methods to isolate the variance of each of these components of WMU and relate them to WMC. To do so, we had the subjects also complete a battery of WM measures in a
Table 1
Processes Involved in Common Working Memory Updating Tasks
Task/source Retrieval Transformation Substitution
n-back ⫹ — ⫹ Kirchner (1958) McElree (2001) Yntema (1963) Keep-track ⫹ — ⫹ Miyake et al. (2000) Morris & Jones (1990)
Running memory: Friedman et al. (2006) ⫹ — ⫹
Memory updating ⫹ ⫹ ⫹
Salthouse et al. (1991) Oberauer et al. (2000)
Tone-repetition detection: Galletly et al. (2007) — — ⫹
Deviant-tone counting: Van Raalten et al. (2008) — ⫹ ⫹
Matrix updating: Chen & Li (2007) ⫹ — ⫹ Note. In the keep-track task, subjects are given a number of categories (e.g., tools, animals) and are then presented with a series of exemplar words (e.g., hammer, dog); the task is to always remember the most recently presented exemplar for each category. In the running-memory task, subjects are presented with an item list of unpredictable length and have to remember the lastnitems of the list. The tone-repetition detection is a simple task in which subjects monitor a series of tones and respond whenever a target tone is immediately repeated. The deviant-tone counting task involves keeping a running count of rarely occurring tones in a sequence. The matrix updating task requires subjects to mentally move memorized dots across the cells of a matrix. Then-back and memory updating tasks are explained in the text. Task labels are not necessarily those used in the cited studies. Dash⫽no involvement; plus symbol⫽involvement.
separate session. The covariation of WMU components and WMC was investigated with structural equation models.
Method
Subjects
One hundred and four third-year psychology students from the University of Western Australia participated in the two experimen-tal sessions for partial course credit. Data from seven subjects were discarded either due to technical failure (two subjects) or because their performance in the WMU experiment was classified as an outlier (five subjects; see later section for details). The analyses therefore are based on the data from the remaining 97 subjects (13 men and 84 women; age range, 19 – 41 years; mean age, 21.2 years).
Apparatus
Both experimental sessions were controlled by a Matlab pro-gram designed using the Psychophysics Toolbox (Brainard, 1997; Pelli, 1997). Subjects were tested individually in sound-attenuated booths. Subjects sat about 70 cm from a 17-in. (43.18-cm) thin-film transistor monitor.
WMC Measures
Design. The first experimental session lasted 30 min and involved measurement of each participant’s WMC with a battery of three tasks.
Stimuli and procedure. The three WMC tasks were taken with slight modifications from Oberauer (2005). The tasks were the operation span (OS), sentence span (SS), and spatial short-term memory (SSTM) tasks, and they were always administered in this order.3
Operation span (OS). This task was originally designed by Turner and Engle (1989). On each trial, subjects saw an alternating sequence of arithmetic equations (e.g., 3 ⫹ 2 ⫽ 5) and the to-be-remembered consonants (all consonants were used except “Q” and “Y,” but subjects were not made aware of this additional constraint). Subjects had to judge the correctness of each equation and encode the following consonant for later serial recall.
Commencement of a trial was indicated by a fixation cross presented for 1.5 s. Then, the first equation appeared in the center of the screen. It disappeared when subjects made a response or after the maximum response time of 3 s had elapsed. Subjects used the “?/” and “Z” keys to make “Yes, this is correct” and “No, this is not correct” responses, respectively. Keys were labeled with “Y” and “N” accordingly.
After the equation disappeared, a consonant was presented cen-trally for 1 s. After a 100-ms blank interval, the next equation appeared. This sequence repeated between four and eight times, depending on list length. Following list presentation, recall of the letters was prompted with a question mark and a blinking under-score. Subjects then typed the remembered series of letters in their order of presentation; all letter keys were accepted, but nonletter keys were blocked. Every typed letter appeared next to the ques-tion mark for 200 ms. Subjects had to type as many letters as were actually presented in the trial. They were informed that the order
of letters mattered and were hence instructed to guess if necessary rather than skip letters they could not remember. There was no timing constraint for recall. The intertrial interval was 500 ms; there was a self-paced break after every three trials.
List length (i.e., the number of equations and letters) ranged from four to eight. There were 15 trials altogether, three trials per list length. The first equation operand was randomly drawn from the 1 to 10 range, and the second operand was drawn from the⫺9 to⫹10 range (excluding 0), and results ranged from⫹1 to⫹20. Half of the equations were correct. Three practice trials (with list lengths of three, four, and five) preceded the experimental trials. Letter sequences, equations, and trial order were placed in one random order that remained the same for all subjects. The conso-nant lists for each trial contained no repetitions, and the random generation of lists was repeated until no common acronyms (such as “JFK”) occurred.
Sentence span (SS). This task was a variant of the task origi-nally designed by Daneman and Carpenter (1980) and was very similar to the OS task just described, except that the processing task was to judge the meaningfulness of sentences. There was an equal number of meaningful and meaningless sentences, and regardless of meaningfulness, there were three types of sentence structures. About a third of the meaningful sentences were so-called garden-path sen-tences that required updating of an initial parsing solution within the sentence (e.g., “As Toby sang a song played on the radio”). They were paired with structurally analogous sentences that were meaningless regardless of how they were parsed (e.g., “As Dan drank the milk rolled over the hill”). Another third of the sentences had the same structure but were disambiguated early by an additional pronoun with reference to the object, thus avoiding the garden path (e.g., “While Susan wrote the letter it fell off the table” vs. “As the chef stirred the soup it veered into the ditch”). In the remaining third of the sentences, the pronoun referred to the subject (“While Lisa drank the water she drove down the street” vs. “As the man walked the poodle he slept calmly”).
All sentences contained between eight and 11 words, and sen-tence length, use of “while” vs. “as,” and use of concrete first names were broadly counterbalanced across sentence categories. Because this processing task was more difficult than processing of equations, the maximum response time to sentences was set to 5 s, and list lengths ranged only from three to seven. The practice phase comprised three trials of set sizes two, three, and four. In all other respects, the SS and OS tasks were identical.
Spatial short-term memory (SSTM). This task followed closely the original version by Oberauer (1993). Subjects had to remember the location of a number of dots in a 10 ⫻ 10 grid. Following central presentation of an “Alert!” message for 1 s, the grid was shown, and a variable number of solid dots appeared, one by one, in individual cells of the grid for 900 ms each (interstimu-lus interval 100 ms).
3The WMC task battery in fact also included a fourth task—the original
version of the memory updating task as used by Oberauer (e.g., Oberauer, 2002; Oberauer et al., 2000). However, as this task served as a blueprint for our experimental task (explained later), we do not consider it further; including it into the estimation of WMC would not substantially alter our conclusions.
Subjects were instructed to remember the spatial relations be-tween the dots. That is, absolute dot positions were irrelevant; only the overall pattern of dots was to-be-remembered. After all dots were presented, subjects were cued to reproduce the pattern of dots. The cue was presented with a pattern mask that was the same size as the grid.
Subjects reproduced the remembered pattern of dots by clicking the cells using a standard computer mouse. Clicking on a dot again made it disappear, and subjects were allowed to correct the generated dots until they were satisfied with their response. They proceeded to the next trial by clicking a “Next” button at the bottom of the screen. No feedback was given.
The number of to-be-remembered dots varied from two to six, and there were two spatial distance conditions. In the “near” condition, all dots of a trial occurred within a 5⫻5 area (i.e., a quarter of the grid); in the “far” condition, dots could be placed anywhere in the grid. There were three trials for each combination of set size and spatial distance condition and hence 30 trials altogether. Dot positions were generated at random, with the constraint that no dots appeared in corner positions to prevent verbal coding. Again, the order of trials and dot sequences were fixed for all subjects.
WMU
The aim of the second experimental session was to disentangle the three presumed updating processes: retrieval (R), transforma-tion (T), and substitutransforma-tion (S).
Design and stimuli. We modified the memory updating (MU) task that was originally designed by Salthouse et al. (1991) and adapted for psychometric purposes by Oberauer et al. (2000). In this task, subjects encode an initial set of items and subsequently update them repeatedly. Hence, each MU trial consists of an encoding phase, an updating phase, and typically a final recall phase. We created eight experimental conditions by fully crossing the three factors R, T, and S while keeping other variables con-stant.
On each trial, subjects were presented with an initial set of three letters (ranging from A to Z), each presented in a separate rectan-gular frame on the screen (in a single row). To avoid re-use of the same letter during updating, we chose five as the minimal alpha-betic distance between the three input letters (i.e., with “A” in Frame 1, the closest Frame 2 and 3 letters were “V” and “F,” “F” and “K,” or “V” and “Q”; “A” and “Z” were considered neighbors because the alphabet “wrapped around”; see later section).
Thus, subjects always had to remember (and then update) three items. Previous research (cf. Oberauer et al., 2000) has shown this set size to provide an intermediate difficulty level ideal for the study of individual differences, as floor or ceiling effects are avoided. Oberauer (2002) additionally showed that the latency of individual updating steps is affected by whether they involve switching from one element in WM to another. Because we were not interested in those effects here, we held switching constant by moving to a new (randomly chosen) item on each step.
All updating operations were cued by the display of the appro-priate prompt in the frame that was to be updated. Each trial involved six updating steps. Subjects typed the result of the update (i.e., by pressing the corresponding letter on the keyboard) at every updating step. The six updating steps were followed by a recall test of the final contents of all frames.4
There were eight different updating conditions. From these conditions, all possible subsets of six were implemented across trials, resulting in 28 [(68)] trials. This implies that no updating
condition was repeated within a trial and that each condition occurred 21 (28ⴱ6/8) times in total. The conditions were created by fully crossing the three factors R, T, and S in a within-subjects design. We identify conditions by referring to these three letters; for example, the experimental condition involving all three pro-cesses is labeled R-T-S; the condition featuring only a transfor-mation is labeled rno-T-sno, and so forth. The experimental
condi-tions are summarized in Table 2, which presents the stimuli shown on a given updating step assuming that the letter “C” is the currently remembered content of the targeted frame.
Conditions involvingretrievalrequired subjects to retrieve the most recent letter of the cued frame from memory to perform the current operation. In contrast, this letter was provided with the cue in the no-retrieval conditions, meaning that the operation could be executed without retrieval of the previous content of the frame.
Transformation conditions involved a transformation of the selected letter by alphabet arithmetic. Only positive operations of ⫹ 1 and ⫹ 2 were used (with equal probability), and the alphabet wrapped around such that Z ⫹ 1 ⫽ A. Substitution
conditions resulted in the replacement of memory content with new information, whereas the outcome of no-substitution steps was identical to the information already held in memory.5
Condition rno-tno-snoinvolved none of the three processes, and
the currently remembered letter was simply presented again. This condition can be regarded as a baseline. Condition rno-tno-S was
identical to baseline except that a different letter was presented, which replaced the one in memory (pure S without R or T). In condition R-tno-sno, a “?” prompted subjects to retrieve the
cur-rently held letter and report it (pure R without T or S). Conditions R-T-S, rno-T-S, and rno-T-snoinvolved standard alpha-arithmetic
operations. For instance, in R-T-S, subjects had to add a number to whatever they currently remembered for that particular frame. In rno-T-sno, there was a transformation, but because its result was
4Because our focus was exclusively on updating, we do not report the
final recall data. The recall test was included only to ensure that people remembered all three items until after the last updating step.
5We stress that we define substitution as the replacement of memorized
information (which is bound to a frame location) by the result of an updating step in that frame. One could argue that our rno-T conditions (additionally) involved a second type of substitution, namely replacing the memory content with the operand of the transformation before actually beginning the transformation. We do not agree with this for two reasons. First, in that case, our rno-T-S condition would involve another substitution process and should hence be slower than our R-T-S condition—which it was not. Second, we conducted an additional experiment with 25 subjects in which we compared two conditions, both of which required transfor-mation and substitution but no retrieval. One condition exactly replicated the rno-T-S condition of the present experiment (i.e., the operand of the transformation differed from the current memory content, so when remem-bering the letter “C,” the transformation was either A⫹1 or B⫹2); the other used the current memory content as the transformation operand (i.e., when remembering “C,” the transformation was either C⫹1 or C⫹2). These two conditions differed neither in RT (difference 13 ms) nor accu-racy (difference .01 accuaccu-racy units). Hence, if there was no retrieval involved, it did not matter whether subjects used the letter they kept in memory or a newly presented letter when performing the transformation.
identical to the remembered letter, there was no substitution. Condition R-T-snowas designed as a transformation that does not
involve substitution and hence does not change memory content (“?⫹0”). In condition R-tno-S, subjects were presented with an
arrow that linked one frame with another, indicating that they should retrieve and then copy the letter from one frame to the other as indicated by the arrow, thus requiring a retrieval and a substi-tution but no transformation (other than a spatial “relocation”). Note that conditions R-tno-S and R-T-snowere required to permit
the orthogonal combination of all three experimental variables, although this mandated the use of operations that differed from those in the other conditions (e.g., “⫹0” to avoid a substitution). We deal with the implications of these design decisions during data analysis.
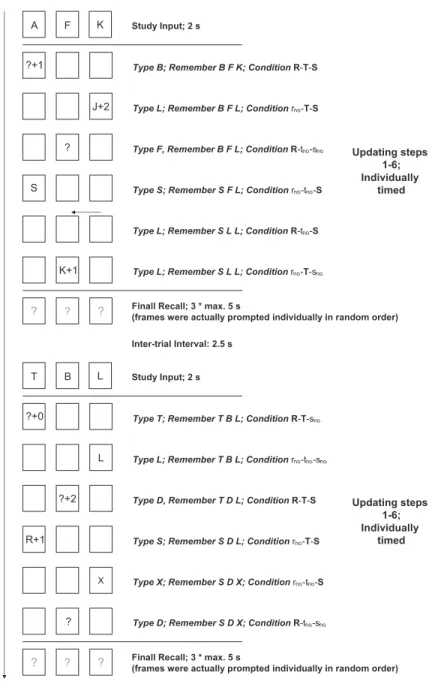
Procedure. The trial sequence (of two sample trials) is illus-trated in Figure 1: Each trial was initiated by a key press. The starting letters were presented in their frames, all at once, for 2 s. Then the frames were cleared, and the first updating instruction (as summarized in Table 2) was displayed in a randomly selected frame. Subjects had to carry out the operation required by the instruction, type the result within a specified time limit (explained later), and remember the result as the new content of that frame from there on. If no response was detected within the time limit, an error was recorded and the next step commenced with display of a new instruction in a new frame. No feedback was given after a response, and responses were not echoed on the screen. The instruction for each step was presented immediately after the response of the previous step. After six such steps, final recall was signaled by pink question marks presented one by one in each of the frames in random order, and subjects were required to type the remembered content for that frame.
The timing constraint for recall was 5 s per frame. Feedback was provided after the final memory test at the end of each trial, showing subjects the number of correct responses they obtained out of a total of three. The intertrial interval was 2.5 s.
Before the experimental trials began, subjects were given a number of practice trials (three with only one frame, three with two, and four with three frames). All eight conditions were cov-ered in the practice trials. There was a break after the practice phase and also halfway through the session. The session took approximately 25 min.
To account for individual differences in typing speed, we calcu-lated time limits for typing of the results of individual updating steps on an individual basis. The time limit was three times the median of reaction times (RTs) in the three-frame practice trials, calculated separately for conditions involving and not involving transformation
(pilot testing suggested that transformation would have a significant impact on RT). Mean deadlines were 7.94 s and 4.91 s for transfor-mation and no-transfortransfor-mation steps, respectively. This manipulation ensured that all subjects were given sufficient time to complete the operations during the experiment, without however providing them with excess slack time during which to rehearse.
Results
WMC Measures
Dependent measures in all WMC tasks were final correct-in-position recall scores (with the exception of the span-task processing components, where the dependent measure was simply the rate of correct responses). We scored all WM tasks using partial credit scoring (cf. Conway et al., 2005). For instance, a subject correctly remembering five out of six letters in a span-task trial would score 5/6 on that trial, and the total score would be calculated as the mean of these partial scores across trials. Chance performance level in all tasks was close to zero (e.g., 1/21⫽.05 in the span tasks, as no vowels were used). Descriptive results of the WMC battery are summarized in Table 3. The task intercorrelations are given in Table 4.
WMU
As mentioned earlier, data from five subjects were excluded from all analyses because they failed to comply with updating instructions in condition R-T-S of the WMU session, as revealed by an updating performance of below 0.2 in that condition (no such problems occurred in the other conditions). The mean performance of the five eliminated subjects was 0.191, which was 2.7 standard deviations below the condition mean.
Descriptive data. Mean updating performance and RTs are shown in Table 5. RT data are based on correct updating steps only. Responses with RTs below 300 ms were excluded from consideration.
Regression analyses. We first analyzed the data via multi-level regression. Multimulti-level regression (also known ashierarchical regressionormixed-effects modeling; see, e.g., Pinheiro & Bates, 2000) permits an aggregate analysis of data from all subjects without confounding within- and between-subject variability and has been used previously to analyze data in short-term memory (for details, see, e.g., Lewandowsky, Brown, Wright, & Nimmo, 2006). We used the lmer function of the R programming language (Bates, 2007; R Development Core Team, 2008) for the multilevel regressions; we obtainedpvalues via Markov Chain Monte Carlo Table 2
Conditions Used in the Working Memory Updating Session, With Examples of Updating Prompts
Variable
T tno
R rno R rno
S ?⫹1 or ?⫹2 A⫹1 or B⫹2 3 X
Sno ?⫹0 A⫹2 or B⫹1 ? C
Note. Examples of prompts assume that the letter “C” is currently memorized in the frame being updated. R⫽
retrieval involved; T⫽transformation involved; S⫽substitution involved; rno⫽retrieval not involved; tno⫽ transformation not involved; sno⫽substitution not involved.
simulations (5,000 samples) using the mcmcpvalue function (Plummer, Best, Cowles, & Vines, 2008).
In both accuracy and RT analyses, the independent variables (R, T, and S) were dummy coded (e.g., 0 and 1 for absence and presence, respectively, of a substitution). The variable T, however, was further decomposed. First, we used dummy variables T1 and T2 to accommodate the fact that the difficulty of a transformation varies with the size of the operand (Zbrodof, 1999). We used T1 as the baseline, so all transformation conditions were dummy coded with T1 ⫽ 1, and all remaining (nontransformation) conditions were set to T1⫽0. Transformations involving a ⫹2 operation were additionally coded as T2⫽1. That is, T1 and T2 were coded incrementally, so a⫹2 operation would be coded as 1 on both T1 and T2 factors whereas a⫹1 operation would be coded as 1 and
0, respectively. For the zero-transformation (? ⫹ 0) condition R-T-sno, we further introduced a dummy-coded variable T0.
Al-though technically involving a transformation, this condition re-quired little more than retrieval of the current frame content and therefore is likely to take less time, and incur fewer errors, than adding 1. T0 was set to 1 for condition R-T-snoand was 0 for all
other conditions (so a⫹0 operation was coded 1, 1, and 0 on T0, T1, and T2).
Finally, condition R-tno-S involved not only retrieval and
sub-stitution, but also— unlike the other conditions—an attentional shift from one frame to another. Therefore, a switch parameter SW was incorporated to account for these extra frame switching costs. Similar to T0, this parameter was dummy coded 1 for condition R-tno-S but was 0 for all others.
K J+2 ? K+1 ? ? ? A F Study Input; 2 s Updating steps 1-6; Individually timed ?+1 S
Finall Recall; 3 * max. 5 s
(frames were actually prompted individually in random order) Inter-trial Interval: 2.5 s
Type B; Remember B F K; Condition R-T-S
Type L; Remember B F L; Condition rno-T-S
Type F, Remember B F L; Condition R-tno-sno
Type S; Remember S F L; Condition rno-tno-S
Type L; Remember S L L; Condition R-tno-S
Type L; Remember S L L; Condition rno-T-sno
time L L ?+2 R+1 X ? ? ? ? T B Study Input; 2 s ?+0
Finall Recall; 3 * max. 5 s
(frames were actually prompted individually in random order)
Type T; Remember T B L; Condition R-T-sno
Type L; Remember T B L; Condition rno-tno-sno
Type D, Remember T D L; Condition R-T-S
Type S; Remember S D L; Condition rno-T-S
Type X; Remember S D X; Condition rno-tno-S
Type D; Remember S D X; Condition R-tno-sno
Updating steps 1-6; Individually
timed
From our task analyses, the most straightforward and parsimo-nious assumption regarding the three processes of retrieval, trans-formation, and substitution would be to assume “chained indepen-dence”: a serial chain of principally independent processes. That is, one needs to retrieve information before one can transform it, and one needs to await the result of the transformation before one can use this result to substitute outdated information. Despite this “chaining” due to obvious sequential constraints, we assumed the processes per se to be independent. In terms of RT, such indepen-dence would be reflected in an additive regression model with no interactions. If one process takesxms and another process takesy
ms, then the two together should takex ⫹yms. In contrast, in terms of updating accuracy, independence would best be captured in a multiplicative model. If one process has a success probability of x and another process has a success probability of y, the probability that both will succeed is x ⴱ y. The probability of completing the whole step accurately is the product of the success probabilities of all component processes involved.
In the RT model, the beta weights of R, S, and T1 represent the estimated durations of retrieval, substitution, and the⫹1 trans-formation, respectively. In the accuracy model, these beta weights represent the estimated success probabilities of the same processes. The T2 and T0 codes require a somewhat different interpretation because they do not represent processing steps but rather serve to modify T1. In the RT model, T2 represents the additional time it takes to add 2 over and above adding 1, and T0 represents how much less time ⫹ 0 takes compared with ⫹ 1. Therefore, we expected the beta weight of T0 to be negative, whereas all other beta weights should be positive.
Likewise, in the accuracy model, T2 represents the proportional decrease of success probability for adding 2 relative to the success probability of adding 1, whereas T0 represents the proportional in-crease of success probability for the⫹0 transformation relative to the success probability of⫹1. Hence, T0 was expected to have a beta weight⬎1, whereas all other beta weights were expected to be⬍1.6
No interaction terms were included into the regression models initially. In all models, the independent variables were coded as both fixed and random effects, where the former represent the overall effects of those manipulations in the experiment (hence fixed effects estimate the group mean of each experimental effect and the intercept) and the latter represent individual variation in responsiveness to the experimental manipulations (hence random effects estimate individual differences in the size of experimental effects and of the intercept, expressed as standard deviations). We only report the fixed effects here because individual variation is examined later, in the section on structural equation modeling.
The updating accuracy (UpdAcc) model was as follows: UpdAcc⫽0.992ⴱ0.886Rⴱ0.914T1ⴱ1.065T0ⴱ0.934T2ⴱ0.972S
ⴱ
0.965SW.Note that the dummy variables are exponents in this case;
thus, a process not involved, coded as 0, figures as 1 in the chain of products and thereby has no effect on the predicted accuracy; an involved process is coded as 1 and hence contributes to the extent specified by the beta weight. This is particularly important to understand the effects of⫹0,⫹1, and⫹2 transformations: A “standard”⫹ 1 transformation will reduce baseline accuracy by the factor 0.91 according to the model (T0 and T2 drop out of the equation); a ⫹ 2 transformation would reduce accuracy by the factor 0.85 (0.91ⴱ0.93; T0 drops out), and a⫹0 “transformation” would reduce accuracy only by 0.97 (0.91ⴱ1.07; T2 drops out).7
This model yielded Akaike’s information criterion (AIC) ⫽ ⫺638.9, Bayesian information criterion (BIC) ⫽ ⫺464.9, log-likelihood (logLik)⫽354.5, coefficient of determination (squared correlation of fitted and observed values across all data points, CoD)⫽0.76. The analysis revealed a significant contribution of R (t⫽ ⫺8.74,p⬍.001), T1 (t⫽ ⫺6.12,p⬍.001), T0 (t⫽2.39,
p⬍.01), T2 (t⫽ ⫺4.28,p⬍.01), and S (t⫽ ⫺3.10,p⬍.01), but not SW (t⫽ ⫺1.36,p⫽.08).
6Technically, for the accuracy model, we used an additive regression
model but first log-transformed the accuracy data so that multiplicative factors were transformed into additive factors. After the regression, the estimated weights were then retransformed via an exponential transforma-tion to facilitate interpretatransforma-tion. It is those retransformed estimates that are presented in the regression model.
7Coding each type of transformation with such an incremental
combi-nation of variables has the advantage that the significance of each vari-able’s effect over and above the others can be assessed—for example, whether a⫹ 2 transformation significantly reduces accuracy over and above a ⫹ 1 transformation—although a discrete estimation of each transformation type would also be possible and equally appropriate.
Table 3
Descriptive Statistics of the Working Memory Tasks
Task Mean SE Range Skewness Kurtosis
Operation span Memory task .69 .013 .23–.94 ⫺1.10 2.03 Processing task .91 .006 .71–1.00 ⫺0.87 0.45 Sentence span Memory task .63 .018 .25–.96 ⫺0.22 ⫺0.78 Processing task .79 .009 .47–.92 ⫺1.22 1.81 Spatial short-term memory .85 .004 .73–.94 ⫺0.24 ⫺0.24
Table 4
Working Memory Tasks Intercorrelations
Task 1 2 3 4 5
1. Operation span — 2. Operation span processing task .41 — 3. Sentence span .50 .31 — 4. Sentence span processing task .12 .36 .21 — 5. Spatial short-term memory .30 .37 .27 .09 —
For the RT model, instead of estimating a switch parameter (SW) for condition R-tno-S, we maximized parsimony by using an
existing empirical estimate of the time taken to switch attention from one location to another, provided by Garavan (1998). We subtracted this estimate of 483 ms from the R-tno-S condition mean
of each subject before fitting the RT model, thus saving a free parameter that otherwise would have been required for SW.
The resulting updating RT (UpdRT) model was as follows: UpdRT ⫽ 1.300 ⫹ 0.039ⴱR ⫹ 1.201ⴱT1 ⫺ 0.941ⴱT0 ⫹ 0.579ⴱT2 ⫹ 0.296ⴱS. Here, the dummy variables can be inter-preted as factors; again, they are 1 if the process is involved in a certain condition, and 0 otherwise. The multilevel analysis with AIC ⫽ 1357, BIC ⫽ 1491, logLik ⫽ ⫺651.4, CoD ⫽ 0.91 revealed a significant contribution of T1 (t⫽29.02,p⬍.001), T0 (t⫽ ⫺13.32,p⬍.001), T2 (t⫽ 14.77,p⬍ .001), and S (t⫽ 12.11,p⬍.001), but no effect of R (t⬍1).
We next examined whether the fit of these models could be improved by adding pairwise interactions between the three experimental variables R, S, and T1.8Using likelihood ratio tests, we determined that for both the
accuracy and the RT model, there was no case in which the addition of interactions (we added between one and three interaction terms) im-proved the fit of the model, all2⬍3.4,p⬎.05, suggesting that our three
experimental variables were independent.
To summarize, we fit regression models to both accuracy and response times. The analyses revealed that the effects of transfor-mation, retrieval, and substitution were independent and showed no sign of interaction for either accuracy or RT. In terms of updating accuracy, the largest effect was associated with retrieval, which introduced errors, leading to a drop in performance by more than 10% whenever information had to be retrieved. Perhaps surprisingly, this performance drop was not mirrored in response latency, as we found that the requirement to retrieve information from memory did not slow people at all.
By contrast, the requirement to substitute information in memory was a time-consuming process, taking about 300 ms irrespective of whether the new letter was generated by a transformation or simply presented. Unlike retrieval, substitution of information had only a small effect on the accuracy of updating. The fact that substitution did not affect accuracy much is perhaps not surprising when we consider that errors in substitution primarily affect the accuracy on future steps, not necessarily on the present step. People can enter the correct letter and then fail to establish that letter as the new content of the current
frame in their memory, which would lead to an error on the next time they retrieve the content of the same frame.
Finally, as expected, transformations had a large impact on RT—the more demanding the transformation of memory content, the more time it required. Transformations also contributed to errors, especially when the transformation involved moving two steps up in the alphabet. We defer further discussion of these results until all analyses have been presented.
Linking WMC and WMU
To investigate the relation between WMC and WMU, we used structural equation modeling (SEM). SEM is typically used to capture individual differences and correlational dependencies be-tween latent variables, without regard to experimental manipula-tions or differences between means. In the present case, we ex-tended this standard approach by also modeling mean RT and accuracy for each experimental condition. We thus constructed an SEM model that concurrently captured both interindividual vari-ation and experimental effects. The general approach has been outlined in Oberauer, Wilhelm, and Schmiedek (2005).
On the basis of the preceding regression analyses, we initially focused on models that preserved the independent (additive) struc-ture among experimental variables as far as possible (note that, again, a technically additive model was applied to log-transformed accuracies to capture the multiplicative relationship).
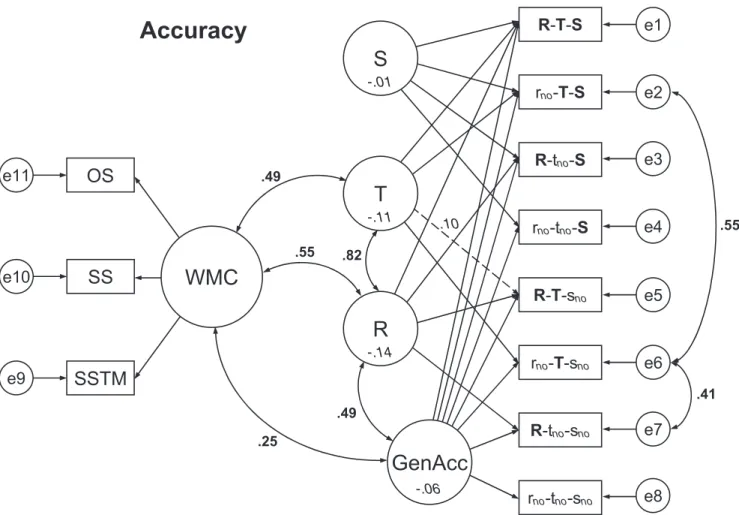
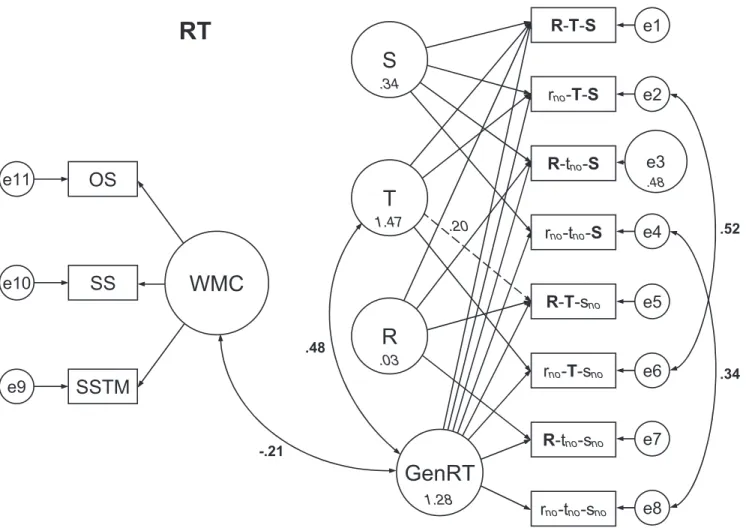
The SEM models for accuracy and RT are depicted in Figures 2 and 3 respectively. For increased readability, the figures show all significantstandardizedweights between latent variables (in bold, drawn next to the appropriate links) and all estimated
unstandard-8Interactions involving T0 and T2 could not be assessed because they
were not fully crossed with S and R, respectively. We regard T1 as the baseline that represents the effect of a typical transformative operation (incrementing the letter by one), whereas T0 and T2 only reflect savings or costs, respectively, involved in specific deviations from that baseline; therefore, we regard interactions involving T0 and T2 as less important. We also could not assess the three-way interaction of R, S, and T1 because that interaction is redundant with T0 (i.e., the three-way interaction term captures a deviation of a single cell from the pattern expected by the full model without the three-way, and T0 captures exactly the same), thereby making the model unidentifiable.
Table 5
Accuracy of Updating and Reaction Times in the Working Memory Updating Task
Variable
T tno
R rno R rno
Mean SE Mean SE Mean SE Mean SE
S Accuracy .76 .016 .87 .011 .82 .014 .98 .005 RT (ms) 3115 63 3009 69 2141 50 1642 37 Sno Accuracy .85 .013 .89 .011 .87 .012 .99 .005 RT (ms) 1599 35 2803 69 1297 24 1272 29
Note. Scale for accuracy measures is from 0 to 1. R⫽retrieval involved; T⫽transformation involved; S⫽substitution involved; rno⫽retrieval not involved; tno⫽transformation not involved; sno⫽substitution not involved; RT⫽reaction time.
ized means of the latent variables (in italics, drawn inside the variables themselves; note that latent means not shown in the figure were set to 0). To prevent clutter, no other estimates are shown in the figures. Those remaining estimates are instead pre-sented in Tables 6, 7, and 8.
The models consisted of two measurement models— one for the WMC part and one for the updating part. The WMC part had three manifest (i.e., observed) variables— one for each task of the WMC test battery—which were linked to a single WMC latent factor. The updating part had eight observed variables— one correspond-ing to each of the eight experimental conditions—that were con-nected to latent factors corresponding to the experimental variables R, T, and S, and a general factor accounting for the general level of performance (this corresponds to the intercept in regression).
Measurement Models
Measurement model for WMC. In the WMC measurement model, the mean of WMC was set to 0 and its variance to 1 to provide a scale for the factor and allow for identification. This also made the unstandardized solution more interpretable, which we were particu-larly interested in as it provides intercept and slope estimates on the original scale of measurement (further details provided later).
Measurement model for WMU. Models with the same basic structure were applied to the mean RTs and log-transformed ac-curacies, as well as their variances and covariances, in the eight design cells. In Figures 2 and 3, these eight manifest variables are labeled by the experimental condition code to which they refer (e.g., R-T-sno).
WMC
r
no-t
no-s
noR
-
T
-
S
r
no-
T
-
S
R
-t
no-
S
r
no-t
no-
S
R
-
T
-s
nor
no-
T
-s
noR
-t
no-s
noGenAcc
S
T
R
-.06 -.14 -.11 -.01e1
e2
e3
e5
e6
e7
.55 .49 .25e11
OS
e10
SS
e9
SSTM
Accuracy
.10 .82 .49 .55 .41e4
e8
Figure 2. Graphical representation of the structural equation model for accuracy, showing the prediction of latent updating factors GenAcc (general accuracy), R (retrieval), T (transformation), and S (substitution) by a latent working memory capacity (WMC) factor. Manifest accuracy variables reflect log-transformed accuracy data referring to the eight respective experimental conditions. WMC-related manifest variables reflect mean performance in WMC tasks OS (operation span), SS (sentence span), and SSTM (spatial short-term memory). Estimated standardized weights (correlations, in boldface) are presented adjacent to latent connections. Esti-mated unstandardized means (in log-accuracy units, italicized) are shown inside the latent factors. Means of latent factors that are not given in the figure (error variables and WMC factor) were fixed at 0. Regression weights in the working memory updating (WMU) measurement model were fixed at 1, with the exception of the link between T and the R-T-snovariable, which was freely estimated (dashed arrow with unstandardized estimate in italics). All estimated covariances provided in the figure are (marginally) significant,p⬍.051 (see upper panel of Table 8); all estimated means are significantly different from 0,p⬍.001. e1– e11⫽error variables.
To confirm the reliability of measures obtained from the exper-imental WMU task, we split the 28 trials into four sets of seven and calculated Cronbach’s alpha on the means of each subset of trials. This revealed an alpha of 0.96 for the RT data and an alpha of 0.89 for the accuracy data, showing high internal reliability.
There were four latent variables. One of them reflected baseline performance common to all design cells, and therefore all manifest variables had loadings on it. The remaining three factors reflected the experimental manipulations (R, T, and S). The factor R re-ceived loadings from the four manifest variables representing performance in conditions that required retrieval (i.e., conditions R-T-S, R-tno-S, R-T-sno, and R-tno-sno) but not from the remaining
four manifest variables representing conditions without retrieval (implying that their loadings were fixed to 0). In the same way, variables reflecting conditions with transformations received load-ings on factor T and variables with substitution received loadload-ings on factor S.
Constraints on the Models
We imposed a number of strong constraints on our models that are typically absent in SEM applications. First, all loadings be-tween manifest and latent variables in the WMU measurement models were fixed to 1. In addition, the intercepts of the manifest
GenRT
S
T
R
e3
.48 .48 .52 .34 .34 1.47 .03 1.28RT
r
no-t
no-s
noR
-
T
-
S
r
no-
T
-
S
R
-t
no-
S
r
no-t
no-
S
R
-
T
-s
nor
no-
T
-s
noR
-t
no-s
noe1
e2
e4
e5
e6
e7
e8
.20e11
OS
e10
SS
e9
SSTM
WMC
-.21Figure 3. Graphical representation of the structural equation model for reaction time (RT), showing the prediction of latent updating factors GenRT (general RT), R (retrieval), T (transformation), and S (substitution) by a latent working memory capacity (WMC) factor. Manifest RT variables reflect RT data referring to the eight respective experimental conditions. WMC-related manifest variables reflect mean performance in WMC tasks OS (operation span), SS (sentence span), and SSTM (spatial short-term memory). Estimated standardized weights (correlations, in boldface) are presented adjacent to latent connections. Estimated unstandardized means (in seconds, italicized) are shown inside the latent factors. Means of latent factors that are not given in the figure (error variables and WMC factor) were fixed at 0. Regression weights in the working memory updating (WMU) measurement model were fixed at 1, with the exception of the link between T and the R-T-snovariable, which was freely estimated (dashed arrow with unstandardized estimate in italics). Error term e3 was fixed to an independently derived estimate. All estimated covariances provided in the figure are at least marginally significant,p⬍.08 (see lower panel of Table 8); all estimated means are significantly different from 0,p⬍.001, except the estimated mean of R,p⫽.16. e1– e11⫽error variables.
variables were fixed to 0, as were the means of the error terms associated with them.
The rationales for these constraints were as follows. First, the additivity suggested by the regression is captured by the fixed loadings because they imply that each factor has the same effect on all conditions that load on it—for instance, substitution increases RT by the same amount in all four design cells involving substi-tution. Second, fixing the intercepts of manifest variables and their error means to 0 implies that no individual condition had a mean higher or lower than that predicted from the additive model.
Thus, the estimated mean of the general factor represents the baseline level of performance (i.e., the intercept of the additive model) and the estimated means of the three factors that represent components of updating reflect the mean effect of each experi-mental manipulation. Correspondingly, the estimated variances of the factors reflect the individual differences in baseline perfor-mance and in the magnitude of the experimental effects, respec-tively. For both RTs and accuracies, we had to relax these strong constraints of the purely additive model at a few points, either based on theoretical considerations or, on a few occasions, based on deviations of the data from the additive model, as we will detail later.
Finally, in the overall structural models presented in the follow-ing sections, the covariances between the latent updatfollow-ing variables and the latent WMC variable reveal the extent to which individual variation in WMC relates to variation among individuals’ re-sponses to our experimental updating manipulations.
The Accuracy Model
For the accuracy model, the link between T and the manifest R-T-snovariable was allowed to vary freely, reflecting the
assump-tion that the “zero-transform” condiassump-tion R-T-snoentailed a smaller
effect of T than the other three conditions involving a transforma-tion. This represented a slight departure from a strict additive structure. Moreover, to achieve an acceptable model fit, we intro-duced correlations between error terms that arose from highly similar experimental conditions e2 and e6, and also e6 and e7. Finally, we set the variance of S to 0 because when it was freely estimated, the variance was slightly (and nonsignificantly) nega-tive. The implication of a zero variance estimate is that S contrib-uted a constant effect to performance without accounting for any interindividual variability.
We first fit the updating measurement model to the experimental data to ensure model identification (identification of the WMC measurement model was trivial because that model had 0 degrees of freedom). The fit of the updating measurement model was acceptable, 2(24)⫽ 43.59; comparative fit index (CFI) ⫽.96; root-mean-square error of approximation (RMSEA)⫽.09; stan-dardized root-mean-square residual (SRMR) ⫽ .052. After this was established, the measurement models were combined to yield the structural model.
Initially, WMC was linked to all updating-component factors, and links were then removed if they were insignificant and did not contribute to the model fit. Likewise, new links that were theoret-ically and empirtheoret-ically justifiable were added to improve the overall fit. The fit of the final accuracy model— depicted in Figure 2—was acceptable, 2(45) ⫽ 65.27; CFI ⫽ .97; RMSEA ⫽ .068; SRMR⫽ .051. The unstandardized coefficients of the accuracy model are summarized in the top panel of Table 8. To evaluate model fit correcting for nonnormality of the data, we performed a Table 7
Standardized and Unstandardized Weights of Working Memory Capacity Measurement Models
WMC weight OS SS SSTM Accuracy Standardized .72 .72 .36 Unstandardized .09 .12 .02 Reaction time Standardized .73 .69 .40 Unstandardized .09 .12 .02
Note. WMC⫽working memory capacity (latent factor); OS⫽operation span (manifest variable); SS⫽sentence span (manifest variable); SSTM⫽
spatial short-term memory (manifest variable).
Table 6
Standardized Weights of Working Memory Updating Measurement Models
Factor R-T-S rno-T-S R-tno-S rno-tno-S R-T-sno rno-T-sno R-tno-sno rno-tno-sno Accuracy GenAcc .21 .36 .25 .82 .29 .35 .30 .88 R .49 .58 .68 .70 T .30 .51 .04 .49 S 0 0 0 0 Reaction time GenRT .36 .34 .49 .62 .65 .33 .90 .81 R .13 .17 .23 .32 T .66 .61 .24 .60 S .28 .25 .37 .47
Note. R-T-S codes refer to log-accuracy measures (upper panel) or reaction time (RT) measures (lower panel) of respective experimental conditions (manifest variables). The only unstandardized weights that were not fixed were the accuracy and reaction time weights linking T and the R-T-snomanifest variable. These were estimated as .10 (accuracy) and .20 (RT), respectively. GenAcc⫽general accuracy (latent factor); R⫽retrieval (latent factor); T⫽
Bollen–Stine bootstrap (withN⫽1,000 samples), which indicated a good model fit.
We first consider the pattern of correlations among latent vari-ables (shown in Figure 2). WMC was found to correlate positively with overall updating accuracy (GenAcc), implying that people with high WMC have higher baseline performance on the WMU task. WMC also correlated positively with R and T. This implies that the accuracy cost incurred by the need to retrieve or transform information declined with increasing WMC. Furthermore, R was positively correlated with T and GenAcc. Hence, higher costs of retrieval were typically accompanied by higher transformation costs and lower levels of baseline performance. Although S con-tributed significantly to mean WMU accuracy, it had no variance and therefore could not correlate with WMC.9
Now consider the pattern of estimated means for the latent variables (shown inside the variables in Figure 2) that permit reconstruction (i.e., prediction from the model) of all observed performance variables. For example, if an operation involves T and S but not R, we can calculate the estimated updating accuracy by adding the (negative) contributions of T and S to the baseline performance variable GenAcc—any additional need for processing is assumed to reduce both accuracy (toward 0) and log-accuracy (toward⬁). Hence, we can calculate the log-accuracy in this case as⫺.06⫹(⫺.11)⫹(⫺.01)⫽ ⫺.18. We can then retransform the log-value into an accuracy estimate of exp(⫺.18)⫽.84 (alterna-tively, one could first retransform each log-operand and then multiply the resulting variables as in the corresponding regression analysis)—which corresponds closely to the observed level of performance (which was .87 in this case; see Table 5). The mean absolute deviation of the SEM estimates from the observed values across all conditions was less than .05 accuracy units, suggesting that the SEM model captured mean performance in all eight cells with good precision.
The RT Model
The principal architecture of this model was identical to that of the accuracy model. Again, the link between T and the manifest R-T-snoRT variable (i.e., the T0 transformation) was freely
esti-mated.
Error terms associated with the manifest variables were fixed to have a mean of 0, with the exception of e3, which was set to .483—the estimate of attentional-shift cost provided by Garavan (1998) that was used earlier in the regression analysis.10Again, in
order to achieve an acceptable model fit, we introduced correla-tions between error terms that arose from highly similar experi-mental conditions, namely, e4 and e8, and also e2 and e6.
Again, the memory-updating measurement model was fit to the data first, and the fit was found to be acceptable,2(24)⫽63.28; CFI ⫽ .94; RMSEA ⫽ .131; SRMR ⫽ .075. After this was established, the measurement models were combined to yield the structural model. The fit of the final RT model— depicted in Figure 3—was acceptable,2(47)⫽87.23; CFI⫽.94; RMSEA⫽ .094; SRMR⫽ .084. The unstandardized coefficients of the RT
9We confirmed this pattern by a “reverse” path model that predicted
WMC from the WMU components. We calculated this with paths (instead of correlations) going from R, T, S, and GenAcc to WMC. We found that R accounted for most of the variance in WMC, T accounted only for an insignificant amount, and S accounted for none (the weight from GenAcc to WMC was also nonsignificant; variance of the disturbance variable on WMC was significant, implying that there was unexplained variance left in WMC). This corroborated our finding that retrieval but not substitution is related to WMC, while the relationship between transformation and WMC seems to straddle the statistical detection boundary.
10If this parameter was freely estimated, the estimate was .514.
Table 8
Unstandardized Covariances of Latent Factors in Accuracy and Reaction Time Structural Equation Models Factors Estimate Confidence intervals p Mean SE Accuracy WMC–GenAcc .012 .006 [⫺.001, .041] .051 WMC–R .062 .014 [.034, .095] ⬍.001 WMC–T .033 .012 [.010, .060] .005 GenAcc–R .003 .001 [.000, .009] ⬍.001 R–T .006 .001 [.003, .011] ⬍.001 e2–e6 .006 .002 [.001, .016] ⬍.001 e6–e7 .003 .001 [.001, .006] ⬍.001 Reaction time WMC–GenRT –.05 .03 [⫺.107, .008] .077 GenRT–T .04 .01 [.017, .069] ⬍.001 e2–e6 .07 .02 [.037, .105] .002 e4–e8 .01 .01 [.002, .025] .031
Note. In the reaction time (RT) model, the marginally significant WMC–GenRT covariance was significant withp⬍.05 before removing the nonsignificant WMC–T link and was thus retained; 95% bias-corrected confidence intervals were derived from 1,000 bootstrap samples. WMC⫽working memory capacity; GenAcc⫽
general accuracy; R⫽retrieval; T⫽transformation; GenRT⫽general RT; e2, e4, e6, e7, and e8⫽error terms of conditions rno-T-S, rno-tno-S, rno-T-sno, R-tno-sno, and rno-tno-snoperformance variables.
model are summarized in the lower panel of Table 8. A Bollen– Stine bootstrap (N⫽1,000) again indicated good model fit.
Latent correlations are shown in Figure 3. A positive correlation was found between GenRT and T. Hence, longer transformation times were associated with longer baseline performance latencies. WMC correlated negatively with overall latency (GenRT; this covariance was marginally significant after we removed the non-significant link between WMC and T but was non-significant before removal), implying that people with higher WMC had lower baseline RTs. Although S contributed significantly to WMU mean latency and had a significant variance term, this experimental effect did not covary with WMC.
The estimated means shown in the figure again permit accurate reconstruction of all observed data. For example, if an operation involves T and S but not R, the RT predicted by the model is calculated as the GenRT mean plus T and S means, or 1.275⫹ 1.470 ⫹0.335⫽ 3.08 —the observed level of performance was 3.01 s (see Table 5). The mean absolute deviation of the SEM estimate from the observed values across all conditions was 232 ms. The only conditions whose estimates deviated considerably from the data were conditions R-tno-S and R-T-sno. The mean
deviation across the remaining six conditions was only 30 ms.
Summary of SEM Modeling
Our SEM models are readily summarized: First, they confirmed the independence of experimental variables that was suggested by the regression analyses. At the level of means, they provided an excellent fit of the data from the updating session. With the exception of RT estimates for conditions R-tno-S and R-T-sno,
SEM mean predictions were close to the observed condition means, with average deviations of 30 ms and less than .05 accu-racy units, respectively. Mirroring the regression analyses, we again found that transformations had a strong impact on both accuracy and especially RT, whereas substitutions had small but reliable effects, and retrieval had a large effect on accuracy but no effect on RT.
Second, the models captured the variance among individuals’ WMC and related it to the variation in the magnitude of the experimental effects. That is, in the accuracy model, WMC cor-related positively with overall accuracy on the updating task (GenAcc) as well as retrieval success (R, and also transformation success reflected in T, although this relation was apparently less reliable). In the RT model, a relation between GenRT and T could be observed, such that the higher the baseline RT reflected in GenRT, the larger the impact of T. The RT model additionally showed that WMC correlated negatively with overall updating latency GenRT. In both models, S contributed significantly to WMU performance but did not covary with WMC.
A possible criticism of our SEM models might be that the fit statistics reported did not always satisfy the criteria for a “good” fit (e.g., the requirement that RMSEA⬍.06; Hu & Bentler, 1999). In response, we emphasize that in order to capture both the interin-dividual (co-) variation in WMC and WMUandthe effects of our experimental manipulations, we made use of novel and highly constrained models (e.g., loadings for the S, T, and R latent variables were fixed at 1