Pa
ge
1
Research in Business and
Social Science
IJRBS Vol 7 No 2, ISSN: 2147-4478
Contents available at www.ssbfnet.com/ojshttps://doi.org/10.20525/ijrbs.v7i2.861
Operations Management and Performance of
Manufacturing Small and Medium Enterprises in
Kenya
Mwamisha D. Mkala
Corresponding Author, Department of Business and Entrepreneurship, School of Business. PhD
Student
Kenneth L. Wanjau
Professor of Entrepreneurship, Department of Business and Entrepreneurship, School of Business
Teresia N. Kyalo
Lecturer, Department of Business and Entrepreneurship, School of Business
Abstract
Manufacturing small and medium enterprises (SMEs) are the breeding ground for human capital competencies, creativity and innovation, which are important inputs for manufacturing competitiveness. In Kenya, manufacturing SMEs contribute 14% of gross domestic product (GDP), and train and employ 30% of the workforce. However, their growth and competitiveness are undermined by challenges in the firms’ operations management. Consequently, the firms struggle to survive as competitive enterprises, both domestically and globally. The purpose of this study was to establish how entrepreneurial orientation (EO) enhances the relationship between operations management and firm performance. Quantitative primary data were collected from managers of 83 firms registered by the Kenya Association of Manufacturers in the food and beverage sub-sector using a self-administered questionnaire. Structural equation modelling was used to analyse the data for relationships between the study variables. The study found a positive relationship between operations management and EO, and between EO and firm performance. The study also found that EO is a mediator of the relationship between operations management and performance of manufacturing SMEs in Kenya. The study recommends that for manufacturing SMEs to effectively deploy operations management competencies and gain global competitiveness, they must engage EO as a strategy to foment organisational experimentation and exploration and commercialize the resultant innovations. At the macroeconomic level, the government should support manufacturing SMEs through enactment and promotion of policies that enable operations managers to exploit their firm’s EO stock.
Key words: Operations Management; Business Plan; Production Schedules; Quality Control Measures
Peer-reviewed Academic Journal published by SSBFNET with respect to copyright holders.
Pa
ge
2
Introduction
Small and medium enterprise (SME) manufacturing firms contribute to prosperity of nations through economic growth, innovation and creativity, and demonstrate their impact through employment creation and income generation. Manufacturing has been noted to be the driver of economic growth because the income elasticity of demand for industrial goods is higher than for non-industrial goods (Kaldor, 1967). Globalization of manufacturing has enabled competitive manufacturing companies to deliver high-value job creation and increased living standards in many countries, immensely impacting the prosperity of nations and dramatically changing the nature of competition between emerging and developed nations as well as between companies (Swezey & McConaghy, 2011).
The pro-manufacturing policies of developed countries have facilitated installation of competitive manufacturing capabilities, which has enabled them to maintain an unchallenged lead in the manufacturing ecosystem. African countries, lagging far behind the developed world and the newly industrialized frontrunners, are struggling to catch up. In particluar, Kenyan manufacturing SMEs habitually experience poor total factor productivity growth rates that have been associated with, inter alia, “sub-optimal plant sizes, under-utilization of installed capacities, low levels of investment, de-investment from the sector, and limited technological advancement” (Chege, Ngui, & Kimuyu, 2015:9). Therefore, managers of manufacturing SMEs have to strategically build-up firm operational capabilities and matching synergistic resource combinations, which can in turn be used to develop unique value creation business models (Barney, 1991). The consequences of stagnation of Kenya’s growth in manufacturing capability is dismal manufacturing competitiveness, in stark contrast with comparable competitors such as Nicaragua, Cambodia, Vietnam and South Africa, (Farole & Mukim, 2013). To overturn this state of affairs requires focused strategic initiatives in the general macro-economic environment, and within an individual firm’s management structures. The avenue towards achieving manufacturing competitiveness for developing countries is to implement entrepreneurial orientation (EO) as a corporate strategy for carrying out manufacturing firm operations. Entrepreneurial orientation is a sustained preoccupation with entrepreneurial behaviours that facilitate entrance into an entrepreneurship habitat, and moreover create, sustain and grow a competitive niche in that habitat. Entrepreneurial orientation is therefore a habit which is not dependent on a particular phase of a business life cycle, but plays out throughout the business life. Vision-oriented manufacturing SMEs can enact EO to project them onto the high-performance pedestal (Mahmood & Hanafi, 2013; Ferreira & Azevedo, 2008), enable them to neutralize competition, safeguard their regional market turf, and forage into the international globalized market arena (Farole & Mukim, 2013). Hughes and Morgan (2007) underscored the need to investigate different ways in which EO influences firm performance. Lumpkin and Desss (1996) called for investigation of different conceptualizations of various antecedents, EO and performance constructs, in view of suggestions that factors internal and external to the firm may either mediate or moderate this relationship. Informed by this dialogue, some studies investigated EO as a moderator relating various antecedent variables and performance outcomes (e.g. Mburia, Wanjau & Kinyanjui, 2016). Other studies investigated EO as a mediator, exploring the main drivers and performance implications of EO for SMEs in times of economic crisis (e.g. Soininen, 2013), and others examined the mediating effect of competitive advantage on EO-performance relationship (e.g. Mahmood and Hanafi, 2013). However, the role of EO as a mediator of the relationship between operations management and performance of manufacturing SMEs has not been addressed.
This paper is organised as follows. The introduction section is succeeded by a review of theoretical and empirical literature. Then the conceptual framework is given, followed by the methodology, after which the results are presented and discussed. The paper then concludes, makes recommendations for practice, acknowledges limitations, and ends by suggesting directions for further research.
Literature Review
Strategic Entrepreneurship Concept
The strategic entrepreneurship concept addresses the forward-looking activities that enable a firm to achieve its corporate vision. As a unique and distinctive construct which integrates business strategy with
Peer-reviewed Academic Journal published by SSBFNET with respect to copyright holders.
Pa
ge
3
entrepreneurship (Luke, 2009), strategic entrepreneurship enables firms to create wealth through simultaneous opportunity-seeking and advantage-seeking behaviours, and results in superior firm performance. It is observed that small entrepreneurial ventures are adept at opportunity identification, but are less successful in developing the competitive advantages needed to extract economic rents from those opportunities (Ireland, Hitt, & Sirmon, 2003). In contrast, large established firms are quite effective in developing competitive advantages and extracting economic rents from entrepreneurial opportunities; however, they are less able to identify new opportunities (Ireland et al, 2003; Grant, 1991). Therefore, while the liabilities of smallness hinder small entrepreneurial firms from achieving superior performance, the rigidity of structural establishment attenuates the capabilities of big firms to exploit new opportunities in their environments. Melding the entrepreneurial agility of small firms and the strategic orientation of big firms is a practical solution that overcomes the disadvantages of both types of firms, while simultaneously appropriating the advantages of each (Luke, 2009). Strategic entrepreneurship advocates collaboration between small entrepreneurially adept firms and big structurally established firms to create a win-win symbiotic business relationship between both types of firms.
The acrimony and unpredictability that obtains in the modern business environment requires SMEs to make sense of the numbing effect of uncertainty and the plethora of offerings by the competition. Moreover, it is incumbent upon the resource-constrained SMEs to generate plausible plans for exploiting emerging opportunities in their environment, and then share these with their large enterprise strategic partners. Reciprocally, while riding on these SME skills, large enterprises can mentor their SME counterparts by availing management skills on formation of organizational structures to generate competitive advantage (Luke, 2009). This give-and-take relationship will enhance the abilities of both firm types to mount a better strategic response to risk and uncertainty. If manufacturing SMEs and large enterprises form functional exchange relationships, they will jointly appropriate several advantages and benefits. Based on their vision and mission commitments, manufacturing SMEs should make strategic decisions regarding collaborative alliances, which can assist them to achieve their performance goals. They should prudently select networks containing firms whose paths lie complementarily together with theirs (Luke, 2009), because from these networks they can gain enlightening insights to confront the challenges in the market place (Ireland et al,
2003). Functional collaboration opens possibilities to each partner to minimize their individual weaknesses by attaching the strengths of the other, enabling them to develop clarity of strategy to meaningfully navigate the uncertain economic environment.
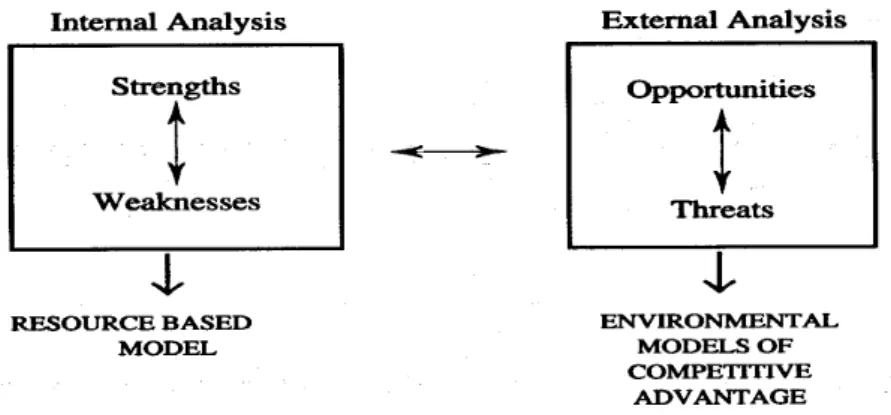
Resource-Based View (RBV)
The resource-based view (RBV), depicted in Figure 1, considers the interplay of the firm’s internal operations
vis-à-vis the external competitive environment, with the aim of strategizing the firm’s resource assembly and making the firm competitive in a turbulent business environment. Pioneered by Penrose (1959) and advanced by others (for example Wernerfelt 1984), the RBV combines the internal analysis of a firm’s business dynamics with the external analysis of the industry and the competitive environment. The basis for a firm’s competitive advantage is the application of a bundle of valuable tangible or intangible resources that it controls. So that these resources can be used to transform a short-run competitive advantage into a sustained competitive advantage, they have to be heterogeneous in nature and not transferable, and difficult to imitate or substitute (Barney, 1991).
Generally, a firm creates economic value by using either of two approaches – differentiation-based competitive advantage or efficiency-based competitive advantage (Peteraf & Barney, 2003). Differentiation-based competitive advantage enables a firm to achieve superior benefits which in turn enhance customer loyalty and perceived quality. Efficiency-based competitive advantage enables a firm to achieve greater pricing flexibility and the ability to increase available surplus. Therefore, a firm that can exploit its resource-capability combinations can raise its performance in ways difficult for competitors to mimic. Manufacturing SMEs need to identify their key potential resources and evaluate whether they fulfil the necessary criteria of being valuable, rare, inimitable and non-substitutable (often abbreviated as VRIN). Performance advantages are achieved when valuable and rare combinations of resources and capabilities are applied to reduce costs, exploit market opportunities, and neutralize competitive threats (Peteraf & Barney, 2003). Every firm, regardless of its size, can achieve competitive advantage attributable to the uniqueness of its resource and
Peer-reviewed Academic Journal published by SSBFNET with respect to copyright holders.
Pa
ge
4
capability configuration. This implies that even common resources and capabilities can be assembled in valuable (unique) combinations to develop competitive advantage, thus bringing within reach the development of competitive advantage for all manufacturing SMEs. Also, the applicability of this theory is borne on the distinctiveness in competencies and assets (Wernerfelt, 1984). Since distinctive competencies and assets crystalize into an overall organizational capability, manufacturing SMEs should safeguard resources possessing the VRIN evaluations. Doing so empowers them to optimize their installed capacity and improve their performance.
Figure 1: Resource-based View (Source: Barney, 1991)
Operations Management
Operations management involves exercising executive oversight of a series of determined actions that add value to raw basic inputs or intermediate inputs to create outputs. Operations management includes both production operations and service operations which jointly result in desired outputs in a manufacturing SME (Brennan, 2011; Kumar & Suresh, 2009). The assembling of the operations design, implementation of the design and supervision of core functions and allied activities incidental to design implementation constitute one type of input into the production process; this input comprises the value creation process.
Another type of input is the raw basic input, or intermediate input as the case may be, which is fed into the production process, and to which value is added by the value creation process (Kumar & Suresh, 2009). The quality of the output is related to the quality of the inputs, comprehensiveness of the operation design, fidelity of the design implementation, and the thoroughness with which the production process is supervised. (Brennan, 2011).
Production process routines, coupled with the human resource component, facilitate the accrual of specific capabilities within firms. With time, these capabilities develop into inimitable competencies and enable the firm to gain competitive advantage. However, these competencies do not evolve through chance, but their progressive creation can be traced to deliberate strategy in operations design (Kumar & Suresh, 2009). Design implementation carries with it the desired effect of shaping and refining the capabilities and developing them into firm competencies.
Thus, the operations function of the firm is an iterative and cumulative process of competency development. Firm strategy should be embedded in operations management to enable formation of the firm’s competitive advantage (Brennan, 2011). A business plan, production schedules and quality control measures, when strategically employed to chart the production process, enable a firm to conduct focused operations management, which enhances competitive advantage and increases firm performance.
H01: Operations management has a positive effect on performance of manufacturing SMEs in Kenya.
Entrepreneurial Orentation (EO)
Researchers have embraced the importance of EO with much interest, popularized it and spinned off numerous studies on it (for example Arief, Thoyib, Sudiro and Rohman, 2013; Ambad & Wahab, 2013; Sánchez, 2012). Miller (1983) conceptualized EO as a basic unidimensional strategic orientation that manifests in three distinct behaviours – innovativeness, risk-taking propensity and proactivenss.
Peer-reviewed Academic Journal published by SSBFNET with respect to copyright holders.
Pa
ge
5
Innovativeness is concerned with supporting and encouraging new ideas, experimentation and creativity likely to result in new products, services or processes. Risk takinginvolves the willingness to make decisions that commit resources in the face of risk and uncertainty. Proactivenessis concerned with initiative to move first and fast and taking actions which secure and protect market share in anticipation of future demand (Ferreira & Azevedo, 2008; Lumpkin & Dess, 1996). To these three EO dimensions, Lumpkin and Dess (1996) added competitive aggressiveness and autonomy. They defined competitive aggressiveness as the intensity of a firm’s effort to outperform industry rivals, characterized by a strong offensive posture and a forceful response to competitor’s actions. Notably, while proactiveness focuses on taking the initiative toward clients, autonomy is based on notions of entrepreneurial independence to develop and implement an idea. Indulgence in EO dimensions can revamp the performance of manufacturing SMEs. However, the practice of entrepreneurial behaviours is predicated on effective installation and application of firm resources through competent management policies. It is instructive to channel firm operational strategies and resultant actions as instruments to exploit the entrepreneurial knack of the firm’s human resources. Thus, competent operations management has a coordinating role which can facilitate the conduct of entrepreneurial behaviours such as innovativeness, risk taking and proactiveness. Management strategies and actions that promote the manifestation of these dimensions in every enterprise function make EO to develop into an organisational culture, and hence to become the driving force for realizing the firm’s objectives, actualizing its vision and enabling it to establish a forceful posture among rivals in its industry (Ferreira & Azevedo, 2008; Lumpkin & Dess, 1996), increasing performance and sustaining growth (Ambad & Wahab, 2013; Mahmood & Hanafi, 2013; Ferreira & Azevedo, 2008).
H02: Operations management is positively related to EO in manufacturing SMEs in Kenya.
Firms that differentiate themselves by being entrepreneurial are able to produce unique and diverse products and thus leverage innovativeness as a major source of competitive advantage. Ferreira and Azevedo (2008) outlined six constraints that impede entrepreneurial behaviours in a firm; they are systems, structure, strategic direction, policies, people and culture. They observed that entrepreneurial firms appear to grow faster and enjoy greater market share and concluded that EO is necessary for firms to compete effectively in the market place. In hostile business environments, the EO dimension of proactiveness has a positive effect on firm performance (Ambad and Wahab 2013). Thus, even large firms need EO in order to ensure good performance. There is also empirical evidence that EO attenuates the negative effects of risk and uncertainty in acrimonious business environments (Frank, Kessler and Fink’s (2010). This implies that EO is a must-have for SMEs in the manufacturing sector operating in a business environment that is increasingly characterised by economic turmoil.
H03: Entrepreneurial orientation has a positive influence on performance of manufacturing SMEs in Kenya.
Firm Performance
Firm performance is often used as a final depedent variable in strategic organizational research (Santos & Brito, 2012; Venkatraman & Ramanujam, 1986). A multi-dimensional model advanced by Santos and Brito (2012) to measure firm performance comprises financial and non-financial dimensions, which include “profitability, growth, customer satisfaction, employee satisfaction, social performance and environmental performance” (Santos & Brito, 2012:96). Performance is reflected in growth in its different dimensions, profitable trading, and the efficiency with which a firm is able to realize its output (Venkatraman & Ramanujam, 1986).
The performance of a manufacturing SMEs is attributed to the firm’s accumulated resources, operations management practices, and the way in which EO is engaged to exploit the resources (Sánchez, 2012). The appropriate functional synergy between resources, operations management practices and EO can sustain firm growth and profitability; even large firms operating in hostile envirnments must employ this synergy to sustain their growth (Ambad & Wahab, 2013). A ubiquitous presence of EO to leverage an SME’s resources raises its overall corporate capability and enables it to function with increasing efficiency. Striving for efficiency gains refines the elemental inputs of performance. A firm that has an enhanced operations
Peer-reviewed Academic Journal published by SSBFNET with respect to copyright holders.
Pa
ge
6
management strategy and embraces EO is guaranteed of superior performance, which may be defined by three dimensions – growth, profitability and efficiency (Mokamba, Gakure, & Keraro, 2013).
H04: Entrepreneurial orientation mediates the relationship between operations management and performance of manufacturing SMEs in Kenya.
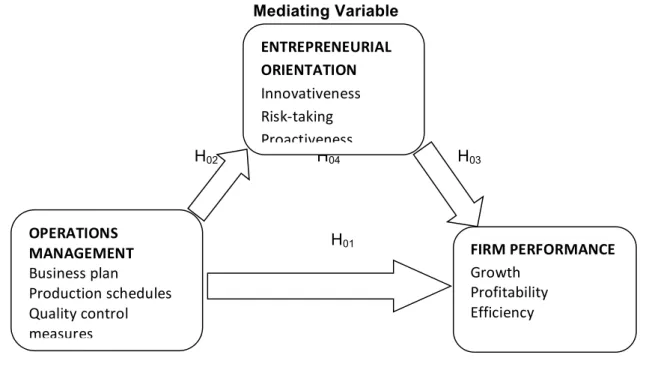
Conceptual Framework
Figure 2 shows the conceptual framework of the hypothesized model of the interrelated concepts of operations management, EO and firm performance, and their respective sub-constructs.
Mediating Variable
H
02H
04H
03H
01Independent Variable
Dependent Variable
Source: Adapted from Albert & Hayes (2003) in Hall, Sarkani, and Mazzuchi, (2011)
Figure 2: Conceptual Framework of this study
Research and Methodology
The study was a census of eighty-three SME food manufacturers registered with Kenya Association of Manufacturers (KAM). The food-manufacturing subsector was chosen because it is the most prolific in the Kenyan manufacturing ecosystem (KAM, 2015). The study was designed as a cross-sectional survey and employed quantitative methods, and the 2015 KAM register was used as the sampling frame. A structured self-administered questionnaire was used to solicit data from enterprise owners/managers, because they are the most conversant with their firms’ strategic position and make strategic decisions for the firm’s operations (Santos & Brito, 2012). Data analysis was carried out using the Statistical Package Software for Social Sciences (SPSS) Version 20 and Smart PLS 3 software developed by Ringle, Wende and Becker (2015). Seventy-six usable questionnaires were returned out of the eighty-three distributed, constituting an effective response rate of 92%. Prior to data analysis, the received questionnaires were verified for completeness, as a result of which four questionnaires were excluded from analysis because they were irredeemably incomplete.
FIRM PERFORMANCE
Growth
Profitability
Efficiency
ENTREPRENEURIAL
ORIENTATION
Innovativeness
Risk-taking
Proactiveness
OPERATIONS
MANAGEMENT
Business plan
Production schedules
Quality control
measures
Peer-reviewed Academic Journal published by SSBFNET with respect to copyright holders.
Pa
ge
7
Tests of Assumptions of the Study Variables
The collected primary data were tested for reliability, validity, common method variance, outliers, linearity, normality, multi-collinearity, and sphericity to verify that they fulfilled the various stipulated requirements to render them amenable for further statistical analysis.
Common Method Variance
Initially, efforts were made to prevent common method bias by subjecting the study questionnaire to rigorous interrogation by experts and pilot respondents and using the proffered feedback to improve its structure and content so that it could be totally self-administered without causing common method bias effects. It was also subjected to Herman’s single factor statistical test, which showed that the cumulative percentage of sums of squared loadings extracted was 44.8%; this was less than the 50% upper threshhold, beyond which there would be an indication of common method bias (Podsakoff, MacKenzie, Lee, & Podsakoff, 2003).
Outlier Results
Outliers were tested univariately by examining the standard scores of the composite values of the constructs. Tabachnick and Fidell (2007) posit that standard scores more than 3.29 are evidence of outliers. The z-scores in this study ranged from -3.02 to 1.14, thus indicating absence of outliers in the dataset.
Linearity Results
Pearson correlation coefficients were used to examine linearity. There was a high significant relationship between related first order constructs, indicating a linear relationship between them.
Normality
The measures of skewness and kurtosis were used to establish normality for all the study variables. Skewness metrics ranged from -2.624 to -0.047, which fitted between the limits of -3 and +3 (Curran, West and Finch, 1997). The kurtosis values ranged from -0.726 to 8.999, which was less than the upper threshhold of 10 for a normal distribution (Kline 2011).
Multi-collinearity
Multicollinearity was diagnosed using the variance inflation factor (VIF) for first order and second order constructs. The VIF values ranged from 1.961 to 5.105; this was less than the upper threshhold of 10 required for obviating the threat of multi-collinearity (Kline, 2011).
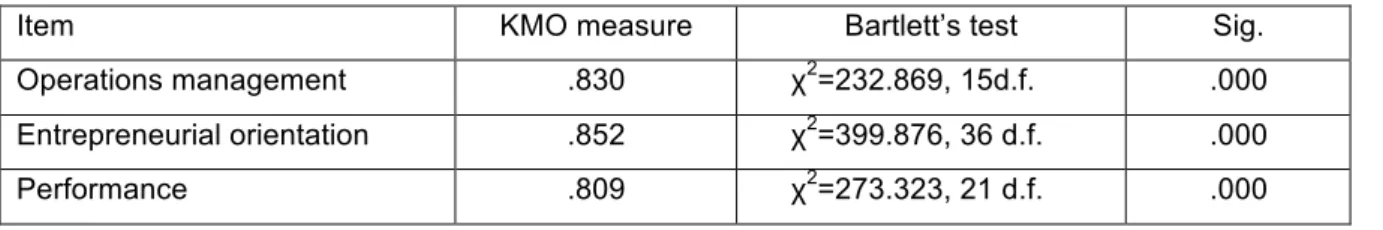
KMO and Bartlett’s Test of Sphericity
The Kaisser-Meyer-Olkin (KMO) and Bartlett’s test of sphericity were carried out on the study variables to determine their suitability for factor analysis. Table 1 shows the summarized results. It can be seen that the KMO measure for each construct was greater than the suggested minimum of 0.6 (Adams, Khan, Raeside, & White, 2007), and the hypothesis for Bartlett’s test of sphericity was rejected at p<.01. Thus, the study constructs were suitable for factor analysis.
Table 1: Results for KMO and Bartlett’s Test of Sphericity
Item KMO measure Bartlett’s test Sig.
Operations management .830 χ2=232.869, 15d.f. .000
Entrepreneurial orientation .852 χ2=399.876, 36 d.f. .000
Peer-reviewed Academic Journal published by SSBFNET with respect to copyright holders.
Pa
ge
8
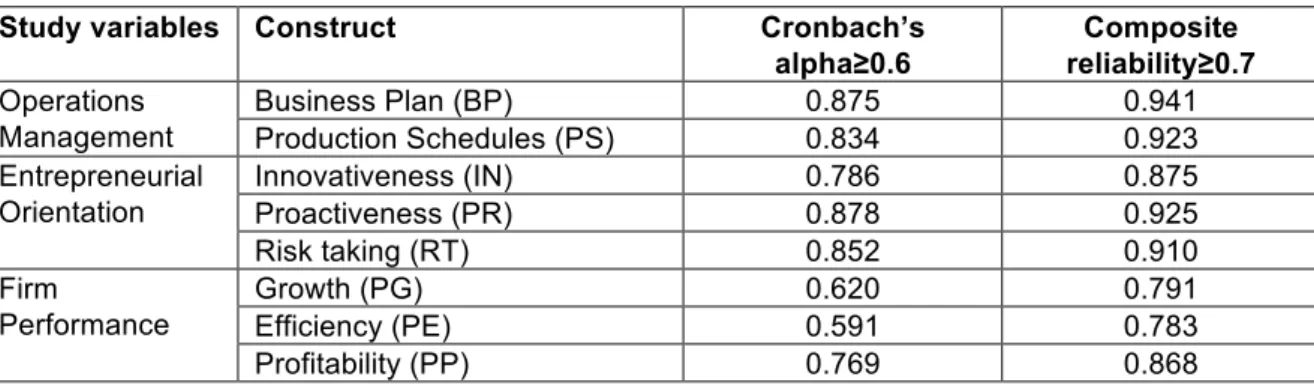
Construct Reliability Analysis
The indicator items for quality control (QC) policy had item-to-total correlations less than the stipulated minimum of 0.3 (Clark & Watson, 1995), necessitating the removal of the QC construct from further analysis. Table 2 shows the study variables and their respective first order constructs which were submitted for further analysis. It can be observed that the efficiency (PE) construct had Cronbach’s alpha value less than 0.6, which would seem to violate the requirements for SEM. However, Chin (2010) and Bacon, Sauer and Young (1995) submit that composite reliability is a sufficiently reliable measure of internal consistency because it takes into account the differences in weighting of measures, which is agreeable with the prioritization of indicators according to their reliability during PLS-SEM model estimation. Therefore, if composite reliability values are adequate, analysis can still be undertaken, even if some Cronbach’s alpha values may be below 0.6. Each of the measures of construct reliability reported in Table 2 were significant at 1%.
Table 2: Construct Reliability
Study variables Construct Cronbach’s
alpha≥0.6 Composite reliability≥0.7 Operations Management Business Plan (BP) 0.875 0.941 Production Schedules (PS) 0.834 0.923 Entrepreneurial Orientation Innovativeness (IN) 0.786 0.875 Proactiveness (PR) 0.878 0.925 Risk taking (RT) 0.852 0.910 Firm Performance Growth (PG) 0.620 0.791 Efficiency (PE) 0.591 0.783 Profitability (PP) 0.769 0.868
Validity Analysis
Table 3 displays the results of convergent and discriminant validity, which were assessed by examining Pearson correlation coefficients and average variance extracted (AVE). As shown, each construct is highly correlated with its own construct which it is intended to measure. This demonstrates acceptable discriminant validity because the constructs of the same variable load highly on the variables to which they belong. It is also noteworthy that the range between the constructs is small, indicating acceptable convergent validity. The values of AVE were all above 0.5 as required for SEM. The square roots of AVE values for the respective first order constructs are indicated in bold figures in the diagonal. This validity analysis shows that the data fulfilled both requirements of discriminant and convergent validity.
Table 3: Validity Analysis
**Correlation is significant at the 0.01 level (2-tailed) *Correlation is significant at the 0.05 level (2-tailed)
The bold figures in the diagonal are values of the square root of AVE for each respective construct. They demonstrate that the constructs have discriminant validity.
A.V.E. BP PS IN RT PR PG PP PE BP 0.889 .943 PS 0.857 .711** .926 IN 0.700 .359** .453** .837 RT 0.804 .267* .287* .723** .879 PR 0.772 .395** .443** .600** .518** .897 PG 0.563 .024 .111 .222 .295** .207 .756 PP 0.562 .045 .231* .333** .288* .262* .719** .818 PE 0.689 .189 .207 .397** .381** .378** .703** .637** .879
Peer-reviewed Academic Journal published by SSBFNET with respect to copyright holders.
Pa
ge
9
Result and Discussion
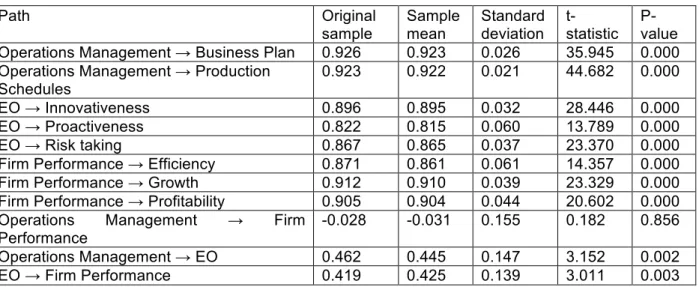
The relationships between the study variables, their sub-constructs and indicators were modeled reflectively. Table 4 shows the paths representing the relationships between the study variables and their sub-constructs. Operations management was found to be positively and highly correlated with business plan and production schedules, each of the relationships being significant at 1%. This implies that in manufacturing SMES the importance of these elements of operations management is recognised. In order to realise the corporate vision of manufacturing SMEs, all functions should be coordinated to integrate the efforts of all employees working in the firm. The success of the firm’s operational strategy is a function of every employee’s fidelity to the management policy. Likewise, EO was found to be positively and highly correlated with innovativeness, proactiveness and risk-taking, each of the relationships being significant at 1%. This means that the three dimensions used to represent the EO construct are quite reliable. It is also indicative of a positive attitude of manufacturing SMEs’ management towards entrepreneurial behaviours. Firm performance was also found to be positively and highly correlated with its dimensions of efficiency, growth and profitability (p=0.000 in each case), again signifying the reliability of these three dimensions as proxies for firm performance, and moreover, that manufacturing SMEs recognise these proxies as indicative of their performance.
The study did not establish a relationship between operations management and firm performance, (path weight = -0.031, p=0.856), contrary to hypothesis H01. Duarte, Brito, DiSerio and Martins (2009) obtained a similar finding; they did not find a significant relationship between operational practices and performance in their study on Brazilian manufacturing companies. However, the finding contradicts Battistoni, Bonacelli, Collado, & Schiraldi (2013), who established a significant relationship between production aspects of organisation management and performance. The failure to establish a significant relationship in this study could be attributed to the small number of firms studied. The significance of the relationship could also be context-specific, so that the results could be different if the wider macro environment in which manufacturing SMEs operate underwent an economic upgrade.
The path weight of the relationship between operations management and EO was 0.445 (p=0.002), supporting hypothesis H02. The positive and significant relationship indicates that the strategies that manufacturing SMEs assemble for their operations are important prerequisites for enactment of entrepreneurial behaviours. It also means that manufacturing SMEs are cognisant of the need to mount practical strategies to exploit the entrepreneurial instincts inherent in their workforce. Specifically, a business plan document and documented production schedules, information about which is effectively disseminated to all concerned stakeholders in a manufacturing SME, form the basis of motivation for the entrepreneurial behaviours of innovativeness, risk-taking and proactiveness. Where secrecy shrouds the contents of these documents, or where only some favoured sections of management are privy to them, the general operational workforce is denied the information they require for making important decisions to expedite operations on the shop floor and other front areas of the firm. Thus, while firms have to invest capital resources to build heterogeneous resources, they also have to invest in accumulating tacit resources to facilitate the conveyance of strategic information to the firm’s operational stakeholders. This will enable them to utilise the information to optimise extraction of rents from the capital resources. This also means that manufacturing SMEs must formulate proper strategies to rationalize their investments in dissemination and accumulation of the information asset. In consideration of their firm’s vision, managers of manufacturing SMEs have to match their non-human resources with human resources inclined towards entrepreneurial behaviours, so that there is a continuous joint availability of both human as well as non-human assets for optimum value creation. The path weight of the relationship between EO and performance was 0.425 (p=0.003), supporting hypothesis H03. The finding of a positive relationship between EO and firm performance confirms the findings of related extant studies such as Zehir, Gurolb, Karaboga and Kole (2016) and Arief et al (2013), and has important implications for manufacturing SMEs. Throughout the firm, behaviours that are associated with entrepreneurialism should be identified and encouraged. This implies that employees who are noted to harbour innovative ideas and practices are important assets for manufacturing SMEs, because the potential
Peer-reviewed Academic Journal published by SSBFNET with respect to copyright holders.
Pa
ge
10
to master and control the market is achievable through giving them latitude to express their innate innovative characteristics.
Tapping into employees’ EO will enable manufacturing SMEs to foment organisational exploration and experimentation and commercialisation of the resultant innovations. In the same way, the outgoing nature of a firm’s employees expressed through the firm’s presentation of its value created to customers, turns out to be an aggregate extroversion feature of a firm. Likewise, a high tolerance for failure by the management of manufacturing SMEs has potential to forment attendant economic dividents, as it can be used to profitably extract employees’ innovativeness through provision of resouces for exploration and experimentation. In this way, a firm’s EO can be activated through its human resource to realise increased firm performance. In the wider manufacturing ecosystem, inclusion of EO in strategies of manufacturing SMEs will enable them to be part of the fourth industrial revolution which includes smart manufacturing, robotics, artificial intelligence and the internet of things (IoT).
Table 4: Path Analysis
Path Original sample Sample mean Standard deviation t-statistic P-value Operations Management →Business Plan 0.926 0.923 0.026 35.945 0.000 Operations Management → Production
Schedules
0.923 0.922 0.021 44.682 0.000 EO → Innovativeness 0.896 0.895 0.032 28.446 0.000 EO → Proactiveness 0.822 0.815 0.060 13.789 0.000 EO → Risk taking 0.867 0.865 0.037 23.370 0.000 Firm Performance → Efficiency 0.871 0.861 0.061 14.357 0.000 Firm Performance → Growth 0.912 0.910 0.039 23.329 0.000 Firm Performance → Profitability 0.905 0.904 0.044 20.602 0.000 Operations Management → Firm
Performance
-0.028 -0.031 0.155 0.182 0.856 Operations Management → EO 0.462 0.445 0.147 3.152 0.002 EO → Firm Performance 0.419 0.425 0.139 3.011 0.003 To establish mediation, the distribution of data was subjected to Baron and Kenny’s (1986) allgorithm as modified by Zhao, Lynch, and Chen (2010). Table 5 shows the results of this procedure, which requires that first, the significance of the indirect (mediation) path be established, the outcome of which should then guide the analysis of the type of mediation or non-mediation.
From the bootstrap results, the indirect (mediation) path was positive and significant (a*b=0.188, p=0.035), indicating presence of mediation, with a 95%confidence interval excluding zero (from 0.042 to 0.397). The direct effect c (-0.031, p=0.856) was not significant. According to Zhao et al (2010) decision tree, this is demonstration of ‘indirect-only mediation’ (p. 204), otherwise labelled ‘full mediation’ by Baron and Kenny (1986). This is evidence for the hypothesized mediator (EO). It is unlikely that any other unidentified mediator was omitted, so EO was identified consistent with the hypothesized theoretical framework.
The finding tha EO fully mediates the relationship between operations management and performance of manufacturing SMEs confirms hypothesis H04. With a paucity of literature linking operations
manageement and firm performance through EO, this triune relationship implies that the benefits of effective operation of a firm’s non-human resources are limited by the extent to which EO is engaged to implement the firm’s straegies. Notably, the R2 of performance increased from 2.7% without mediation effect to 16.5% after mediation. Therefore, EO has a critical role of activating operations management in order to realise increased performance benefits for manufacturing SMEs.
Peer-reviewed Academic Journal published by SSBFNET with respect to copyright holders.
Pa
ge
11
Table 5: Mediation Analysis
Path Original sample Sample mean Std. dev. T-statistics P-values
Indirect (Path a*b) 0.194 0.188 0.092 2.109 0.035 Operations Management → EO
(Path a)
0.462 0.445 0.147 3.152 0.002 EO → Performance (Path b) 0.419 0.425 0.139 3.011 0.003 Direct path (Path c) - 0.028 - 0.031 0.155 0.182 0.856 Table 6 summarises the findings in respect of the study hypotheses.
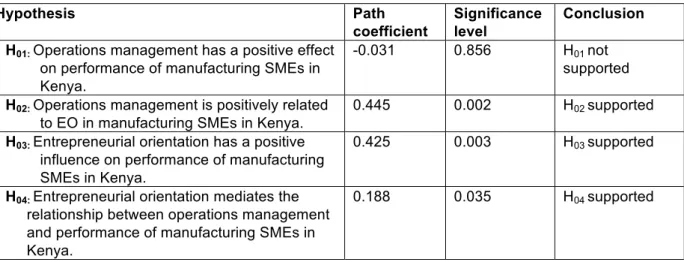
Table 6: Summary of Findings
Hypothesis Path
coefficient
Significance level
Conclusion H01:Operations management has a positive effect
on performance of manufacturing SMEs in Kenya.
-0.031 0.856 H01 not
supported H02:Operations management is positively related
to EO in manufacturing SMEs in Kenya.
0.445 0.002 H02 supported
H03:Entrepreneurial orientation has a positive
influence on performance of manufacturing SMEs in Kenya.
0.425 0.003 H03 supported
H04:Entrepreneurial orientation mediates the
relationship between operations management and performance of manufacturing SMEs in Kenya.
0.188 0.035 H04 supported
Conclusion
The study established the mediating effect of EO on the relationship between operations management and firm performance. Thus, it makes an important contribution to the literature relating to the intricate relationship involving operations management, EO and firm performance, which is an area hardly addressed by extant studies. Specifically, it is difficult to come by any research that has attended to EO as a mediator of the relationship between operations management and performance in manufacturing SMEs. According to the current study, it appears that operations management is a prerequisite for EO practice in manufacturing SMEs. By providing strategic information in the form of access to the requirements for implementing the business plan policy, keeping the concerned SME operational staff informed about production schedules, and disseminating the necessary information to all relevant organisational stakeholders, the operations management function sets the stage for organisational motivation, which can in turn be leveraged to activate the entrepreneurial behaviour of employees. This is important information that firm management should utilise to ensure that employees are given latitude to express their entrepreneurial behaviours at the firm level.
This study recommends that managers of manufacturing SMEs should prioritise an organisational policy shift that embeds entrepreneurial orientation in all the firm’s operations. It also recommends that the government should support manufacturing SMEs through enactment and promotion of policies supportive of business management practices which exploit a firm’s stock of EO.
The applicability of the findings of this study should be done with caution, as it is limited due to the use of a single manufacturing sector (food and beverage) to generate the results obtained. Future studies could include the full spectrum of all manufacturing sectors in order to generate results generalizable to the whole manufacturing industry. The cross-sectional design of the study was also a limitation, since the captured data are unique to the time-period during which data were collected. Future studies could be designed as longitudinal research in order to produce findings that resonate with the evolving economic dynamics. Future replicative studies pursuing the phenomenon of the relationship between operations management, EO and
Peer-reviewed Academic Journal published by SSBFNET with respect to copyright holders.
Pa
ge
12
firm performance could examine the relationship to establish if a different type of mediation may exist, other than the indirect-only type that this study found.
References
Adams, J., Khan, H. T., Raeside, R., & White, D. (2007). Research Methods for for Graduate Business and Social Science Students. New Delhi: Response Books.
Ambad, S. N., & Wahab, K. A. (2013). Entrepreneurial Orientation among Large Firms in Malaysia: Contingent Effects of Hostile Environments. International Journal of Business and Social Science, Vol. 4 (No. 16), 96-107.
Arief, M., Thoyib, A., Sudiro, A., & Rohman, F. (2013). The Effect of Entrepreneurial Orientation on Firm Performance Through Strategic Flexibility: A Study on the SMEs Cluster in Malang. Journal of Management Research, Vol. 5(No. 3), 44-61.
Bacon, D. R., Sauer, P. L., & Young, M. (1995, June). Composite Reliability in Structural Equations Modeling.
Educational and Psychological Measurement, 55(3), 394-406. doi:10.1177/0013164495055003003 Barney, J. (1991). Firm Resources and Sustained Competitive Advantage. Journal of Management, 17(1),
99-120. doi:10.1177/014920639101700108
Baron, R. M., & Kenny, D. A. (1986). The Moderator-Mediator Variable Distinction in Social Psychological Research: Conceptual, Strategic and Statistical Considerations. Journal of Personality and Social Psychology, 51(6), 1173-1182. doi:10.1.1.169.4836
Battistoni, E., Bonacelli, A., Collado, A. F., & Schiraldi, M. M. (2013). An Analysis of the Effect of Operations Management Practices on Performance. International Journal of Engineering Business Management, Vol. 5(44), 1-11. doi:10.5772/56919
Brennan, L. L. (2011). Operations Management. New York: McGraw-Hill.
Chege, J., Ngui, D., & Kimuyu, P. (2015). Scoping Paper on Kenyan Manufacturing. Learning to Compete Working Papers(Working Paper No. 025), 1-32.
Chin, W. W. (2010). Chapter 28 - How to Write up and Report PLS Analyses. In V. Esposito Vinzi, W. Chin, J. Henseler, & H. Wang, Handbook of Partial Least Squares, 1st ed. (pp. 655-690). Springer. doi:10.1007/978-3-540-32827-8_29
Clark, L. A., & Watson, D. (1995). Construct Validity: Basic Issues in Objective Scale Development.
Pshcychological Assessment, 7(3), 309-319.
Curran, P. J., West, S. G., & Finch, J. F. (1997). The Robustness of Test Statistics to Nonnormality and Specification Error in Confirmatory Factor Analysis. Psychological Methods, 1, 16–29. doi:10.1037//1082-989X.1.1.16
Duarte, A. L., Brito, L. A., DiSerio, L. C., & Martins, G. S. (2011). Operational Practices and Performance: An Empirical Analysis of Brazilian Manufacturing Companies. Brazilian Administration Review, 8(5), 395-411.
Farole, T., & Mukim, M. (2013). Manufacturing Export Competitiveness in Kenya: A Policy Note on Revitalizing and Diversifying Kenya’s Manufacturing Sector. Republic of Kenya. Washington DC: World Bank.
Ferreira, J., & Azevedo, S. G. (2008). Entrepreneurial Orientation and Growth of Firms. Problems and Perspectives in Management, Vol 6(Iss 1), 82-88.
Frank, H., Kessler, A., & Fink, M. (2010, April 2010). Entrepreneurial Orientation and Business Performance - A Replication Study. Schmalenbach Business Review, Vol. 62(2), 175-198. doi:10.1007/BF03396804
Hall, J. H., Sarkani, S., & Mazzuchi, T. A. (2011). Impacts of Organizational Capabilities in Information Security. Information Management and Computer Security, Vol. 19(Iss. 3), 155-176. doi:10.1108/09685221111153546
Hughes, M., & Morgan, R. E. (2007). Deconstructing the Relationship between Entrepreneurial Orientation and Business Performance at the Embryonic Stage of Firm Growth. Industrial Marketing Management, 36, 651–661. doi:10.1016/j.indmarman.2006.04.003
Peer-reviewed Academic Journal published by SSBFNET with respect to copyright holders.
Pa
ge
13
Ireland, R. D., Hitt, M. A., & Sirmon, D. G. (2003). A Model of Strategic Entrepreneurship: The Construct and its Dimensions. Journal of Management, 29(6), 963–989. doi:10.1016/S0149-2063(03)00086-2 Kaldor, N. (1967). Strategic Factors in Economic Development. Ithaca, NY: Cornell University Press. KAM. (2015). Kenya Manufacturers and Exporters 2015 Directory, 11th ed. Nairobi: Kenya Association of
Manufacturers.
Kline, R. B. (2011). Principles and Practice of Structural Equation Modeling (Third ed.). New York: The Guilford Press.
Kumar, S. A., & Suresh, N. (2009). Operations Management. New Delhi: New Age International (P) Ltd Publishers.
Luke, B. (2009). Strategic Entrepreneurship in New Zealand’s State-owned Enterprises: Underlying Elements and Financial Implications. Auckland: Auckland University of Technology.
Lumpkin, G., & Dess, G. G. (1996). Clarifying the Entrepreneurial Orientation Construct and Linking it to Performance. Academy of Management Review, 21(1), 135-172. doi:10.2307/258632
Mahmood, R., & Hanafi, N. (2013). Entrepreneurial Orientation and Business Performance of Women-Owned Small and Medium Enterprises in Malaysia: Competitive Advantage as a Mediator. International Journal of Business and Social Sciences, 4(1), 82-90.
Mburia, B. W., Wanjau, K., & Kinyanjui, J. K. (2016). Moderating Role of Entrepreneurial Orientation on the Relationship between Benchmarking and Performance of Food Processing Firms in Kenya. Asian Academic Research Journal, 3(9), 60-77.
Miller, D. (1983). The Correlates of Entrepreneurship in Three Types of Firms. Management Science, 29(7), 770-791. doi:10.1287/mnsc.29.7.770
Mokamba, J. A., Gakure, R. W., & Keraro, V. N. (2013). Influence of Quality Management Systems in the Performance of Small and Medium Sized Enterprises in Nairobi: A Critical Literature Review. Prime Journal of Business Administration and Management, Vol. 3(6), 1033-1042.
Penrose, E. T. (1959). The Theory of the Growth of the Firm. New York: Wiley. doi:10.1093/0198289774.001.0001
Peteraf, M., & Barney, J. (2003). Unraveling The Resource-Based Tangle. Managerial and Decision Economics, Vol. 24, 309-323. doi:10.1002/mde.1126
Ringle, C. M., Wende, S., & Becker, J.-M. (2015). SmartPLS . Retrieved March 24th, 2017, from "SmartPLS 3." Boenningstedt: SmartPLS GmbH: http://www.smartpls.com
Sánchez, J. (2012). The Influence of Entrepreneurial Competencies on Small Firm Performance. Revista Latinoamericana de Psicología, Volumen 44(No 2), 165-177.
Santos, J. B., & Brito, L. A. (2012). Toward a Subjective Measurement Model for Firm Performance. Brazilian administration Review, 9(Special Issue Art. 6), 95-117. doi:10.1590/S1807-76922012000500007 Swezey, D., & McConaghy, R. (2011). Manufacturing Growth: Advanced Manufacturing and the Future of
the American Economy. New York: The Schwartz Initiative on American Economic Policy. Retrieved July Thursday 30th, 2015, from www.ThirdWay.org.
Tabachnick, B. G., & Fidell, L. S. (2007). Using Multivariate Statistics. Boston: Pearson Education, Inc. Venkatraman, N., & Ramanujam, V. (1986). Measurement of Business Performance in Strategy Research:A
Comparison of Approaches. Academy of Manogrement Review, Vol. 11(No 4), 801-814. doi:10.2307/258398
Wernerfelt, B. (1984). A Resource-Based View of the Firm. Strategic Management Journal, Vol. 5(No. 2), 171-180. doi:0.1002/smj.4250050207
Zehir, C., Gurol, Y., Karaboga, T., & Kole, M. (2016, October). Strategic Human Resource Management and Firm Performance: The Mediating Role of Entrepreneurial Orientation. Procedia - Social and Behavioral Sciences, 235, 372 – 381. doi:10.1016/j.sbspro.2016.11.045
Zhao, X., Lynch, J. G., & Chen, Q. (2010, August). Reconsidering Baron and Kenny: Myths and Truths about Mediation Anallysis. (G. Fitzsimons, Ed.) Journal of Consumer Research, Vol 37, 197-206. doi:10.1086/651257