H a r r y L e i n o n e n ( e d . )
Simulation studies of liquidity
needs, risks and efficiency in
payment networks
P ro c e e d i n g s f ro m t h e B a n k of Fi n l a n d Pay m e n t a n d S e t t l e m e n t Sy s t e m S e m i n a rs 2 0 0 5 – 2 0 0 6 S c i e n t i f i c m o n o g r a p h s Sim ulation studies o f liquidity needs, risks and efficienc
y in pa
yment networks
H a r r y L e i n o n e n ( e d . )
Simulation studies of liquidity
needs, risks and efficiency in
payment networks
P ro c e e d i n g s f ro m t h e B a n k of Fi n l a n d Pay m e n t a n d S e t t l e m e n t Sy s t e m S e m i n a rs 2 0 0 5 – 2 0 0 6
The views expressed in this study are those of the authors and do not necessarily reflect the views of the Bank of Finland. ISBN 978-952-462-360-5 ISSN 1238-1691 (print) ISBN 978-952-462-361-2 ISSN 1456-5951 (online)
Abstract
This publication consists of nine separate studies on payment and settlement systems conducted using simulation techniques. Most have been carried out using the payment and settlement system simulator BoF-PSS2 provided by the Bank of Finland. The preliminary versions were presented at the annual simulator seminars arranged by the Bank in 2005 and 2006. The main focus of the analyses is on liquidity requirements, settlement speed, gridlock situations, gridlock resolution methods, liquidity economising, systemic risk and the impact of shocks on system performance as well as network analysis and modelling of payment systems. The studies look at systems in several countries and cover both RTGS and netting systems as well as securities settlement systems.
Keywords: simulation, payment and settlement system, payment networks, liquidity, gridlock, systemic risk, counterparty risk
Tiivistelmä
Tämä julkaisu koostuu yhdeksästä erillisestä maksu- ja selvitysjärjes-telmiä koskevasta tutkimuksesta, jotka on suoritettu simulointimene-telmillä. Useimmat näistä tutkimuksista on tehty käyttäen Suomen Pankin maksu- ja selvitysjärjestelmäsimulaattoria BoF-PSS2. Alusta-vat versiot tutkimuksista on esitelty Suomen Pankin järjestämien vuo-sittaisten simulaattoriseminaarien yhteydessä vuosina 2005 tai 2006. Pääpaino tutkimuksissa on ollut likviditeettitarpeiden selvittämisessä, katteensiirron nopeudessa, lukkiutumistilanteissa ja niiden avaamiseen liittyvissä metodeissa, likviditeetin käytön tehostamisessa, systeemi-riskeissä sekä poikkeustilanne- ja vastapuolisysteemi-riskeissä ja tämän lisäksi maksujärjestelmäverkkojen analyyseissa ja mallinnuksissa. Tutkimuk-set koskevat eri maissa toimivia järjestelmiä, ja niiden joukossa on RTGS-järjestelmiä ja nettoutusperiaatteella toimivia maksujärjestel-miä sekä arvopaperikauppojen selvitysjärjestelmaksujärjestel-miä.
Asiasanat: simulointi, maksu- ja selvitysjärjestelmä, maksuliikeverkot, likviditeetti, lukkiutumistilanne, systeemiriski, vastapuoliriski
Preface
Payment and settlement systems are an integral part of modern economies. With continuous progress in globalisation and rapid technological advances, payment systems are in a state of transition, and dependencies due to technology and integration are increasing continuously. There are new demands on real-time liquidity and risk management. Banks and authorities will face new types continuity requirements in a complex network of business relationships. It is important to gain a good understanding of the systems and their interdependencies in order to increase their efficiency under normal circumstances and their resilience in any abnormal situations that could arise.
Payment and settlement systems are a complicated area into which simulation techniques provide a good way to penetrate sufficiently deeply. Models can be built which closely replicate the real operating environment, and these models can be used for testing and observing scenarios not normally found in real operating environments.
The Bank of Finland has a long tradition of economic research and economic modelling, and modern payment and settlement systems have been one of the focal areas. Research using simulation models for payment systems was initiated around the time Finland joined the Economic and Monetary Union as it proved to be an excellent tool for studying changing liquidity needs and system risks under the new EMU regime. Based on positive results and feedback, the Bank of Finland decided to develop a diversified simulator designed especially for external use and international distribution, called BoF-PSS2. It was completed in spring 2004 and is available for research purposes free of charge. This service is under continuous development, with the latest additions made this year being a network analysis module and a stochastic input generator. Currently the simulator has over 60 users worldwide and on every continent. The users are mainly central banks but interest in the simulator has increased among academics and private infrastructure organisations during recent years.
Investment in the simulator and the service it offers attracted great international interest and generated a variety of research and studies by different central banks. The Bank of Finland arranged four annual international payment and settlement seminars and workshops from 2003 to 2006, and the fifth seminar is scheduled for later in 2007. The main goals of the seminars and workshops are to stimulate simulation-based payments and securities settlement research, share research results and experiences among members of the user community and
receive ideas and feedback on simulator development needs. The presentations of the first two seminars were published in the first simulator publication (BoF publication E31:2005) and the presentations from the third and fourth seminar are included in this publication.
I would like to thank all the authors for their contributions to this publication, which I trust will provide a good introduction to the simulation analysis of payment and settlement systems and stimulate further research to enhance our understanding and improve the models and methodologies in the years ahead.
I would like to thank all other contributors, sponsors, commentators and users of the simulator for all the help they have provided during different periods of work on and with the simulator. The simulator has recently been enhanced with payment network analysis features, for which I would like to thank the National Infrastructure Simulation and Analysis Center (NISAC, a programme of the US Department of Homeland Security’s Infrastructure Protection/Risk Management Division comprised of a core partnership of Sandia National Laboratories and Los Alamos National Laboratory) for providing parts of Loki for use by the BoF-PSS2. Loki is a collaborative software project containing core functionalities for the creation and analysis of networks and for the development of a wide array of application-specific agent-based models. I would like to especially thank Walter E Beyeler and Robert J Glass at Sandia National Laboratories and Kimmo Soramäki from Helsinki University of Technology for their help on integrating Loki functionalities with those of BoF-PSS2.
At the same time I want to extend an acknowledgement to Ville Ruoppi at MSG Software for continuous involvement in the IT developments of the simulator. A detailed list of acknowledgements can be found on the simulator website and in the user manual.
For the finalisation of the publication we are indebted to Päivi Nietosvaara for text editing and Teresa Magi for printing administration. We are also indebted to the editorial board of the publication, which consists of Ari Hyytinen, Harry Leinonen and Jouko Vilmunen.
I hope users of the simulator will continue to be active and that the simulator will attract new users and sponsors. It is a great pleasure for me to present, via this second simulation-related publication, the fruits of this continuing productive cooperation between central banks. Helsinki, May 2007
Contents
Chapter 1 Harry Leinonen
Introduction ...9 Chapter 2
Kimmo Soramäki – Walter Beyeler – Morten Bech – Rober Glass New approaches for payment system simulation research ...15 Chapter 3
Fabien Renault – Jean-Baptiste Pecceu From PNS to TARGET2: the cost of FIFO
in RTGS payment system ...41 Chapter 4
Neville M Arjani
Examining the tradeoff between settlement delay and intraday liquidity in Canada’s LVTS:
a simulation approach...87 Chapter 5
Kei Imakubo – James J McAndrews
Funding levels for the new accounts in the BOJ-NET...123 Chapter 6
Ana Lasaosa – Merxe Tudela
Risks and efficiency gains of a tiered structure
in large-value payments: a simulation approach ...149 Chapter 7
Stefan W Schmitz – Claus Puhr
Risk concentration, network structure and contagion
in the Austrian Real Time Interbank Settlement System ...183 Chapter 8
Elisabeth Ledrut
How can banks control their exposure to a failing
Chapter 9 Darcey McVanel
The impact of unanticipated defaults in Canada’s Large
Value Transfer System...253 Chapter 10
Matti Hellqvist – Heli Snellman
Chapter 1
Introduction
Harry Leinonen
1 Introduction
The last decade have seen a growing interest among central banks in deepening the analysis made in oversight assessments. Different kinds of stress-testing scenarios and tools have emerged in order to study concretely ‘what if’-type failure and crisis situations. Among the factors behind the growing interest in this area are international cooperation and globalisation in general, technological advances and a growing dependency on payment systems and their important relationships to each other. Payment systems have become large networks or popularly ‘webs’ of relationships. Network analysis has therefore become a growing type of payment research. We seem to be on the verge of a new era of truly global payment and settlement systems operated completely through network-based interfaces and connections. The key official and international bodies for oversight and supervisory cooperation – the payment system committee of G10 central banks (CPSS), the Payment and Settlement System Committee of the Eurosystem (PSSC) and the committees and other groups of the European Commission – will need to increase and deepen their cooperation in order to fulfil the task of overseeing and supervising the web of international payment systems.
Payment system simulations started to attract interest in the 1990s and were to a large extent used to discover how new settlement conventions would affect the participants and the overall system and to find out the hidden credit and liquidity risks, especially in cross-border systems. These studies viewed the payment systems mostly as static machineries for booking transactions. Currently there is an emphasis on trying to better understand the network design of payment systems and the impact of the behaviour of individual participants or a group of participants. Customers and banks are particularly likely to react to external stimuli and change their payment behaviour in crisis situations. Agent-based simulation models are one way to try to catch the behavioural patterns in the payment infrastructure. More research is clearly needed in order to find out more about agent reactions in changing circumstances.
The Bank of Finland has hosted annual simulator seminars since 2003. This is the second publication of studies presented at these seminars and mainly consists of the outcome of seminars held in 2005 and 2006. It is interesting to view development over the years and see how analysis is becoming deeper and more profound step by step. Counterparty risks and dependencies in payment systems are of continuous concern to central banks and stress-testing systems are
becoming a common tool for overseers. Algorithms for real-time settlement efficiency have improved over the years and become standardised features of RTGS systems. Network analysis is a new expanded area, which tries to describe the network structure of payment systems, for example the strong and weak dependencies in the system. The aim is at some point to be able to describe the behavioural patterns in payment networks.
The articles of this publication cover four main topics or views of payment and settlement systems as depicted in Figure 1.1.
Figure 1.1 The main topics of the articles
Network relationships Settlement efficiency Liquidity Needs Counterparty dependencies 2. Soramäki & al
3. Renault & Peccu 4. Arjani
5. Imakubo & McAndrews
6. Lasaosa & Tudela 7. Schmitz & Puhr
8. Ledrut 9. McVanel 10. Hellqvist & Snellman Network relationships Settlement efficiency Liquidity Needs Counterparty dependencies 2. Soramäki & al
3. Renault & Peccu 4. Arjani
5. Imakubo & McAndrews
6. Lasaosa & Tudela 7. Schmitz & Puhr
8. Ledrut 9. McVanel 10. Hellqvist &
Snellman
This publication starts with chapters on network analysis of payment systems, continues with articles about liquidity issues and ends with a smooth gradual transition to risk issues and different kinds of failure scenario in particular. Each chapter provides an individual stand-alone analysis, but some clearly build on earlier analyses. Each chapter is contributed by named authors.
Chapter 2 (Soramäki, Beyeler, Bech and Glass) presents new directions for simulation research in interbank payment systems that integrates network topology, network dynamics and agent-based modelling of bank behaviour. In the process it also reviews literature in the field and presents applications of the ideas presented. While the focus of the article is on systemic risk in interbank payment systems, the concepts and models presented are applicable for addressing questions related to other payment systems and topics such as liquidity flow efficiency as well.
Chapter 3 (Renault and Pecceu) studies the effects of queuing rules and optimisation algorithms for queued payments and especially FIFO (first-in first-out) rules compared to other processing orders. The authors aim to quantify to what extent non-FIFO optimisation algorithms can be more efficient than FIFO algorithms based on the algorithms used in the French large-value payment system PNS and in the planned TARGET2 system. Finally, the impact of the different optimisation algorithms is also investigated by simulating the complete PNS system using real data. In the context of a liquidity crisis created by a technical default of the largest participant of the system, the use of some non-FIFO algorithms is shown to reduce the number of rejected payments at the end of the day.
Chapter 4 (Arjani) explores a fundamental trade-off that occurs between settlement delay and intraday liquidity in the daily operation of large-value payment systems (LVPS), with specific application to Canada’s Large Value Transfer System (LVTS). Intraday liquidity and settlement delay can be costly for LVPS participants, and improvements in the trade-off are desirable. The analysis shows that increased use of the LVTS central queue (which contains a complex queue-release algorithm) reduces settlement delay associated with each level of intraday liquidity considered, relative to a standard queuing arrangement.
Chapter 5 (Imakubo and McAndrews) describes the changes in liquidity characteristics due to the implementation of the next-generation RTGS of the BOJ-NET Funds Transfer System in Japan. Under the project, the new system will have liquidity-saving features and will incorporate large-value payments that are currently handled by two private-sector designated-time net settlement systems, the Foreign Exchange Yen Clearing System and the Zengin System. The authors analyse the characteristics of optimal funding levels under the new features using simulation analysis and find that optimal funding levels can be described with the total balances in the system, the distribution of the total balances across participants, and the timing of funding.
Chapter 6 (Lasaosa and Tudela) quantifies the tiering effects within the UK large-value payment system (CHAPS) by analysing node, credit and liquidity risks for different tiering scenarios. The results show that node risk would rise substantially in what is already a highly concentrated system. As for credit risk, the size of intraday exposures compared with settlement banks’ capital is very small and therefore the likelihood of contagion is remote. The increase in credit risk brought to the system by settlement banks leaving CHAPS bears little relationship to the values settled by each individual bank.
Increasing the degree of tiering in CHAPS would lead to substantial liquidity savings within CHAPS.
Chapter 7 (Schmitz and Puhr) presents a statistical analysis of liquidity, risk concentration and network structure in the Austrian Real Time Interbank Settlement system and quantifies the contagion effect of an operational incident at one of participants’ sites on other participants. The main results are that in general the value and number of payments received and submitted were quite concentrated among the top three banks and that the contagion effect in the payment system was substantial.
Chapter 8 (Ledrut) assesses the effect of counterparties’ reaction to an operational failure at one of the biggest participants in the Dutch interbank payment system in which counterparties react according to two basic rules: they stop sending payments to the stricken bank either after some pre-determined time or after their exposure to the stricken bank reaches a certain level. Based on historic liquidity levels and payment flows, reacting seems to be more cost-effective when determined by the individual exposure of the stricken banks’ counterparties than when triggered by the elapsed time after the disruption, but also depends on the degree of reciprocity among participants.
Chapter 9 (McVanel) provides an empirical analysis of participants’ robustness to defaults in Canada’s Large Value Transfer system (LVTS) by creating unanticipated defaults in LVTS. According to the findings all participants are able to withstand their loss allocations in all cases of large defaults created using actual LVTS data.
Chapter 10 (Hellqvist and Snellman) presents stress-testing results from HEXClear, the Finnish securities settlement system for equities, for four different scenarios: failure of the entire settlement process, failure of individual participants, failure of certain ICT connections and failure of the most common settlement algorithms. According to the results the current settlement system is a robust construction. These research projects and studies have resulted in a deeper knowledge of payment systems and of the internal and external factors and parameters that affect them. The articles also show the learning curve brought about by international research cooperation which has helped the design of more efficient and stable operational systems. The new features tested via simulations have been implemented in several real-life systems. The Bank of Finland is grateful for the rewarding cooperation behind this kind of publication.
The Bank of Finland intends to continue with its successful research service in the form of simulator software development and
support, arranging simulator seminars and stimulating simulation-based payment systems research and publications. A payment system is a network of cooperating participants and payment systems are currently forming links between each other, resulting in a multilayered network structure. Network analysis techniques will probably also become interesting new research topics and we hope that the new network analysis module in the simulator will stimulate research in this area. An interesting research topic is the use of behavioural and adaptive input models, such as agent-based models, which can be used to study behavioural and adaptive responses among agents in a payment systems. We hope to be able to develop the simulator in this area for the next larger update. There seems to be a growing interest in simulating securities settlement systems, and this is an important research area as the risks are less studied and known than those of basic payment systems. One interesting possibility would also be to expand the system participants/agents to include end-users such as companies and consumers. This would provide a possibility to simulate payment flows in the economy and study the effects of changing customer payment patterns on the banking sector and perhaps even the intriguing relationships between payment flows and monetary value. We hope that this publication will inspire new studies in this multidimensional business area.
Chapter 2
New approaches for payment system
simulation research
Kimmo Soramäki – Walter Beyeler – Morten Bech – Rober Glass
2 New approaches for payment system simulation research...16
Abstract ...16
2.1 Introduction...16
2.2 Modelling interbank payment flows...17
2.2.1 Network representation of payment systems...18
2.2.2 Fedwire as an example of a complex network...23
2.3 Modelling payment system dynamics ...24
2.3.1 Network dynamics ...24
2.3.2 Simple payment system model...26
2.4 Modelling bank behaviour...29
2.4.1 Decision-making, learning and adaptation ...29
2.4.2 Multi-agent model of bank behaviour ...30
2.5 Conclusion ...33
References ...35
The authors would like to thank Marco Galbiati (Bank of England) and Jeffrey Arnold (Federal Reserve Bank of New York) for comments and their input in the papers summarized in this article. Soramäki: Helsinki University of Technology, Finland. Corresponding author: www.soramaki.net Beyeler and Glass: Sandia National Laboratories, Albuquerque, NM, USA. Supported through the National Infrastructure Simulation and Analysis Center (NISAC), a program of the Department of Homeland Security's Infrastructure Protection/Risk Management Division and comprised of a core partnership of Sandia National Laboratories Los Alamos National Laboratory. Sandia is a multiprogram laboratory operated by Sandia Corporation, a Lockheed Martin Company for the United States Department of Energy’s National Nuclear Security Administration under contract DE-AC04-94AL85000.
Bech: Federal Reserve Bank of New York, New York, NY, USA. The views expressed in this paper are those of the authors and do not necessarily reflect the position of the Federal Reserve Bank of New York or the Federal Reserve System.
2 New approaches for payment
system simulation research
Abstract
This article presents new directions for simulation research in interbank payment systems that integrates network topology, network dynamics and agent-based modelling of bank behaviour. In the process it also reviews literature in the field and presents applications of the ideas presented. While the focus of the article is on systemic risk in interbank payment systems, the concepts and models presented are applicable to address questions related to other payment systems and topics such as liquidity flow efficiency as well.
2.1 Introduction
At the apex of the financial system is a network of interrelated financial markets by which domestic and international financial institutions allocate capital and manage their exposure to risk. Critical to the smooth functioning of these markets are a number of financial infrastructures that facilitate clearing and settlement. The events of 11 September 2001 underscored both the resiliency and the vulnerabilities of these financial infrastructures to wide-scale disruptions. Any interruption in the normal operations of these infrastructures may seriously impact not only the financial system but also the economy as a whole.
A growing body of policy-oriented research is available. One segment of the literature focuses on simulating the default of a major participant and evaluating the effects on other institutions in payments1 and securities settlement systems2. Another segment presents detailed case studies on the responses of the US financial system to shocks such as the 1987 stock market crash and the attacks of 11 September 2001.3 Much of the research has been conducted
1 See Humphrey (1986), Angelini et al (1996), Kuussaari (1996), Bech et al (2002), Northcott (2002), Bech and Soramäki (2005), Bedford et al (2005) and Mazars and Woelfel (2005).
2 See Hellqvist and Koskinen (2005) and Devriese and Mitchell (2006). 3 See Bernanke (1990), McAndrews and Potter (2002) and Lacker (2004).
using data from real operating environments with the given payment flows and settlement rules of the respective systems. As such they are useful for assessing the operation of the particular system under disruptions, but the results are difficult to generalise to systems with other characteristics. Little research has focused on explaining the relationship between the characteristics of the system and its performance during and following disruptions. Also the behaviour of participants has been generally exogenously defined or assumed unchanged (or to change in a predetermined manner) when the policy parameters of the system change or when a bank changes its settlement behaviour as a consequence of operational or financial problems. Such assumptions are unlikely to hold in the case of real disruptions.
This article argues that three aspects are important for answering the still unanswered questions on what makes a payment system and its participants robust or fragile towards disruptions, and what are the most efficient measures to reduce the likelihood and magnitude of disturbances. First, understanding the pattern of liquidity flows among the system participants. Second, understanding how the rules of the system affect the dynamics of liquidity flows. Third, the ability to evaluate likely behavioural changes of the participants before, during and following disruptions or as a consequence of policy changes. This article presents new approaches at answering the above questions. It is organised as follows. Section 2.2 discusses how payment system interactions can be described by means of network topology and presents empirical results for the US Fedwire system. Section 2.3 describes dynamics that can take place in interbank payment systems and presents a simple model of a payment system based on simple rules of settlement. Section 2.4 presents some possible directions for modelling participant behaviour in payment systems. Section 2.5 concludes.
2.2 Modelling interbank payment flows
A payment system can be treated as a specific example of a complex network (see eg Newman, 2003). In recent years, the physics community has made significant progress towards understanding the structure and functioning of complex networks. The literature has focused on characterising the structure of networked systems and how the properties of the observed topologies relate to stability, resiliency and efficiency in case of perturbations and disturbances.
From a technical perspective, most payment systems are star networks where all participants are linked to a central hub (the operator) via a proprietary telecommunications network. From a payment processing perspective, payment systems are generally complete networks as all nodes (participants) are linked in the sense that they can send and receive payments from each other. However, these representations do not necessarily reflect the actual behaviour of participants that controls the flow of liquidity in the system and thus the channels for contagious transmission of financial disturbances. In common with other of social networks mediated by technology (such as email or telephone calling), the networks formed by actual participant behaviour are of more interest than the network structure of the underlying communication system.
2.2.1
Network representation of payment systems
Networks have been modelled in several disciplines such as in mathematics and computer science under graph theory, in applied mathematics and physics under network theory and in sociology under social network analysis. While the terminologies and research questions in the different traditions vary, common to all is the representation of the topic under study as (at minimum) two types of elements: nodes and connections between them, ie links. The following paragraphs summarise the main concepts.
Links can be either undirected or directed. Links can have weights attached to them representing the importance of the relationship between nodes. The strength of a node can be calculated as the sum of the weights of all the links attached to it. For a directed network, strength can be defined over both the incoming and outgoing links. A link from a node to itself is called a loop. The neighbours of a node are all the nodes to which it has a link. The predecessors of a node are the nodes that have a link to the node and the successors are the nodes that have a link from the node. A walk is a sequence of nodes in which each node is linked to the next. A walk is a path if all its nodes are distinct. The length of a path is measured by the number of links. If the start node and the end node of a path are one and the same, then it forms a cycle.
A complete network is a network where all nodes have a link to each other. A tree is a network in which any two nodes are connected by exactly one path. A connected network is a network where any two nodes can be joined by a path while a disconnected network is made
up of two or more connected components or sub-networks. These concepts are illustrated in Figure 2.1a.
Figure 2.1 Network modelling a) successor of node 1 predecessor of node 3 Loop reciprocal link complete network tree network reciprocal link b) DCs GIN tendrils GSCC GOUT tendrils GWCC
The most basic properties of a network are the number of nodes n and the number of links m. The number of nodes defines the size of a network while the number of links relative to the number of possible links defines the connectivity of a network. The degree of the network is the average number of links for each node in the network.
A starting point for the quantitative analysis of a network is to partition the set of nodes into components according to how they connect with other nodes. Dorogovtsev et al (2001) divide a network into a single giant weakly connected component (GWCC) and a set of disconnected components (DCs). The GWCC is the largest component of the network in which all nodes connect to each other via undirected paths. The DCs are smaller components for which the same is true. The GWCC consists of a giant strongly connected component (GSCC), a giant out-component (GOUT), a giant in-component (GIN) and tendrils. The GSCC comprises all nodes that can reach each other through a directed path. A node is in the GOUT if it has a path from the GSCC but not to the GSCC. In contrast, a node is in GIN if it has a path to the GSCC but not from it. Tendrils are nodes that have no directed path to or from the GSCC. They have a path to the GOUT or a path from the GIN (see Figure 2.1b).
Application of the component analyses to liquidity flows between banks provides insights on the structure of these flows within the payment system and gives clues with respect to the relative importance and vulnerability of banks in the system in case of disruptions. As banks in GOUT only receive funds from other banks in the GSCC, a disruption by a bank in GOUT would only affect other banks in that component. Banks in GIN are affected only by disruptions in the same component, and not by banks in other components as their payment processing is not dependent on incoming liquidity from these banks. Banks outside the GSCC tend to be smaller whereas all money center banks belong to the GSCC.
Two important characteristics of a node in a directed network are the number of links that originate from the node and the number of links that terminate at the node. These two quantities are referred to as the out-degree and in-degree of a node respectively. The average degree of a node in a network is the number of links divided by the number of nodes, ie <k>=m/n. Networks are often categorised by their degree distributions. The degree distribution of a classical random network (ER-network, Erdõs and Rényi, 1959) is a Poisson distribution. Many real networks have fat-tailed degree distributions and a large number have been found to follow the power law
P(ki = x)∼k-y for large-degree nodes. Networks with a power-law
distribution are sometimes referred to as scale-free networks4.
Scale-free networks have been found to remain better connected when subjected to random failures than other types of networks. Albert et al (1999) and Crucitti et al (2004) find that the connectedness of scale-free networks is robust to random failures but vulnerable to targeted attacks. However, one must be a bit careful here as the process acting on the network influences such analyses of robustness and vulnerability.
Simply put, banks that have a low in-degree and high weights for these links are likely to be more vulnerable to disturbances than other banks as the removal of one link will severely limit the amount of incoming funds. Conversely, banks with high out-degree have ceteris paribus the potential to affect more counterparties if their payment processing is disrupted. Understanding the topology of payment flows is likely to be important in assessing the resiliency of a payment system to wide-scale disruptions.
It is also common to analyse distances between nodes in the network. The distance from node i to node j is the length of the shortest path between the two nodes. The average distance from a node to any other node in a strongly connected network is commonly referred to as the average path length of a node. If the network is not strongly connected, paths between all nodes may not exist. In a payment network the path length may be important due to the fact that the shorter the distances between banks in the network, the easier liquidity can re-circulate among the banks. On the other hand, a payment system where liquidity flows over short paths is also likely to be more vulnerable to disruptions in these flows.
Sociologists have long studied clustering in social networks, ie the probability that two nodes which are the neighbours of the same node themselves share a link. This is equivalent to the observation that two people, each of whom is your friend, are likely to be friends with each other. One way of measuring the tendency to cluster is the ratio of the actual number of links between the neighbours of a node over the number of potential links among them. A tree network has a clustering coefficient of zero, and a complete network a coefficient of one. In a classical random network, the clustering coefficient is the unconditional probability of connection, ie <C> = p.
4 This is because the power law distribution is the only scale-free distribution, ie if the scale by which x is measured is increased by a factor, the shape of the distribution p(x) is unchanged, except for an overall multiplicative constant (see Newman, 2005).
In a payment network, the clustering coefficient measures the prevalence of payments between a bank’s counterparties. In terms of resilience one could hypothesise that disturbances in banks with a higher clustering coefficient might have a compounding impact on their counterparties, as some of the disturbance may be passed on by the bank’s neighbours to each other – in addition to the direct contagion from the source of the disruption.
There are various measures of the centrality that indicate the relative importance of nodes in a network. Four measures of centrality are commonly used in network analysis: degree, closeness, betweenness, and eigenvector centrality. The first three were described in their current form by Freeman (1979) while the last was proposed by Bonacich (1972). Degree centrality takes into account only the immediate neighbourhood of the node, ie it is simply the number of links the node has. Closeness centrality as defined by Freeman is the sum of shortest paths from all other nodes. Betweenness centrality may be defined loosely as the number of times that a node is on the shortest path between any pair of nodes. Eigenvector centrality encapsulates the idea that the centrality of a node depends also on the centrality of the nodes that it is linked by (or links to). A famous commercialisation of this centrality measure is the PageRank algorithm by Google (Brin and Page, 1995). In general, the importance of the node will depend on process taking place in the network. Borgatti (2005) provides a good overview of alternative processes in networks and centrality measures applicable for their analysis.
Finally, a key question in the study of networks is how the topologies that are seen in reality have come into being. There are two classes of network formation models some times referred to as equilibrium and non-equilibrium models (Dorogovtsev and Mendes, 2003). Equilibrium models have a fixed set of nodes with randomly chosen pairs of nodes connected by links. Erdõs and Rényi (1959) develop a basic model of a n node network, with each pair of nodes connected by a link with probability p. This type of network is commonly referred to as a classical random network. Non-equilibrium network models grow a network by successively adding nodes and setting probabilities for links forming between the new nodes and existing nodes and between already existing nodes. Many of these models, notably the Barabasi and Albert (1999) model (BA model), are based on preferential attachment. Preferential attachment assigns a probability of a link forming with a node that is increasing with the number of prior links of the node.
2.2.2
Fedwire as an example of a complex network
Soramäki et al (2007) analyse the topology of daily networks formed by the payment flows between commercial banks over Fedwire for a period of 62 consecutive business days. Apart from a few holidays, the statistics characterising the network were quite similar from day to day. These networks shared many characteristics with other empirical complex networks, such as a scale-free degree distribution, high clustering coefficient and the small world phenomenon (short path lengths in spite of low connectivity). Like many other technological networks, high-degree nodes tend to connect to low-degree nodes. Similar conclusions can also be reached from analysis on BoJ-NET by Inaoka et al (2005).
Moreover, Soramäki et al (2007) report that the topology of the network was significantly altered by the attacks of 11 September 2001. The number of nodes and links in the network and its connectivity was reduced, while the average path length between nodes was significantly increased. Interestingly, these alterations were of both similar magnitude and direction to those that occurred on several of the holidays contained within the period.
Figure 2.2a shows liquidity flows in Fedwire as a visual graph. The figure includes over 6,600 nodes and more than 70,000 links. Each link between two banks is shaded by the value of payments exchanged between them, with darker shades indicating higher values. Despite the appearance of a giant fur ball, the graph suggests the existence of a small group of banks connected by high value links. To gain a clearer picture of this group, a subset of the network where the focus is on high value links is displayed in Figure 2.2b. This graph shows the largest undirected links that comprise 75% of the value transferred. The network consists of only 66 nodes and 181 links. The prominent feature is a densely connected sub-graph, or clique, of 25 nodes to which the remaining nodes connect. By itself it is almost a complete graph. A small number of banks and the links between them thus dominate the value of all payments sent over the network.
Figure 2.2 Visualisation of the liquidity flow network (Soramäki et al, 2007)
a) b)
The analysis finds that payment networks have characteristics similar to other social and technological networks. An unanswered question is why the network has the structure it does: the network may grow over time by a logic that is very general or that is particular to payment systems, or to specific policies of a given system. This is an interesting topic for future research. The network structure has also implications for its robustness. Robustness of the network, however, also depends on the processes taking place in it. This is the topic of the next sections.
2.3 Modelling payment system dynamics
2.3.1 Network
dynamics
A number of payment system simulations carried out in recent years have used actual or generated payment data. These simulations have studied the actual dynamics of payment systems, where system rules have varied from simple real-time gross settlement to complex hybrid settlement mechanisms with offsetting and multilateral settlement capabilities. The research can be summarised as trade-off questions between liquidity, speed of settlement and risks. The impact of bank behaviour has not been taken endogenously into account in these simulations. A summary of this line of research is provided in Leinonen (2005) and is not presented here.
From a network perspective, the performance of banks (nodes) is often dynamically dependent on the performance of other banks within the network and upon the structure of linkages between banks. A failure by one node in the network, for example, may hinder flows in the network and adversely impact the performance of the other nodes as the disturbance propagates in the network.
One branch of network literature has investigated the resilience of different network topologies in terms of a connectivity threshold (ie percolation threshold)5 at which a network dissolves into several
disconnected components. A well-known finding is that scale-free networks are more robust to random failures than other types of networks. However, they are very susceptible to the removal of the very few highly connected nodes. These static failure analyses may be applicable to some networks if the interest is the availability of paths between nodes in the network – but are less applicable to networks of monetary flows which contain both flows via the shortest paths as well as longer walks within the network.
Another branch of the literature has studied the impact of perturbations that cascade through the network on the basis of established theoretical or domain-specific rules6. In these dynamical models nodes generally have a capacity to operate at a certain load and, once the threshold is exceeded, some or all of the node’s load is distributed to neighbouring nodes in the network (Bak et al, 1987). While the detailed dynamics depend on the rules applied for the cascades, generally the most connected nodes (or nodes with highest load in relation to overall capacity) are more likely than average nodes to trigger cascades. Increased heterogeneity makes the system more robust to random failures, but more susceptible to targeted attacks that may cause global cascades.
Cascade models have been applied by physicists to systems within fields ranging from geology to biology to sociology (eg Jensen, 1998). This research has demonstrated that models made of very simple agents, interacting with neighbouring agents, can yield surprising insights about system-level behaviour. In the spirit of these cascade models, Beyeler et al (2007) formulate a simple agent-based model for liquidity flows within a payment system.
5 Eg Bollobas (1985), Moore and Newman (2000) and Callaway et al (2000).
6 Eg Watts (2002) and Crucitti et al (2004b) for random and complex networks, respectively, and Sachtjen et al (2000) and Kinney et al (2004) for power networks.
2.3.2
Simple payment system model
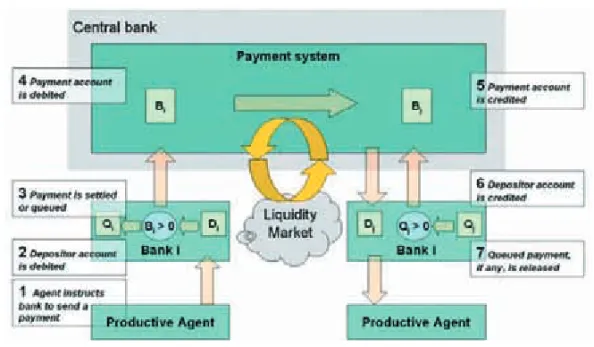
The model of Beyeler et al includes only the essential processes of a payment system and its accompanying liquidity market. A set of banks exchange payments through a single common payment system. All payments occur only along the links of a scale-free network – as was shown to be representative of Fedwire liquidity flows. Banks’ customers randomly instruct them to make a unit payment to a neighbouring connected bank. Banks are reflexively cooperative: they submit the payment if the balance in their payment system account allows; otherwise they place the instruction on a queue for later settlement.
If the receiving bank has instructions in its queue, the payment it just received enables it to remove a queued instruction and submit a payment in turn. If the bank that receives that payment is also queuing instructions, then it can make a payment, and so on. In this way a single initial payment made by a bank can cause many payments to be released from the queues of the downstream receiving banks. This is an example of the cascade processes typically studied in other models of self-organised criticality. Statistics on these settlement cascades are an indicator of the extent of interdependence of the banks, and in the model they are a controlled by two parameters: the overall liquidity and market conductance.
Figure 2.3 Simple payment system model (Beyeler et al, 2007)
In the absence of a liquidity market, only abundant liquidity allows banks to operate independently; reducing liquidity increases the likelihood that a given bank will exhaust its balance and begin queuing payments. A bank that has exhausted its balance must wait for an incoming payment from one of its neighbours. When liquidity is low a bank’s ability to process payments becomes coupled to its neighbours’ ability to process. The output of the payment system as a whole is no longer determined by overall input, but instead becomes dominated by the internal dynamics of the system. Figure 2.4a shows how the correlation between arriving instructions and submitted payments degrades in the model as liquidity is reduced (1: high liquidity; 2: medium liquidity; 3: low liquidity). A settlement cascade, that is the release of queued payments as a result of a single initiating payment, can comprise hundreds of queued payments as illustrated in Figure 2.4b.
To explore how liquidity markets reduce coupling among network neighbours and thereby reduce congestion, market transactions were represented as a diffusive process where a bank’s balance plays the role of a potential energy or pressure. Banks with high balances tend to contribute liquidity to the market, while banks with low balances tend to draw liquidity from the market. There is no decision-making or price-setting in this simple market model, but it reflects two essential features of a real market: liquidity flows from banks with surplus funds to banks that need funds, and liquidity can flow from any bank to any bank – flows are not confined to the links of the payment network. It creates a separate global pathway for liquidity flow. The ease of liquidity flow through the market is described by a single conductance parameter.
Figure 2.4 Instruction and Payment Correlation (a) and Settlement Cascade Length
Distribution (b). a) 0 2 4 6 8 10 12 14 5.4 5.5 5.6 5.7 5.8 5.9 6 6.1 6.2 arrived instructions (1,000') se tt le d p ayment s (1,000 ') b) 0.0001 0.001 0.01 0.1 1 1 10 100 1000 10000
Settlement Cascade Length, L
P(
x>
L
With a liquidity market included, the number of payments closely tracks the number of instructions as the coupling between banks is weakened and the size of the settlement cascades is reduced. The rate of liquidity flow through the market relative to the rate of flow through the payment system was surprisingly small. The performance of the system can be greatly improved even though less than 2% of the system through-put flows through the market.
2.4 Modelling bank behaviour
2.4.1 Decision-making,
learning and adaptation
Wide-scale disruptions may not only present operational challenges for participants in the interbank payment system, but they may also induce participants to change the way they conduct business. The actions of participants have the potential to either mitigate or exacerbate adverse effects. Hence, understanding how participants interact and react when faced with operational adversity will assist operators and regulators in designing countermeasures, devising policy, and providing emergency assistance, if necessary.
The first approach to study bank behaviour in payment systems has been to use standard game theory. Angelini (1998) and Kobayakawa (1997) use a setup derived from earlier literature on precautionary demand for reserves. Angelini (1998) shows that in a RTGS system, where banks are charged for intraday liquidity, payments will tend to be delayed and that the equilibrium outcome is not socially optimal. Kobayakawa (1997) models the intraday liquidity management process as a game of uncertainty, ie a game where nature moves after the players. Kobayakawa (1997) shows that both delaying and not delaying can be equilibrium outcomes when intraday overdrafts are priced. McAndrews and Rajan (2002) study the timing and funding of transfers in the Fedwire funds transfer system. They show that banks benefit from synchronising their payment pattern over the course of the business day because it reduces the overdrafts. Bech and Garratt (2003) develop a stylised two-period-two-player model with imperfect information. They analyse the strategic incentives under different intraday credit policy regimes employed by central banks and characterise how the Nash equilibria depend on the underlying cost parameters for liquidity and delays. It turns out that two classical paradigms in game theory emerge: the Prisoner’s Dilemma in the case where intraday credit is provided
against collateral and the Stag Hunt coordination game in the case where the central bank charges a fee. Hence, many policy issues can be understood in terms of well-known conflicts and dilemmas in economics.
Other approaches that have been applied to similar problems of repeated interaction among a large number of players are evolutionary game theory and reinforcement learning (such as Q-Learning by Watkins et al, 1992). Agents who learn about each others’ actions through repeated strategic interaction is a leading theme in evolutionary game theory. In most of the existing literature it is customary to look at the players’ asymptotic behaviour in situations where the payoffs are some known function of players’ strategies. In one strand of the literature, this knowledge is a prerogative of the players, who can therefore use adaptive rules of the type ‘choose a best reply to the current strategy profile’. In a second research line, the learning rules do not require knowledge of the payoff function on the part of the learners. Such rules are instead of the kind ‘adopt more frequently a strategy that has given a high payoff’.
Galbiati and Soramäki (2007) use methods from reinforcement learning (Barto and Sutton, 1998) and fictitious play (Brown, 1951) to numerically solve a model with interactions among a large number of banks that settle payments on a continuous basis under imperfect information, stochastic payoffs and a finite but long sequence of settlement days. The model is summarised and discussed in more detail below.
2.4.2
Multi-agent model of bank behaviour
Galbiati and Soramäki (2007) develop a dynamic multi-agent model of an interbank payment system where payments are settled on the basis of pre-committed funds. In the model banks choose their level of committed funds on the basis of private payoff maximisation.
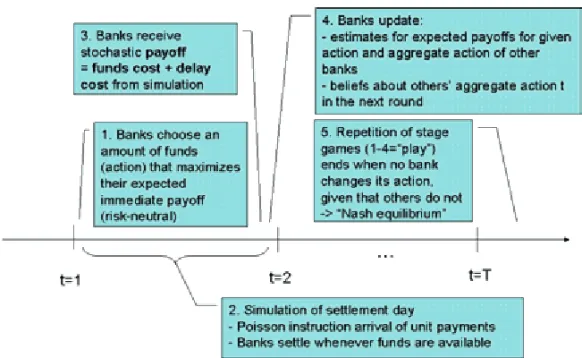
The model consists of a sequence of settlement days. Each of these days is a simultaneous-move game, in which each bank chooses the amount of liquidity to commit for payment processing and receives a stochastic payoff. Payoffs are determined by means of simulating the settlement day with the amounts of liquidity chosen by the banks. Instructions to be settled by the banks arrive on the basis of a Poisson process and are ex-ante unknown to the banks. As shown in Section 2.3.2, the relationship between instruction arrival and payment settlement is very complex and could not so far be described analytically. Adaptation takes place through reinforcement learning
with Bayesian updating, with banks maximising immediate payoffs. Figure 2.5 shows the sequence of decisions, events and learning in the model.
Figure 2.5 Overview of a multi-agent learning model of a payment system
(Galbiati and Soramäki, 2007)
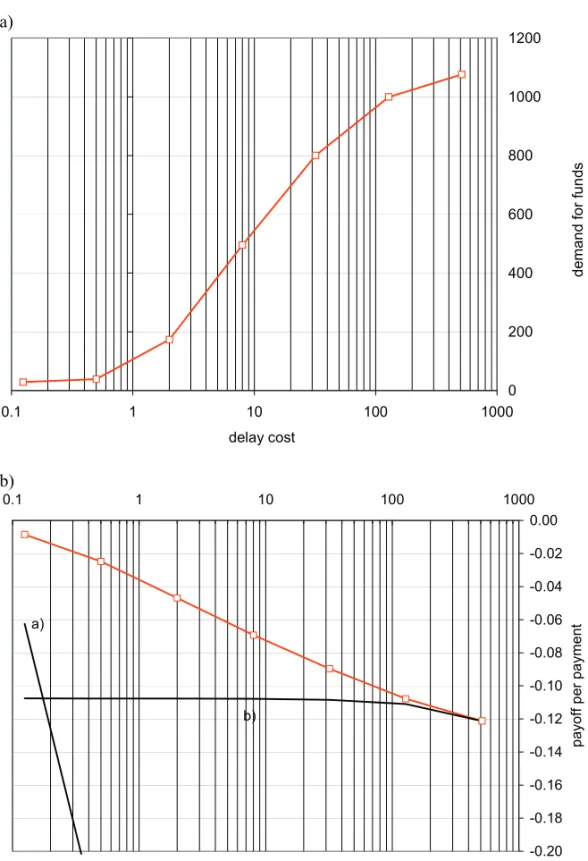
By the process of individual pay-off maximisation, banks adjust their demand for liquidity up (reducing delays) when delay costs increase and down (increasing delays), when they rise. It is well known that the demand for intraday credit is generated by a tradeoff between the costs associated with delaying payments and liquidity costs. Simulating the model for different parameter values, they find that the demand for intraday credit is an S-shaped function of the cost ratio between intraday credit costs and the costs associated with delaying payments7 (see Figure 2.6a).
Figure 2.6 Demand for intraday credit (a), Payoff comparison (b) a) 0 200 400 600 800 1000 1200 0.1 1 10 100 1000 delay cost de ma nd f o r fu n ds b) a) b) -0.20 -0.18 -0.16 -0.14 -0.12 -0.10 -0.08 -0.06 -0.04 -0.02 0.00 0.1 1 10 100 1000 funds committed pa yof f p er paymen t
An interesting question is how good the performance of the banks is in absolute terms. To understand this we compare the payoffs received by the banks through adaptation with two extreme strategies:
a) delay all payments to the end of the day;
b) commit enough liquidity to be able to process all payments promptly.
The performance of these three strategies is shown in Figure 2.6b. For any level of the delay cost, the adaptive banks obtain better payoffs than either of the two extreme strategies as they manage to learn a convenient trade-off between delay and liquidity costs. On the contrary, the strategy under a) becomes quickly very expensive as delay costs increase, and the strategy under b) is exceedingly expensive when delays are not costly.
Ideally, banks should be taking into consideration the future stream of pay-offs as well. This would create a value of information to the banks as discounting expected future payoffs would create an explicit trade-off between exploitation (the use of actions that appear optimal in the light of the available information) and exploration (the use of seemingly sub-optimal actions, which might appear such because of lack of experimentation). Banks may also be risk-averse, interested not only in the expected pay-off but also its variability. These are among the topics for future research.
2.5 Conclusion
This article presented three elements of payment systems, new approaches for understanding and analysing them, and examples on how these approaches can be applied to specific research questions. It argues that performance of a payment system is a function of network topology, the ‘physics’ of the system and the behaviour of banks – one factor alone is not enough to evaluate efficiency or robustness.
First, the payment system can be understood as a network of liquidity flows and can be modelled as a graph. Each model of a payment system assumes some topology, be it random, complete or a topology closer to the system being modelled - such as the scale-free topology of Fedwire. Graph theory and social network analysis provide good tools for analysing the structure of interbank payment systems and their liquidity flows. Understanding how banks are connected in the payment network is important for analysing their
robustness. The concepts developed in the field can help us structurally analyse payment flows in the system (see eg Newman, 2003). Measures of average path length can tell us how quickly disturbances are likely to reach other banks in the network. More research is clearly needed to identify measures that explain the connection between system topology and its robustness. Centrality measures can help us identify banks that are not only important through their size, but also due to their position in the network and due to their linkages to other banks (see eg Borgatti, 2005). A likely fruitful area in payment system research would be to use such approaches for the identification of important (and vulnerable) banks in networks representing RTGS or netting systems.
Second, payment systems have rules, procedures and technical constraints for the processing of individual payments that may produce emergent behaviour at the system level. An example of these is the settlement cascades that take place at low levels of liquidity and low market conductance. The model of payment system dynamics exhibits a transition from independent to highly interdependent behaviour and allows the study of factors that control system-wide interdependence. Complexity theory and models developed in statistical mechanics (see eg Bak, 1987, and Sachtjen et al, 2000) can help explain how simple local rules create emergent system-level behaviour.
Third, banks react to changes in the environment – be these changes in policy or disruptions to the system’s operation or changes in the behaviour of other banks. Understanding how banks might react, and the impact of simultaneous reactions at the system level, greatly helps in evaluating risks and efficiencies of payment systems. While the incentives of banks may be analysed individually in isolation or when operating in a stipulated environment, their interaction in a system of banks with their own incentives necessitates a model. In modelling bank behaviour, methodologies developed under reinforcement learning (Sutton and Barto, 1998) and learning in games (Fudenberg and Levine 1998) may prove useful. As seen by the given example, mere simple ‘intelligence’ by agents can produce realistic behaviour and add value to the analysis of payment systems. In the development of more realistic behaviour for banks in settling payments, an important unanswered question is whether and what kind of bank behaviour can be identified from empirical payment data.
References
Angelini, P (1998) An analysis of competitive externalities in gross settlement systems. Journal of Banking Finance 22, 1–18.
Angelini, P – Maresca, G – Russo, D (1996) Systemic risk in the netting system. Journal of Banking and Finance 20, 853–868. Albert, R – Jeong, H – Barabasi, A-L (1999) Error and attack
tolerance of complex networks. Nature 406, 378–382.
Bak, P – Tang, C – Wiesenfeld, K (1987) Self Organized Criticality: An explanation of 1/f Noise. Physical Review Letters 59:4, 381– 384.
Barabasi, A-L – Albert, R (1999) Emergence of scaling in random networks. Science 286, 509–512.
Barto, A G – Sutton, R S (1998) Reinforcement Learning: an introduction. MIT Press, Cambridge, Massachusetts.
Bech, M – Madsen, B – Natorp, L (2002) Systemic Risk in the Danish Interbank Netting System. Danmarks Nationalbank Working Paper No. 8.
Bech, M – Soramäki, K (2002) Liquidity, gridlocks and bank failures in large value payment systems. In E-money and Payment Systems Review. Central Banking Publications.
Bech, M – Soramäki, K (2005) Systemic risk in a netting system revisited. In Leinonen, H (ed.) Liquidity, risks and speed in payment and settlement systems – a simulation approach. Bank of Finland Studies E:31.
Bech, M – Garratt, R (2003) The intraday liquidity management game. Journal of Economic Theory, Vol. 109(2), 198–219.
Bech, M – Garratt, R (2006) Illiquidity in the Interbank Payment System following Wide-Scale Disruptions. Federal Reserve Bank of New York Staff Report 239.
Bedford, P – Millard, S – Yang, J (2005) Analysing the impact of operational incidents in large-value payment systems: a simulation approach. In Leinonen, H (ed.) Liquidity, risks and speed in payment and settlement systems – a simulation approach. Bank of Finland Studies E:31.
Bernanke, B (1990) Clearing and Settlement during the Crash. Review of Financial Studies, Vol. 3, Issue 1, 133–151.
Beyeler, W – Bech, M – Glass, R – Soramäki, K (2007) Congestion and Cascades in Payment Systems. Physica A. Forthcoming. Bollobas, B (1985) Random Graphs. Academic Press, London, 123–
136.
Bonacich, P (1972) Factoring and weighting approaches to status scores and clique identification. Journal of Mathematical Sociology 2, 113–120.
Borgatti, S P (2005) Centrality and network flow. Social Networks 27, 55–71.
Brin, S – Page, L (1998) The anatomy of a large-scale hypertextual Web search engine. Proceedings of the seventh international conference on World Wide Web 7, 107–117.
Brown, G W (1951) Iterative Solutions of Games by Fictitious Play. In Koopmans, T C (ed.) Activity Analysis of Production and Allocation. Wiley, New York.
Callaway, D – Newman, M – Strogatz, S – Watts, D (2000) Network robustness and fragility: Percolation on random graphs. Phys. Rev. Lett. 85, 5468–5471.
Crucitti, P – Latora, V – Marchiori, M – Rapisarda, A (2004a) Error and attack tolerance of complex networks. Physica A 340, 380– 394.
Crucitti, P – Latora, V – Marchiori, M (2004b) A model for cascading failures in complex networks. Phys. Rev. E 69, 045104.
Devriese, J – Mitchell, J (2006) Liquidity Risk in Securities Settlement. Journal of Banking and Finance, Vol. 30, Issue 6, 1807–1834.
Dorogovtsev, S N – Mendes, J F F – Samukhin, A N (2001) Giant strongly connected component of directed networks. Phys. Rev. E 64.
Dorogovtsev, S N – Mendes, J F F (2003) Evolution of Networks. Oxford University Press.
Erdõs, P – Rényi, A (1959) On random graphs. Publicationes Mathematicae 6, 290–297.
Freeman, L C (1978) Centrality in social networks: I. Conceptual clarification. Social Networks 1, 215–239.
Fudenberg, D – Levine, D K (1998) The Theory of Learning in Games. MIT Press. Cambridge, Massachusetts.
Galbiati, M – Soramäki, K (2007) A competitive multi-agent model of interbank payment systems. arXiv:0705.3050v1 [cs.MA]. Hellqvist, M – Koskinen, J (2005) Stress testing securities clearing
and settlement systems using simulations. In Leinonen, H (ed.) Liquidity, risks and speed in payment and settlement systems – a simulation approach. Bank of Finland Studies E:31.
Humphrey, D B (1986) Payments Finality and Risk of Settlement Failure. In Saunders, A and White, L J (eds) Technology and the Regulation of Financial Markets: Securities, Futures, and Banking. Heath: Lexington.
Inaoka, H – Ninomiya, T – Taniguchi, K – Shimizu, T – Takayasu, H (2004) Fractal Network derived from banking transaction – An analysis of network structures formed by financial institutions. Bank of Japan Working Papers No. 04-E-04.
Jensen, H J (1998) Self-Organized Criticality: Emergent Complex Behavior in Physical and Biological Systems. Cambridge University Press, ISBN 0-521-48371-9.
Kinney, R – Crucitti, P – Albert, R – Latora, V (2005) Modelling cascading failures in the North American power grid. Eur. Phys. J. B 46, 101–107.
Kobayakawa, S (1997) The comparative analysis of settlement systems. Centre for Economic Policy Research Discussion Paper No. 1667.
Kuussaari, H (1996) Systemic Risk in the Finnish Payment System: An Empirical Investigation. Bank of Finland Discussion Paper 3. Lacker, J M (2004) Payment system disruptions and the federal
reserve following September 11, 2001. Journal of Monetary Economics, Vol. 51, No. 5, 935–965.
Leinonen, H (ed) (2005) Liquidity, risks and speed in payment and settlement systems – a simulation approach. Bank of Finland Studies E:31.
Mazars, E – Woelfel, G (2005) Analysis, by simulation, of the impact of a technical default of a payment system participant. In Leinonen, H (ed.) Liquidity, risks and speed in payment and settlement systems – a simulation approach. Bank of Finland Studies E:31.
McAndrews, J – Potter, S M (2002) The Liquidity Effects of the Events of September 11, 2001. Federal Reserve Bank of New York Economic Policy Review, Vol. 8, No. 2, 59–79.
McAndrews, J – Rajan, S (2000) The timing and funding of Fedwire funds transfers. Federal Reserve Bank New York Econ. Pol. Rev. 6, 17–32.
Moore, C – Newman, M E J (2000) Exact solution of site and bond percolation on small-world networks. Physical Review E 62: 7059–7065.
Newman, M E J (2003) The Structure and Function of Complex Networks. SIAM Review, Vol. 45, No. 2, 167–256.
Newman, M E J (2005) Power laws, Pareto distributions and Zipf’s law. Contemporary Physics, Vol. 46, No 5, 323–351.
Northcott, C A (2002) Estimating Settlement Risk and the Potential Contagion in Canada’s Automated Clearing Settlement System. Working Paper 2002-41. Bank of Canada.
Sachtjen, M L – Carrerras, B A – Lynch, V E (2000) Disturbances in a power transmission system. Physical Review E, 61:5, 4877– 4882.
Soramäki, K – Bech, M L – Glass, R J – Beyeler, W E (2007) The Topology of Interbank Payment Flows. Physica A. Vol. 379, 317–333.
Watkins, C – Dayan, P (1992) Technical note: Q-learning. Machine Learning, 8(3/4), 279–292.
Watts, D J (2002) A simple model of global cascades on random networks. PNAS, April 30, 2002, Vol. 99, No. 9, 5766–5771.
Chapter 3
From PNS to TARGET2:
the cost of FIFO in
RTGS payment systems
Fabien Renault – Jean-Baptiste Pecceu 3 From PNS to TARGET2: the cost of FIFO
in RTGS payment systems ...43 Abstract ...43 3.1 Optimisation in RTGS...44
3.1.1 From net to hybrid systems ...44 3.1.2 Optimisation and the FIFO rule...45 3.1.3 Formalisation of the problem ...46 3.1.4 Non-FIFO features in PNS and TARGET2...47 3.1.5 Objectives of the paper...48 3.2 Bilateral optimisation ...49 3.2.1 Bilateral optimisation in PNS and TARGET2...49 3.2.2 The bilateral Greedy algorithm ...50 3.2.3 New ideas regarding bilateral optimisation ...51 3.2.4 A few basic examples...52 3.2.5 Relative efficiency of bilateral optimisation
algorithms...54 3.2.6 Conclusion regarding bilateral optimisation...57 3.3 Multilateral optimisation ...57 3.3.1 Multilateral optimisation in PNS and TARGET2 ....57 3.3.2 A new concept: pre-conditioning ...58 3.3.3 The multilateral Las-Vegas algorithms ...59
3.3.4 Relative efficiencies of multilateral
optimisation algorithms...60 3.4 Optimisation in PNS in case of an operational failure...63 3.4.1 The PNS system ...63
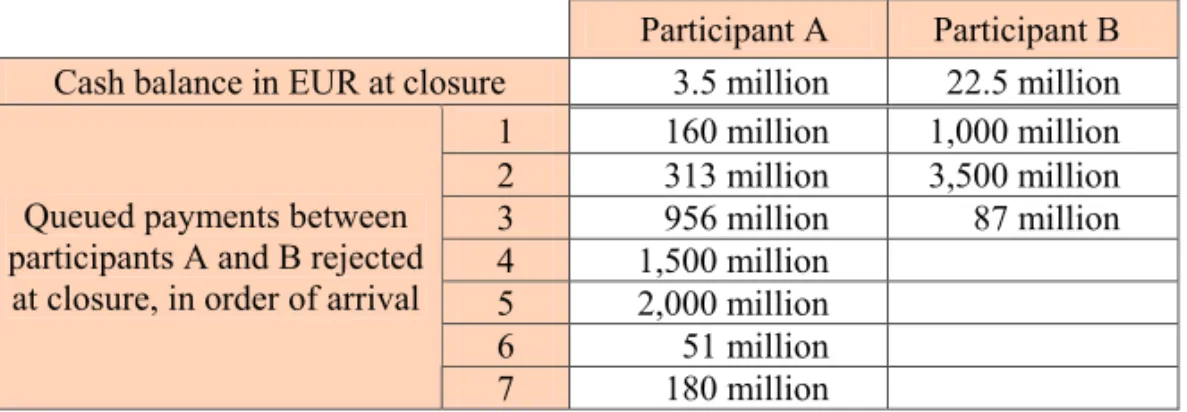
3.4.2 Simulating the technical default of the largest
3.4.3 Results...65 3.4.4 Payments rejected at the end of closure...68 3.5 Conclusions...70 References...72 Appendix 1. Bilateral optimisation algorithms ...73 Appendix 2. Multilateral optimisation algorithms ...76 Appendix 3. The Greedy algorithm of Güntzer et al and
3 From PNS to TARGET2:
the cost of FIFO in RTGS
payment systems
Abstract
Most of the recent RTGS payment systems are equipped with various optimisation algorithms that are able to increase the settlement speed by resolving fully or partially some of the gridlock situations that arise in the system. Today, most of the optimisation algorithms in use follow – at least partially– the FIFO (First In First Out) rule, meaning that they always settle the queued payments in their order of arrival. While the FIFO rule may be desirable based on some other considerations, for example legal ground, it creates an additional constraint to the optimisation problem, potentially leading to a less efficient solution in terms of settled value. The aim of this paper is to try to quantify to which extent non-FIFO optimisation algorithms can be more efficient than FIFO algorithms.
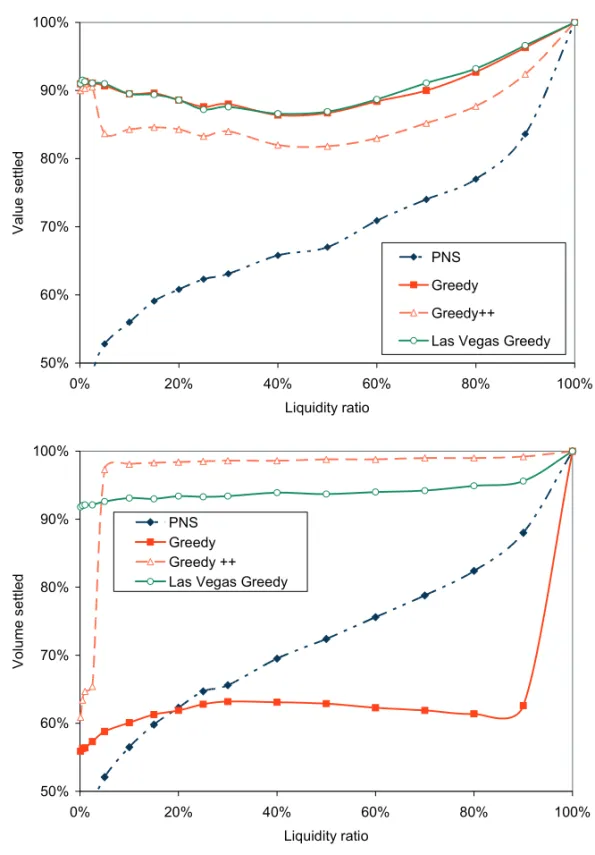
In the first part of this paper, some simulations performed on randomly generated sets of payments are used to evaluate the efficiency of several FIFO and non FIFO optimisation algorithms. This analysis is conducted both in the case of bilateral optimisation and in the case of multilateral optimisation. The results show that in those conditions, some non-FIFO algorithms are able to improve significantly on their FIFO counterparts.
In a second part, the impact of the different optimisation algorithms is investigated further by simulating the complete PNS system using real data. In the context of a liquidity crisis created by the technical failure of the largest participant of the system, the use of some non-FIFO algorithms is shown to reduce the number of rejected payments at the end of the day.