Volume 11, E211 DECEMBER 2014 BRIEF
Generational Differences in Fast Food
Intake Among South-Asian Americans:
Results From a Population-Based Survey
Monideepa B. Becerra, DrPH, MPH; Patti Herring, PhD, MA, RN; Helen Hopp Marshak, PhD, MS, MCHES; Jim E. Banta, PhD, MPH
Suggested citation for this article: Becerra MB, Herring P, Marshak HH, Banta JE. Generational Differences in Fast Food Intake Among South-Asian Americans: Results From a Population-Based Survey. Prev Chronic Dis 2014;11:140351. DOI: http://dx.doi.org/10.5888/pcd11.140351.
PEER REVIEWED
Abstract
The goal of this study was to evaluate the association between generational status and fast food consumption among South-Asi-an AmericSouth-Asi-ans. We conducted a secondary South-Asi-analysis of data from the California Health Interview Survey for 2007, 2009, and 2011. After adjusting for control variables, South-Asian Americans of the third generation or more had a fast food intake rate per week 2.22 times greater than first generation South-Asian Americans. Public health practitioners must focus on ways to improve dietary outcomes among this fast-growing ethnic population in the United States.
Objective
Poor dietary behaviors among South-Asian Americans (those from Bangladesh, Bhutan, India, Pakistan, Sri Lanka, Nepal, and the Maldives), increase with years of US residence and progressive generations (1,2), which in turn could explain the increased pre-valence of cardiovascular disease among the population (3–6). To date, however, evaluation of generational differences in fast food intake among South-Asian Americans is lacking. Addressing fast food intake in adults in this population is critical, because such di-etary practices have been significantly associated with increased risk of obesity and other chronic conditions (7). The goal of our population-based study was to evaluate the association between generational status and fast food consumption among South-Asi-an AmericSouth-Asi-ans.
Methods
We used adult data files from the public-access California Health Interview Survey (CHIS) for 2007, 2009, and 2011. CHIS is a bi-ennial population-based survey that uses a random-digit–dial sample, including both landline and cellular telephone numbers. Details on CHIS methods can be found elsewhere (8). For this study, 1,352 South-Asian Americans were included, representing an average annual estimate of 467,677 South Asians in California. CHIS defines South-Asian Americans as those from Bangladesh, India, Pakistan, and Sri Lanka. Fast food consumption was evalu-ated by using CHIS-reported number of times respondent con-sumed fast food in the past week. The CHIS-provided variable on country of birth for parents and self was used to create a genera-tion variable: first generagenera-tion (foreign born), second generagenera-tion (born in United States with both parents foreign born), and third generation or more (born in United States with at least 1 parent born in the United States).
Control variables were age, sex, marital status (married, not mar-ried), educational status (Associate degree or less, Bachelor de-gree or more), body mass index (BMI) (kg weight/height m2), and
poverty level (at or above 200% of the federal poverty level [FPL], below 200% FPL). Such variables were categorized on the basis of natural breakpoints in the population. In addition, we in-cluded English language proficiency to address the potential role of language in dietary practices to remain consistent with previous literature (2). The study was approved by Loma Linda University Institutional Review Board.
All analyses were survey-weighted by using the delete-1 jack-knife method for variance and standard error estimation in Stata 12 (Stata Corp LP). To obtain tests for statistical significance in univariate analysis, negative binomial regression was performed with past-week fast food intake as the outcome variable. On checking for assumptions, an adjusted model for negative binomi-al regression was performed for past-week fast food intake.
Design-based F statistics were used to assess significance of all analyses at P < .05.
Results
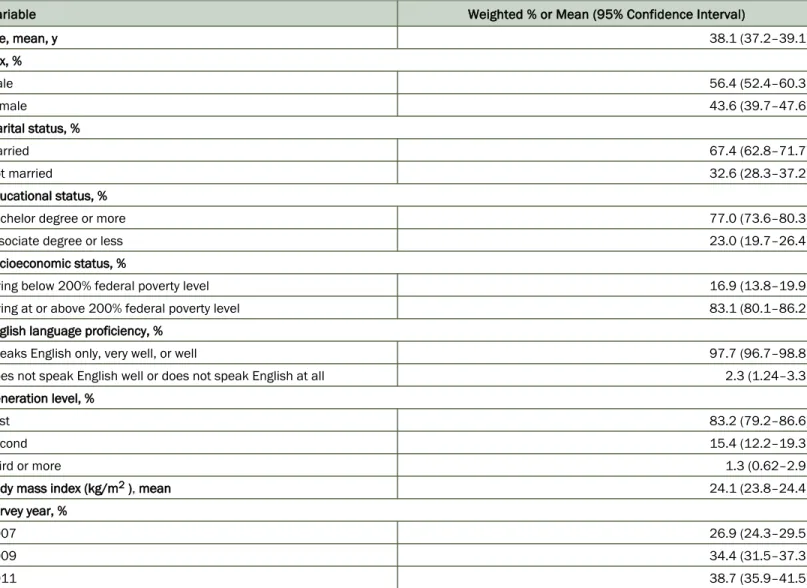
The mean age of our study population was 38 years, and most (56%) were men (Table 1). Most of our population were married (67%), had a Bachelor degree or more (77%), were living at or above 200% FPL (83%), reported speaking only English or Eng-lish very well or well (98%), and were first generation South-Asi-an AmericSouth-Asi-ans (83%). MeSouth-Asi-an BMI was 24.
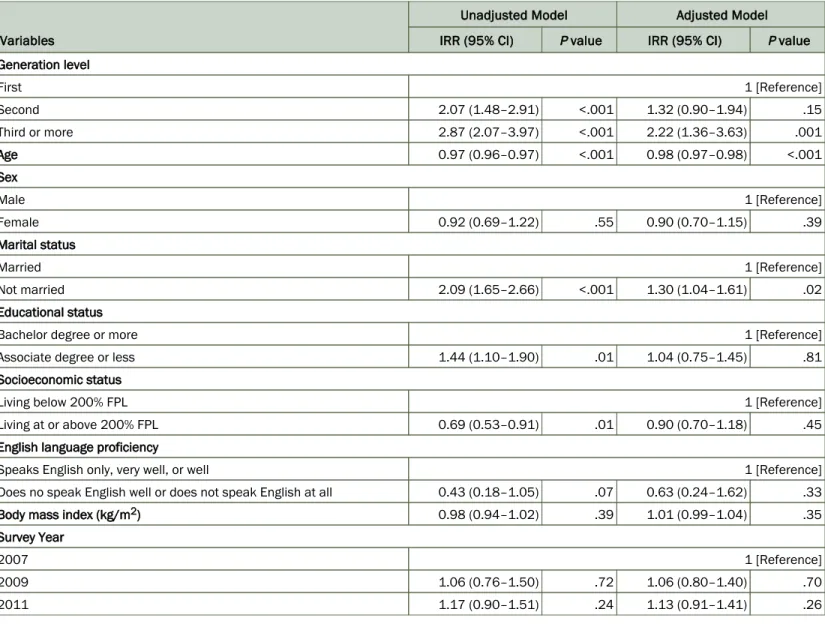
Several factors were significantly associated with past-week fast food intake among South-Asian American adults (Table 2). In-creased fast food intake was associated with not being married compared with being married, (incidence rate ratio [IRR] = 2.09), having an Associate degree or less in comparison to having Bach-elor degree or more (IRR = 1.44), and increasing generation (second generation, IRR = 2.07; third or more generation, IRR = 2.87) as compared with first generation. Conversely, yearly incre-mental increase in age was associated with a lower rate of past-week fast food intake (IRR = 0.97), as was living at or above 200% FPL, as compared with living below 200% FPL (IRR = 0.69).
Adjusted survey-weighted negative binomial regression analysis further demonstrated that third or more generation South-Asian Americans had a past-week fast food consumption rate 2.22 times higher than first generation South-Asian Americans. For every in-creasing year of age, an approximate 2% decrease in fast food con-sumption per week was noted. Similarly, not being married was associated with a 30% increased rate of past-week fast food con-sumption compared with those who reported being married.
Discussion
Consistent with previous literature highlighting the negative effect of increased generational status on diet among minority popula-tions (1,2,9), our study demonstrated that being South-Asian American of the third generation or more was significantly associ-ated with an increased rate of past-week fast food intake. Such res-ults show the need for targeted health promotion measures to
im-among those who were not married. This finding further corrobor-ates an earlier study, where married respondents ate fast food on fewer occasions (11). The lack of association between English lan-guage proficiency and fast food consumption was expected, be-cause the literature notes a high English proficiency in this popula-tion (12).
Our study has several limitations. The self-reported data in CHIS are susceptible to recall bias. Results are not generalizable to South-Asian American adults outside California, and small sample size further limited our ability to conduct sex-specific analysis. Despite such limitations, our study contributes to the limited body of literature on South-Asian Americans. Because this study was conducted using population-based survey data, findings are gener-alizable to South-Asian American residents of California. In addi-tion, although most previous studies have used intake of foods such as fruits, vegetables, grains, and fat to assess diet, we used fast food intake, which does not require assessment of culturally relevant food items or energy adjustment of food types, which are often limitations of cross-sectional or public-use data sets. Addi-tional studies providing insight into this association are necessary, in particular, questionnaires in South-Asian languages, longitudin-al studies, and studies addressing generationlongitudin-al differences in cardi-ovascular disease outcomes.
Acknowledgments
The authors thank Benjamin Becerra for his statistical consulta-tion. This project was partially funded by the Center for Health Research Dissertation Award at Loma Linda University. The au-thors declare no conflict of interest.
Author Information
Corresponding Author: Monideepa B. Becerra, DrPH, MPH, School of Public Health, Loma Linda University; Department of Health Science and Human Ecology, California State University, San Bernardino, 5500 University Parkway, San Bernardino CA 92407. Telephone: 909-537-5323. E-mail: [email protected]. Author Affiliations: Patti Herring, Helen Hopp Marshak, Jim E. Banta, School of Public Health, Loma Linda University, Loma
Sorkin DH, Billimek J. Dietary behaviors of a racially and ethnically diverse sample of overweight and obese Californians. Health Educ Behav 2012;39(6):737–44.
2.
Amin AP, Nathan S, Evans AT, Attanasio S, Mukhopadhyay E, Mehta V, et al. The effect of ethnicity on the relationship between premature coronary artery disease and traditional cardiac risk factors among uninsured young adults. Prev Cardiol 2009;12(3):128–35.
3.
Holland AT, Wong EC, Lauderdale DS, Palaniappan LP. Spectrum of cardiovascular diseases in Asian-American racial/ ethnic subgroups. Ann Epidemiol 2011;21(8):608–14.
4.
Enas EA, Mohan V, Deepa M, Farooq S, Pazhoor S, Chennikkara H. The metabolic syndrome and dyslipidemia among Asian Indians: a population with high rates of diabetes and premature coronary artery disease. J Cardiometab Syndr 2007;2(4):267–75.
5.
Misra R, Patel T, Kotha P, Raji A, Ganda O, Banerji M, et al. P r e v a l e n c e o f d i a b e t e s , m e t a b o l i c s y n d r o m e , a n d cardiovascular risk factors in US Asian Indians: results from a national study. J Diabetes Complications 2010;24(3):145–53. 6.
Pereira MA, Kartashov AI, Ebbeling CB, Van Horn L, Slattery ML, Jacobs DRJr, et al. Fast-food habits, weight gain, and insulin resistance (the CARDIA study): 15-year prospective analysis. Lancet 2005;365(9453):36–42.
7.
UCLA Center for Health Policy Research. California Health Interview Survey. http://healthpolicy.ucla.edu/chis/Pages/ default.aspx. Accessed July 18, 2014.
8.
Becerra MB, Herring P, Hopp Marshak H, Banta JE. Association between acculturation and binge drinking among Asian-Americans: results from the California Health Interview Survey. J Addict 2013;2013:248196. .
9.
August KJ, Sorkin DH. Racial/ethnic disparities in exercise and dietary behaviors of middle-aged and older adults. J Gen Intern Med 2011;26(3):245–50.
10.
Dave JM, An LC, Jeffery RW, Ahluwalia JS. Relationship of attitudes toward fast food and frequency of fast-food intake in adults. Obesity (Silver Spring) 2009;17(6):1164–70.
11.
Office of Minority Health. Asian American/Pacific Islander P r o f i l e . h t t p : / / m i n o r i t y h e a l t h . h h s . g o v / t e m p l a t e s / browse.aspx?lvl=2&lvlID=53. Accessed July 20, 2014. 12.
Tables
Table 1. Characteristics of Study Population (n = 1,352), Generational Differences in Fast Food Intake Among South-Asian Americ-ansa, California Health Interview Survey, 2007, 2009, and 2011b
Variable Weighted % or Mean (95% Confidence Interval)
Age, mean, y 38.1 (37.2–39.1) Sex, % Male 56.4 (52.4–60.3) Female 43.6 (39.7–47.6) Marital status, % Married 67.4 (62.8–71.7) Not married 32.6 (28.3–37.2) Educational status, %
Bachelor degree or more 77.0 (73.6–80.3)
Associate degree or less 23.0 (19.7–26.4)
Socioeconomic status, %
Living below 200% federal poverty level 16.9 (13.8–19.9)
Living at or above 200% federal poverty level 83.1 (80.1–86.2)
English language proficiency, %
Speaks English only, very well, or well 97.7 (96.7–98.8)
Does not speak English well or does not speak English at all 2.3 (1.24–3.3)
Generation level, %
First 83.2 (79.2–86.6)
Second 15.4 (12.2–19.3)
Third or more 1.3 (0.62–2.9)
Body mass index (kg/m2 ), mean 24.1 (23.8–24.4)
Survey year, %
2007 26.9 (24.3–29.5)
2009 34.4 (31.5–37.3)
2011 38.7 (35.9–41.5)
a The California Health Interview Survey defines South-Asian Americans as those from Bangladesh, India, Pakistan, and Sri Lanka.
Table 2. Unadjusted and Adjusted Negative Binomial Regression Analyses of Fast Food Intake Among South-Asian Americansa,
California Health Interview Survey, 2007, 2009, 2011b Variables
Unadjusted Model Adjusted Model
IRR (95% CI) P value IRR (95% CI) P value
Generation level First 1 [Reference] Second 2.07 (1.48–2.91) <.001 1.32 (0.90–1.94) .15 Third or more 2.87 (2.07–3.97) <.001 2.22 (1.36–3.63) .001 Age 0.97 (0.96–0.97) <.001 0.98 (0.97–0.98) <.001 Sex Male 1 [Reference] Female 0.92 (0.69–1.22) .55 0.90 (0.70–1.15) .39 Marital status Married 1 [Reference] Not married 2.09 (1.65–2.66) <.001 1.30 (1.04–1.61) .02 Educational status
Bachelor degree or more 1 [Reference]
Associate degree or less 1.44 (1.10–1.90) .01 1.04 (0.75–1.45) .81
Socioeconomic status
Living below 200% FPL 1 [Reference]
Living at or above 200% FPL 0.69 (0.53–0.91) .01 0.90 (0.70–1.18) .45
English language proficiency
Speaks English only, very well, or well 1 [Reference]
Does no speak English well or does not speak English at all 0.43 (0.18–1.05) .07 0.63 (0.24–1.62) .33
Body mass index (kg/m2) 0.98 (0.94–1.02) .39 1.01 (0.99–1.04) .35
Survey Year
2007 1 [Reference]
2009 1.06 (0.76–1.50) .72 1.06 (0.80–1.40) .70
2011 1.17 (0.90–1.51) .24 1.13 (0.91–1.41) .26
Abbreviation: IRR, incidence rate ratio; CI, confidence interval; FPL, federal poverty level.
a The California Health Interview Survey defines South-Asian Americans as those from Bangladesh, India, Pakistan, and Sri Lanka.