Durham Research Online
Deposited in DRO:
04 June 2014Version of attached le:
Published VersionPeer-review status of attached le:
Peer-reviewedCitation for published item:
Guo, Yuzheng and Clark, Stewart J. and Robertson, John (2014) 'Calculation of metallic and insulating phases of V2O3 by hybrid density functionals.', Journal of chemical physics., 140 (5). 054702.
Further information on publisher's website:
http://dx.doi.org/10.1063/1.4863325Publisher's copyright statement:
c
2014 American Institute of Physics. This article may be downloaded for personal use only. Any other use requires
prior permission of the author and the American Institute of Physics. The following article appeared in Guo, Yuzheng, Clark, Stewart J. and Robertson, John (2014) Calculation of metallic and insulating phases of V2O3 by hybrid density functionals, The Journal of Chemical Physics, 140, 054702 and may be found at http://dx.doi.org/10.1063/1.4863325.
Additional information:
Use policy
The full-text may be used and/or reproduced, and given to third parties in any format or medium, without prior permission or charge, for personal research or study, educational, or not-for-prot purposes provided that:
• a full bibliographic reference is made to the original source • alinkis made to the metadata record in DRO
• the full-text is not changed in any way
The full-text must not be sold in any format or medium without the formal permission of the copyright holders. Please consult thefull DRO policyfor further details.
Durham University Library, Stockton Road, Durham DH1 3LY, United Kingdom Tel : +44 (0)191 334 3042 | Fax : +44 (0)191 334 2971
Calculation of metallic and insulating phases of V2O3 by hybrid density functionals
Yuzheng Guo, Stewart J. Clark, and John RobertsonCitation: The Journal of Chemical Physics 140, 054702 (2014); doi: 10.1063/1.4863325 View online: http://dx.doi.org/10.1063/1.4863325
View Table of Contents: http://scitation.aip.org/content/aip/journal/jcp/140/5?ver=pdfcov Published by the AIP Publishing
Articles you may be interested in
Understanding ferromagnetism and optical absorption in 3d transition metal-doped cubic ZrO2 with the modified Becke-Johnson exchange-correlation functional
J. Appl. Phys. 115, 123909 (2014); 10.1063/1.4869916
Metal-insulator transition sustained by Cr-doping in V2O3 nanocrystals Appl. Phys. Lett. 100, 043103 (2012); 10.1063/1.3679396
Photoemission microscopy study of the two metal-insulator transitions in Cr-doped V2O3 Appl. Phys. Lett. 100, 014108 (2012); 10.1063/1.3675445
The power factor of Cr-doped V2O3 near the Mott transition Appl. Phys. Lett. 99, 171902 (2011); 10.1063/1.3655993
Correlation induced insulator to metal transition: A systematic density functional study on highly doped n -type trans-polyacetylene
THE JOURNAL OF CHEMICAL PHYSICS140, 054702 (2014)
Calculation of metallic and insulating phases of V
2O
3by hybrid
density functionals
Yuzheng Guo,1Stewart J. Clark,2and John Robertson1,a)
1Department of Engineering, University of Cambridge, Cambridge CB3 0FA, United Kingdom 2Department of Physics, University of Durham, Durham DH1 3LE, United Kingdom
(Received 8 October 2013; accepted 14 January 2014; published online 3 February 2014)
The electronic structure of vanadium sesquioxide V2O3 in its different phases has been calcu-lated using the screened exchange hybrid density functional. The hybrid functional accurately re-produces the experimental electronic properties of all three phases, the paramagnetic metal (PM) phase, the anti-ferromagnetic insulating phase, and the Cr-doped paramagnetic insulating (PI) phase. We find that a fully relaxed supercell model of the Cr-doped PI phase based on the corundum structure has a monoclinic-like local strain around the substitutional Cr atoms. This is found to drive the PI-PM transition, consistent with a Peierls-Mott transition. The PI phase has a calcu-lated band gap of 0.15 eV, in good agreement with experiment. © 2014 AIP Publishing LLC. [http://dx.doi.org/10.1063/1.4863325]
I. INTRODUCTION
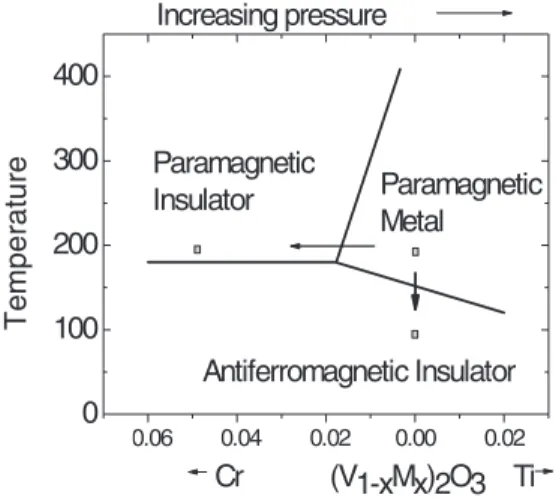
The vanadium oxides have been extensively studied as canonical examples of metal insulator transitions (MIT) in a correlated oxide system which can be accessed by varying the temperature, pressure, or doping.1,2 In particular, V2O3 ex-hibits three phases, a paramagnetic metallic (PM) phase with the corundum structure, a paramagnetic insulating (PI) phase with the same corundum structure, accessed by Cr doping or pressure, and a monoclinic antiferromagnetic insulator (AFI) phase which is stabilized at low temperature, Fig. 1. Early approaches used crystal field theory to account for the level splitting of the V 3d states, the orbital occupancies and the spin states.3Later, X-ray photoemission spectra (XPS), X-ray absorption spectra (XAS), and the optical response4–15 were used to understand the changes of electronic structure across the transitions.
At the same time, electronic structure calculations of increasing sophistication have been employed to treat V2O3.16–26 The simple local spin density approximation (LSDA) is known to be unable to give a band gap for the in-sulating phases of V2O316 due to its inability to treat the lo-calizeddelectrons correctly. On the other hand, the LSDA+U method can open up a gap for open-shell d electron systems,17 but with the disadvantage that the on-site repulsion, U, is a variable. Thus, more sophisticated calculation methods such as the GW method18are used, which can give a gap in the AFI phase of V2O3. The dynamic mean field theory (DMFT) also finds a band gap in both the AFI and PI phases.19–23The aim of GW and DMFT is to give the best description of the elec-tronic structure of a few (embedded) atoms. However, both GW and DMFT require a previous local density calculation to determine the equilibrium geometry. There is no simulta-neous calculation of the atomic and electronic structure. How-ever, in Peierls transitions or at defects, the electronic struc-a)[email protected]
ture depends directly on the atomic structure, so it is desir-able to have a calculation method that gives the atomic and electronic structures in a “single shot.” In addition, GW and DMFT are computationally expensive, and lower cost meth-ods are desirable.
The need for single shot methods arises from two causes. First, there has always been an interest in whether a spe-cific system was a Mott insulator or a Peierls insulator, such as in vanadates and manganites and many related oxide systems.27–29 However, it is not so easy to follow the elec-tronic structure across a transition where the atomic structure varies. Second, there is growing interest in using correlated oxide systems such as vanadium oxides in microelectronics, such as in high switching current Mott field effect transis-tors or “Mott-FETs,”30–32in non-volatile resistive random ac-cess memories (RRAM),33 and in fast optical switches.34–39 Peierls-based RRAMs can have fast switching speeds arise because a Peierls transition involves small atomic displace-ments, compared to the longer distance migration of oxygen vacancies that occurs in a conventional RRAMs.
The modeling of such systems and applications for cor-related oxides would benefit from having a lower cost vari-ational method that would predict the band gap and atomic geometry, using∼100 atom supercell models of doped, defec-tive, or disordered oxide systems. We show that hybrid func-tionals could provide such an approach for V2O3.
Hybrid density functionals are family of orbital-dependent exchange-correlation functionals where a frac-tion of Hartree-Fock (HF) exchange is mixed into the lo-cal exchange-correlation density functional of density func-tional theory.40–49Several hybrid functionals have been devel-oped, such as the B3LYP,41 PBE0, the Heyd, Scuseria, Ernz-erhof (HSE) methods,42,43and screened exchange (sX)40,48,49 method. Hybrid functionals are generalised Kohn-Sham functionals,42 so they can be used variationally to relax ge-ometries, give good band gaps,46–49 and are efficient enough to treat supercells of 100 or more atoms. Hybrid functionals
054702-2 Guo, Clark, and Robertson J. Chem. Phys.140, 054702 (2014) -0.06 -0.04 -0.02 0.00 0.02 0 100 200 300 400 Temperat u re Cr (V1-xMx)2O3 Ti Paramagnetic
Insulator Paramagnetic
Metal
Antiferromagnetic Insulator Increasing pressure
FIG. 1. Schematic magnetic phase diagram of V2O3 with respect to Cr
(and Ti) doping.
have been used to calculate the single particle band structures of various transition metal oxides.50–54 The HSE functional was used previously to study the MIT in VO2with changing the crystal structure,50 but based on experimental atomic co-ordinates. Here, we find that the sX functional will reproduce the correct single-particle electronic structure in all the three phases of V2O3 without any fitting parameter. This validates the observation of Ioriet al.45that the failure of LSDA to treat these correlated electron systems is due to its poor description of the exchange interaction, not the correlation.
We noted above that GW and DMFT could provide good descriptions of the electronic structures of each phase. It was initially thought that pressure and doping had the same ef-fect on the MIT.2 To date, DMFT studies tended to use the experimental contraction of the lattice parameters and the in-ternal atomic coordinates of a pure PM V2O3primitive cell to simulate Cr doping.21,22 However, recent experiments show that the PI-PM transition due to pressure and Cr doping are not equivalent.7 A supercell calculation is highly desired by the DMFT community. Thus, Cr doping must be allowed to vary the internal atomic positions. Here, we present a one-shot study of the Cr-doped V2O3PI phase with local atomic relax-ations, by substituting Cr atoms in a large V2O3supercell and relaxing internal geometries variationally using the sX hybrid functional. Note that the ground state of V2O3 is antiferro-magnetic not non-antiferro-magnetic, so the possible problem55noted for HSE in VO2does not apply.
II. METHOD
The calculations are carried out with the CASTEP plane-wave pseudopotential code.56Norm-conserving pseudopoten-tials were generated by the OPIUM code.57 The plane wave cutoff energy is set to 780 eV with a total energy convergence of better than 0.01 eV per atom. For primitive cells, the Bril-louin zone integrations use a 4×4×4 Monkhorst-Pack (MP) grid giving a similar level of convergence. An MP grid of 5×5×5 is used to calculate the density of states (DOS).
Fig.2 shows the corundum R3c structure in the primi-tive cell and the 120-atom supercell model of the Cr-doped
FIG. 2. (a) Corundum structure primitive cell. Oxygen=red, V=grey. (b) Supercell used to calculate the doped PI phase.
V2O3 PI phase. The supercell consists of a 2× 2 ×1 su-percell of the hexagonal corundum unit cell and it has 2 Cr atoms, equivalent to 4.2% of Cr. Two Cr atoms per supercell are needed to model the PI phase, as a single spin from one Cr atom will transform the whole system into an AFI phase. The internal coordinates of the supercell are completely re-laxed with spin-degenerate sX functional. The residual force is less than 0.01 eV/A. Only the point is used for the ge-ometry relaxation. A 3×3×1 MP grid is used for the DOS calculation for this supercell.
III. RESULTS
In the corundum structure (Fig. 2(a)), the V atoms are surrounded by an octahedron of oxygen atoms with a trigonal distortion, which splits the 3d states into singly degenerate a1g and doubly degenerated e2g states. It was shown both by experiment and calculation that V has a mixed orbital occupa-tion where both a1gand e2gstates are partially filled.6,17,21,22 In the monoclinic structure, the adjacent V atoms form weak V–V bonds in the plane perpendicular to the z axis.
Fig. 3 shows the band structure and partial density of states (PDOS) of the PM phase using the experimental hexag-onal cell lattice constants (a=4.951 Å and c =14.004 Å). The Fermi level EFis set to 0 eV and lies within the V 3dπ states. The V 3dπstates above−1 eV hybridize weakly with Opstates. The O 2pstates lie from−4 eV to−8 eV and hy-bridize significantly with V dσ states. The V 3dband above
−1 eV is noticeably narrower in the PM than in the other phases. The lowest band at−0.8 eV has a sizable dispersion along -L-M representing the a1g bonding state of the V–V pair (Fig.3(b)).
Fig. 4 compares the calculated DOS with that from photoemission.6,10TableIcompares the various band widths and the energies of peaks A and B in the V 3dvalence band as calculated by different methods and from photoemission.6,10 The peaks A and B are labeled in Fig.4. We find that the to-tal DOS of the PM phase in sX is similar to that found by DMFT.21 The O 2p states are shifted down by 1 eV in sX compared to in LDA, and the V 3dvalence band is wider in sX and DMFT19than in LDA, consistent with the photoemis-sion spectra.5,6,10 Some Vscharacter is found at−8 eV in Fig.3(a), as seen in previous calculations.10
054702-3 Guo, Clark, and Robertson J. Chem. Phys.140, 054702 (2014) (a) -10 -8 -6 -4 -2 0 2 4 6 8 10 total V s (x5) Dens it y of St at es Energy ,eV
PM
O V d E F (b) -8 -6 -4 -2 0 2 4 6 8 K L Γ Energy , e V MFIG. 3. (a) Calculated total and partial DOS for PM phase. (b) The band structure of PM phase in the hexagonal version of the unit cell. The Fermi level is at 0 eV. -4 -2 0 2 4 6 B B B A A XPS XPS E F AFI PI
Density of States (a.
u
.)
Energy (eV) PM
XPS A
FIG. 4. Total DOS of each phase compared to photoemission spectra.6Here, the Fermi energy of the PM phase is set to 0 eV, and the midgap of the AFI and PI phases is set to 0 eV.
TABLE I. Comparison of the calculated DOS to XPS data. The two peaks in the V 3dPDOS are labeled in Fig.4.
eV VB width V 3dwidth Peak A Peak B
PM Expt.6,11 9.2 1.5 0.2 1.4 PBE16 8.2 1 0.1 0.9 DMFT21,22 . . . 1.5 0.2 1.4 sX 8.8 1.2 0.1 1 AFI Expt.6,17 9.2 2.2 0.5 1.2 LDA+U18 . . . 1.2 0.4 1 sX 8.8 1.9 0.4 1.0–1.4 PI Expt.6,11 9.2 2.2 0.5 1.1 PBE16 8.2 1 0.1 0.9 U+GW18 8.6 1 0.1 0.9 DMFT21,22 . . . 2.2 0.1 1.2 sX 8.8 2.2 0.4 1.1–1.5
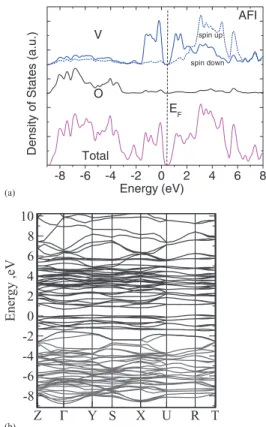
Fig.5shows the bands and PDOS for the AFI phase in sX. The VBM is set to 0 eV. The O 2pstates are still sepa-rated from the V 3d states, but the V 3d-O 2phybridization is stronger here than in the PM phase. Both the valence band maximum (VBM) and the conduction band minimum (CBM) consist of V 3d states, consistent with a Mott-Hubbard in-sulator. The O 2p and V 3d valence bands are both wider than in the PM phase (Fig.4, TableI). A sharp peak in the valence band at −0.8 eV in the PM phase disappears and is replaced by several peaks from 0 to −1.5 eV, consistent with photoemission for the AFI phase.6,12 A high resolu-tion hard X-ray photoemission spectrum confirms that the va-lence band spectrum has many components6 with two large
(a)
-8 -6 -4 -2 0 2 4 6 8
spin up
AFI
Density of States (a.
u .) Energy (eV) Total V O EF spin down Z Γ Y S X U R T -8 -6 -4 -2 0 2 4 6 8 10 Energy ,eV (b)
FIG. 5. (a) The DOS and partial DOS of monoclinic AFI phase. (b) The band structure of monoclinic AFI phase. VBM is set to 0 eV.
054702-4 Guo, Clark, and Robertson J. Chem. Phys.140, 054702 (2014)
TABLE II. Comparison of experimental band gaps and those calculated by different functionals for the AFI phase.
Optical gap61–63LDA16LDA+U17GW18U+GW18 sX
Eg(direct) (eV) 0.5–0.66 0 0.60 0 0.943 0.76
Eg(indirect) (eV) 0.835 0.63
peaks labeled A and B lying at −0.3 eV and −1.1 eV, re-spectively. Our DOS has two large peaks at −0.1 eV and
−1.2 eV. LDA+DMFT does not reproduce the peak A.19,21,22 The magnetic moment of the V atom is calculated to be 1.8μB, close to the LDA+U value17 of 1.7μ
B. The spin is automatically relaxed in the spin-polarized calculation, thus this value identifies the S =1 local moment as the ground state, consistent with experiment58and previous analysis,59,17 and contrary to the Castellini model.60
Fig5(b)shows the band structure of the AFI phase. The calculated band gap of 0.63 eV agrees well with the exper-imental optical gap of 0.50–0.66 eV.51,54–56 AFI V2O3 has an indirect gap with a VBM between R and T, and a CBM at . The direct gap at is 0.1 eV wider than the indirect gap. The band gaps from different calculations and experi-ments are compared in TableII. Our results are similar to the band structure from the U+GWA method18but the band gap is more accurate and covers more of reciprocal space.
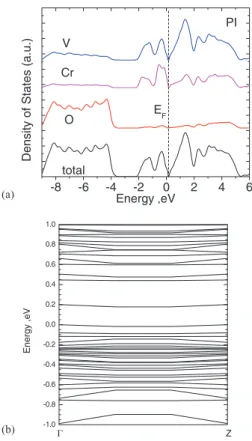
Turning to the PI phase, the corundum structure without doping gives a metallic ground state and the monoclinic struc-ture gives an insulating ground state in sX. For the supercell model of the PI phase, the internal coordinates are relaxed within sX. The Cr atom, surrounded by an oxygen octahe-dron, has the same local symmetry as V, but individual bond lengths now change. Due to the limit on supercell size, we studied the MIT at the Cr content of 4.2% not the experimen-tal value of∼1.5%. We find that at 4.2% Crcincreases by 1.3% andadecreases by 0.5%, consistent with experimental lattice parameter data.6,8
Fig. 6 shows the total DOS, PDOS, and bands of a PI V2O3cell with 4.2% Cr doping. The V 3dvalence PDOS re-sembles that of the AFI phase. The V 3dstates range from 0 eV to−2 eV, almost twice as wide as in the PM phase. The multi-peak feature remains, with two prominent PDOS peaks at a similar energy as in AFI phase. The calculated band gap of 0.16 eV in Fig.6(b)is consistent with the photoemission value of 0.1 eV.6,10 The VBM is localized around Cr atoms while the CBM consists of one flat band delocalized on V atoms. There is a similar band of 0.19 eV separating the CBM from the bulk conduction bands. We also plot in Fig.6 the partial DOS of Cr and V. The Cr PDOS is similar to that of V. The states from V and Cr are highly hybridized. The most significant peak from the Cr PDOS is about−1.8 eV from the Fermi level, in good agreement with the small peak at−2 eV seen by Moet al.6 The highly localized band edges from V 3dstates suggest the PI phase to be a typical Mott-Hubbard type.
We do not expect sX to fully match the photoemission spectra because the dynamical effects included in DMFT are not present. But the band gap opening in different phases of V2O3 shows that the band structures of strongly correlated
(a) -8 -6 -4 -2 0 2 4 6
PI
Cr V
O
Density of States (a.
u .) Energy ,eV total EF (b) -1.0 -0.8 -0.6 -0.4 -0.2 0.0 0.2 0.4 0.6 0.8 1.0 Energy ,eV Z Γ
FIG. 6. (a) The total and partial DOS of the corundum PI phase. (b) Band structure of PI phase near the band gap.
electrons are greatly improved over (semi-) local functionals by introducing the non-local exchange. sX provides a reason-able description of single particle states in strongly correlated systems at an affordable computational cost. Advanced meth-ods such as DMFT and GW corrections can be applied on top of sX if necessary to include dynamic effects.
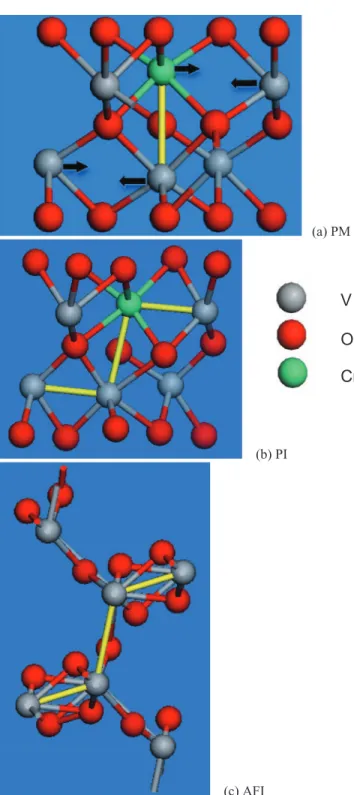
The metal-oxygen bond lengths in the PI phase are sum-marized in TableIII. The average bond length in the PI phase is the same as in PM. However, the average Cr–O bond length of 2.07 Å is 2% larger than the V–O bond length of 2.02 Å. The metal-metal distances change more significantly. The in-plane metal-metal bonds shrink by 24% from 2.97 Å to 2.24 Å. The shortened metal-metal bonds in PI resemble the bonding in the AFI phase (Fig.7). Therefore, Cr-doping in-troduces significant local strain.14
We have stretched the primitive cell of corundum PM phase in different modes including uniaxial, biaxial, and uni-form tension. None of these macroscopic strain modes can alone induce the MIT. Fig.7compares the atomic local struc-tures of each phase. Fig.7(a)shows the corundum structure
TABLE III. Comparison of calculated metal-oxygen bond lengths in each phase.
PM corundum AFI monoclinic PI corundum
Metal-O bond length (Å) 2.02 1.94 2.02(V–O)
2.07(Cr–O)
Metal-metal bond (Å) 2.78 2.87 2.81(V–V)
054702-5 Guo, Clark, and Robertson J. Chem. Phys.140, 054702 (2014)
(a) PM
(b) PI
(c) AFI
FIG. 7. Calculated local atomic structure of PM (a), PI(b), and AFI(c) phases. Oxygen=red ,V=grey. The doped Cr atom is shown as green. The yellow bond in (a) is the metal-metal pair bonding along diagonal in corundum structure (2.78 Å). The arrows show the deviation of V atoms in-duced by Cr doping. The planar distance between metals is 2.97 Å and thus is not shown as bond. (b) and (c) The more planar yellow bonds are formed between the neighboring metal atoms in the xy plane perpendicular to the diagonal in corundum structure. (b) The planar bond length is 2.24 Å while Cr–V is 2.72 Å. (c) The planar bond length is 2.39 Å while the diagonal one is 2.89 Å.
without relaxation. Only metal atoms along the diagonal are paired, as shown by the yellow bond. Fig. 7(b) shows the relaxed PI structure. The Cr tends to bond with the planar neighboring V’s. The Cr–V bonding in the xy plane shifts the metal atom towards the hollow site in the corundum
struc-FIG. 8. (a) Perfect cell; (b) Cr doped cell with no relaxation; (c) Cr doped re-laxed cell; (d) rere-laxed doped cell but without doping; and (e) Cr-dimer doped fully relaxed cell. Only V and Cr atoms are shown. V=grey, dopant Cr
=red. Insulating phases shown shaded.Note the correlation of insulating to relaxed cell with separated dopants.
ture as shown by the arrows in Fig. 7(a). The original metal dimer along the c axis is thus tilted. If the Cr concentration is low, only the local atomic structure is affected and there is no long-range structural change. If the distance between neighboring Cr atoms is small enough, all the metal atoms will deviate from corundum structure and form a zigzag chain. The oxygen octahedron has been retained. In the monoclinic AFI structure, the metal atoms have been further displaced and the oxygen octahedra have also been severely distorted. If we compare the metal bonding, it is clear that the PI and AFI phases share similar metal-metal bonds as shown by the yel-low lines. As both band edges in all phases are mainly metald
type, the PI phase with similar metal distortion has the similar valence band width as the AFI phase.
The key question is whether electron doping or structural (Peierls) distortion drives the PI-PM MIT. In order to separate these two effects, we calculated the band structure of unre-laxed Cr-doped V2O3and the relaxed geometry without dop-ing, using the same 120-atom supercells, as shown schemat-ically in Fig.8. Insulating supercells are shown shaded. The relaxed “undoped” cell is achieved by back-substituting V for Cr into the relaxed cell. The unrelaxed system remains metal-lic. The relaxed cell with no doping is insulating, with a simi-lar band gap to the doped sample. Combined with the previous Cr PDOS analysis, we therefore argue that local strain rather than doping causes this MIT. If local strain is the driving force for the transition, this will depend on dopant positions. If the two Cr atoms are far away from each other as above, the su-percell is found to be insulating. However, if the two Cr atoms are close together as a dimer, Fig.8(e), the effective strain is less and the cell remains metallic. The Cr-dimer doped V2O3 further confirms that electron doping is not the main driving force. Overall, the extra two electrons of two Cr atoms enter an extra valence state, and the MIT works by a strain opening of the band gap. Thus, our calculations suggest that the PM-PI
054702-6 Guo, Clark, and Robertson J. Chem. Phys.140, 054702 (2014)
transition of V2O3has a component of Peierls transition in it, to add to its Mott-like character, like in VO2,28driven by V–V chain formation. Whereas it has been noted that V4+ oxides are generally Peierls insulators and V3+oxides are generally Mott insulators,27the contribution of lattice relaxation to the band gap opening in PI V2O3 suggests that V2O3 is also a Peierls-Mott system.
Overall, Fig. 4 and Tables I and II show that the sX method gives spectroscopic features in good agreement with experiment. The band gaps and band widths are good. The peak positions in the upper valence band found by sX com-pare to within 0.1 eV of experiment and comparable to those found by DMFT or GW.
IV. CONCLUSIONS
In summary, we have calculated the electronic structure of the PM, PI, and AFI phases of V2O3 with the sX hybrid functional. The PI phase is simulated by 4.2% Cr doping in a supercell, and the internal atomic coordinates are relaxed with sX. The sX functional with local relaxations gives cor-rectly the metallic and both insulating phases. A calculation of unrelaxed and un-doped V2O3supercells shows that local distortions around Cr sites rather than electron doping is the main driving force for the PM/PI MIT. The band gaps of the PI and AFI phases are 0.15 eV and 0.63 eV, in good agreement with experiment. The band widths are also in good agreement with photoemission. Overall, this suggests that hybrid func-tionals provide a simple, single-shot method to analyze com-plex metal insulator transitions combining Peierls and Mott-like components. It emphasizes that it is improvements to the LSDA description of the exchange interaction not the correla-tion interaccorrela-tions that are needed to correctly describe oxides with correlatedstates.
1M. Imada, A. Fujimori, and Y. Tokura, Rev. Mod. Phys. 70, 1039
(1998).
2D. B. McWhan and J. P. Remeika,Phys. Rev. B2, 3734 (1970).
3J. B. Goodenough,Prog. Solid State Chem.5, 145 (1971); J. B.
Goode-nough and J. S. Zhou,Chem. Mater.10, 2980 (1998).
4K. E. Smith and V. E. Henrich,Phys. Rev. B38, 5965 (1988).
5R. Zimmermann, P. Steiner, R. Claessen, F. Reinert, S. Hufner, P. Blaha,
and P. Dufek,J. Phys. Condens. Matter11, 1657 (1999).
6S. K. Mo, H. D. Kim, J. D. Denlinger, J. W. Allen, J. H. Park, A. Sekiyama,
A. Yamasaki, S. Suga, Y. Saitoh, T. Muro, and P. Metcalf,Phys. Rev. B74, 165101 (2006).
7F. Rodolakis, P. Hansmann, J. P. Rueff, A. Toschi, M. W. Haverkort, G.
Sangiovanni, A. Tanaka, T. Saha-Dasgupta, O. K. Andersen, K. Held, M. Sikora, I. Alliot, J. P. Itiè, F. Baudelet, P. Wzietek, P. Metcalf, and M. Marsi,
Phys. Rev. Lett.104, 047401 (2010).
8F. Rodolakis, J. P. Rueff, M. Sikora, I. Alliot, J. P. Itiè, F. Baudelet, S. Ravy,
P. Wzietek, P. Hansmann, A. Toschi, M. W. Haverkort, G. Sangiovanni, K. Held, P. Metcalf, and M. Marsi,Phys. Rev. B84, 245113 (2011).
9F. Rodolakis, B. Mansart, E. Papalazarou, S. Gorovikov, P. Vilmercati, L.
Petaccia, A. Goldini, J. P. Rueff, S. Luipi, P. Metcalf, and M. Marsi,Phys. Rev. Lett.102, 066805 (2009).
10E. Papalazarou, M. Gatti, M. Marsi, V. Brouet, F. Iori, L. Reining, E.
An-nese, I. Vobornik, F. Offi, A. Fondacaro, S. Huotari, P. Lacovig, O. Tjem-berg, N. B. Brookes, M. Sacchi, P. Metcalf, and G. Pannaccioni,Phys. Rev. B80, 155115 (2009).
11H. Fujiwara, A. Sekiyama, S. K. Mo, J. W. Allen, J. Yamaguchi, G.
Fun-abashi, S. Imada, P. Metcalf, A. Higashiya, M. YFun-abashi, K. Tamasaku, T. Ishikawa, and S. Suga,Phys. Rev. B84, 075117 (2011).
12S. Lupi, L. Baldassarre, B. Mansart, A. Perucchi, A. Barinov, P. Dudin, E.
Papalazarou, F. Rodolakis, J. P. Rueff, J. P. Itiè, S. Ravy, D. Nicoletti, P.
Postorino, P. Hansmann, N. Parragh, A. Toschi, T. Saha-Dasgupta, O. K. Andersen, G. Sangiovanni, K. Held, and M. Marsi,Nat. Commun.1, 105 (2010).
13B. Mansart, A. Barinov, P. Dudin, L. Baldassarre, E. Papalazarou,
P. Metcalf, S. Lupi, and M. Marsi, Appl. Phys. Lett. 100, 014108 (2012).
14A. I. Frenkel, D. M. Pease, J. I. Budnick, P. Metcalf, E. A. Stern, P.
Shan-thakumar, and T. Huang,Phys. Rev. Lett.97, 195502 (2006).
15A. Perucchi, L. Baldassarre, B. Postorino, and S. Lupi,J. Phys. Condens.
Matter21, 323202 (2009).
16L. F. Mattheiss,J. Phys.: Condens. Matter6, 6477 (1994).
17S. Y. Ezhov, V. I. Anisimov, D. I. Khomskii, and G. A. Sawatzky,Phys.
Rev. Lett.83, 4136 (1999).
18S. Kobayashi, Y. Nohara, S. Yamamoto, and T. Fujiwara,Phys. Rev. B78,
155112 (2008).
19A. I. Poteryaev, J. M. Tomczak, S. Biermann, A. Georges, A. I.
Lichten-stein, A. N. Rubtsov, T. Saha-Dasgupta, and O. K. Andersen,Phys. Rev. B 76, 085127 (2007).
20A. Georges, G. Kotliar, W. Krauth, and M. J. Rozenberg,Rev. Mod. Phys.
68, 13 (1996).
21K. Held, G. Keller, V. Eyert, D. Vollhardt, and V. I. Anisimov,Phys. Rev.
Lett.86, 5345 (2001).
22G. Keller, K. Held, V. Eyert, D. Vollhardt, and V. I. Anisimov,Phys. Rev.
B70, 205116 (2004).
23R. J. O. Mossanek, M. Abbate, T. Yoshida, A. Fujimori, Y. Yoshida, N.
Shirkawa, H. Eisaki, S. Kohno, and F. C. Vicentini, Phys. Rev. B 78, 075103 (2008).
24J. C. Woicik, M. Yekutiel, E. J. Nelson, N. Jacobson, P. Pfalzer, M. Klemm,
S. Horn, and L. Kronik,Phys. Rev. B76, 165101 (2007).
25F. Iori, F. Rodolakis, M. Gatti, L. Reining, M. Upton, Y. Shvydko, J. P.
Rueff, and M. Marsi,Phys. Rev. B86, 205132 (2012).
26D. Grieger, C. Piefke, O. E. Peil, and F. Lechermann,Phys. Rev. B86,
155121 (2012).
27Y. Ishige, T. Sudayama, Y. Wakisaka, T. Mizokawa, H. Wadati, G. A.
Sawatzky, T. Z. Regier, M. Isobe, and Y. Ueda,Phys. Rev. B83, 125112 (2011).
28C. Weber, D. D. O’Regan, N. D. M. Hine, M. C. Payne, G. Kotliar, and
P. B. Littlewood,Phys. Rev. Lett.108, 256402 (2012).
29D. I. Khomskii,J. Mag. Mag. Mater.306, 1 (2006).
30J. Son, S. Rajan, S. Stemmer, and S. J. Allen,J. Appl. Phys.110, 084503
(2011).
31M. Boucherit, O. F. Shoron, T. A. Cain, C. A. Jackson, S. Stemmer, and S.
Rajan,Appl. Phys. Lett.102, 242909 (2013).
32P. Moetakef, T. A. Cain, D. G. Ouellette, J. Y. Zhang, D. O. Klenov, A.
Janotti, C. G. van de Walle, S. Rajan, S. J. Allen, and S. Stemmer,Appl. Phys. Lett.99, 232116 (2011).
33K. Martens, I. P. Radu, S. Mertens, X. Shi, and L. Nyns,J. Appl. Phys.112,
124501 (2012).
34A. Cavalleriet al.,Phys. Rev. Lett.87, 237401 (2001);Phys. Rev. B70,
161102 (2004).
35H. T. Kimet al.,Phys. Rev. Lett.97, 266401 (2006). 36C. Kubleret al.,Phys. Rev. Lett.99, 116401 (2007).
37P. Baum, D. S. Yang, and A. H. Zewail,Science318, 788 (2007). 38J. Nag, R. F. Haglund, E. A. Payant, and K. L. More,J. Appl. Phys.112,
103532 (2012).
39X. Yuan, W. Zhang, and P. Zhang,Phys. Rev. B88, 035119 (2013). 40D. M. Bylander and L. Kleinman,Phys. Rev. B41, 7868 (1990). 41A. D. Becke,J. Chem. Phys.98, 1372 (1993).
42A. Seidl, A. Görling, P. Vogl, J. A. Majewski, and M. Levy,Phys. Rev. B
53, 3764 (1996).
43J. Heyd, G. E. Scuseria, and M. Ernzerhof,J. Chem. Phys. 118, 8207
(2003).
44A. V. Krukau, O. A. Vydropv, A. F. Izmaylov, and G. E. Scuseria,J. Chem.
Phys.125, 224106 (2006).
45J. Paier, M. Marsman, K. Hummer, G. Kresse, I. C. Gerber, and J. G.
Angyan,J. Chem. Phys.124, 154709 (2006).
46M. Marsman, J. Paier, A. Stropa, and G. Kresse,J. Phys. Condens. Matter
20, 064201 (2008).
47J. Muscat, A. Wander, and N. M. Harrison,Chem. Phys. Lett.342, 397
(2001).
48K. Xiong, J. Robertson, M. C. Gibson, and S. J. Clark,Appl. Phys. Lett.
87, 183505 (2005).
49S. J. Clark and J. Robertson,Phys. Rev. B82, 085208 (2010). 50V. Eyert,Phys. Rev. Lett.107, 016401 (2011).
054702-7 Guo, Clark, and Robertson J. Chem. Phys.140, 054702 (2014)
51F. Iori, M. Gatti, and A. Rubio,Phys. Rev. B85, 115129 (2012). 52C. Rodl, F. Fuchs, J. Furthmuller, and F. Bechstedt, Phys. Rev. B 79,
235114 (2009).
53Y. Guo, S. J. Clark, and J. Robertson,J. Phys.: Condens. Matter24, 325504
(2012).
54R. Gillen and J. Robertson,Phys. Rev. B87, 125116 (2013).
55R. Grau-Crespo, H. Wang, and U. Schwingenschlogl,Phys. Rev. B86,
081101 (2012).
56M. D. Segall, P. J. D. Lindan, M. J. Probert, C. J. Pickard, P. J. Hasnip, S.
J. Clark, and M. C. Payne,J. Phys. Condens. Mater.14, 2717 (2002); S. J. Clark, M. D. Segall, C. J. Pickard, P. J. Hasnip, M. J. Probert, K. Refson, and M. C. Payne,Zeit. Krist.220, 567 (2005).
57A. M. Rappe, K. M. Rabe, E. Kaxiras, and J. D. Joannopoulos,Phys. Rev.
B41, 1227 (1990).
58G. A. Thomas, D. H. Rapkine, S. A. Carter, A. J. Millis, T. F. Rosenbaum,
P. Metcalf, and J. M. Honig,Phys. Rev. Lett.73, 1529 (1994).
59L. Paolasini, C. Vettier, F. De Bergevin, F. Yakhou, D. Mannix, A. Stunault,
W. Neubecket al.,Phys. Rev. Lett.82, 4719 (1999).
60C. Castellani, C. R. Natoli, and J. Ranninger,Phys. Rev. B18, 4945 (1978);
18,4967(1978).
61R. M. Moon,Phys. Rev. Lett.25, 527 (1970).
62M. M. Qazilbash, A. A. Schafgans, K. S. Burch, S. J. Yun, B. G. Chae, B.
J. Kim, H. T. Kim, and D. N. Basov,Phys. Rev. B77, 115121 (2008).