Synthesis of Regional IOOS Build-out Plans
for the Next Decade
Prepared for the
Integrated Ocean Observing System Association
by
Holly Price and Leslie Rosenfeld
December 2012
Executive Summary
The oceans, coasts and Great Lakes are critical features of the nation, affecting our economy by providing food and recreation, sustaining complex ecosystems and species, and influencing coastal communities and marine transportation. The need for more comprehensive and higher resolution data and information about these waters has never been greater, including information on severe storm events, coastal flooding, water quality, ecosystem health and the long-term impacts of climate change. The U.S. Integrated Ocean Observing System (U.S. IOOS®) provides the framework for such a network of observations, analyses and forecasting capabilities to
preserve public safety, protect property and sustain ecosystem health.
U.S. IOOS is a federal, regional, and private-sector partnership working to enhance our ability to collect, deliver and use ocean information. The coastal component of IOOS (coastal IOOS) is a partnership among 17 federal agencies and 11 Regional Associations (RAs) that operate coastal observing systems. The RAs have primary responsibility for nonfederal observations within their respective regions, for developing and integrating these assets with the federal system and for delivering timely and effective products to meet user needs.
In 2011 the 11 RAs developed build-out plans based on the needs of stakeholders in their regions and their assessment of what is realistically achievable. This document synthesizes the 11 plans and presents the vision for full implementation, or build-out, of the IOOS regional observing systems for the oceans, coasts and Great Lakes over the next 10 years. It identifiesthe common elements to be included in the 11 regions, in concert with federal assets, by 2022. The build-out plan describes the organization of the system, identifies common products to address user needs, outlines key system assets that will be required, and recommends next steps to refine the vision. User needs
Users of coastal IOOS include a broad spectrum of federal, state and local agencies, private industry, nonprofit organizations and the public. Five main themes of uses for coastal IOOS information are:
• Marine operations, which includes shipping, fishing and recreational vessels, search and rescue, spill planning and response and offshore energy
• Coastal, beach and nearshore hazards, including extreme weather events, storm surges,
inundation and waves, as well as public safety for beach use
• Water quality, including point and nonpoint source pollution, HABs, hypoxia and
eutrophication
• Ecosystems and fisheries, including linkages between physical, chemical and biological
variables, health indices, and larval transport of fish
• Long-term change and decadal variability, including ocean acidification, shoreline and water
level changes, and shifting ecosystem conditions
Across these themes, the planning process identified key user goals or decisions that could benefit from ocean information, defined 27 key products or services that coastal IOOS could
provide to meet that need, and described the related variables that must be included. System needs
A multifaceted system of observations, models, analyses, visualizations and tactical decision aids is needed to create the 27 products outlined in the plan and meet priority user needs over the next decade. A host of different variables must be measured in the ocean, coasts, Great Lakes and atmosphere to serve as inputs to product development. There are a number of different ways to measure these variables, including in-situ sensors that make measurements within the water, and remote sensors that are deployed above the water surface and look down on it. The synthesis plan outlines needs for various platforms that can carry the equipment needed to measure, record and transmit data on these key variables and provides a typical range for the number of platforms needed per region in 10 years.
In-situ fixed platforms such as shore stations and moorings are typically used to obtain a long time series of measurements at the same location. Ten to 30 ocean or Lake shore stations, 12-45 meteorological shore stations and 5-32 multipurpose moorings are needed per region. In-situ mobile platforms are used to determine how conditions vary over space. Needs include one to four Autonomous Underwater Vehicles (AUVs), five to seven profiling gliders per region, as well as access to various ships. Needs for remote sensing platforms include 11-50 High Frequency (HF) radars per region, as well as access to various satellite sensors and airborne LiDAR.
In addition to observing platforms, all the RAs identified a variety of numerical models that are needed to infer information for places, times, and/or variables that have not been directly measured, and to forecast how the environment will change over time. Model simulations and forecasts are needed for weather, circulation, waves, inundation, water quality and ecosystems in order to meet priority user needs.
In addition to products, platforms, and models, a variety of other observing system components must also be fully implemented to carry out the vision of the 10-year build-out plan. The synthesis articulates needs and personnel requirements for user engagement, education, data management and communication, research and development and system management. These components are critical to integrating the observing system platforms and models into an effectively managed system to meet user needs.
Next steps
The synthesis of the regional build-out plans articulates the future needs for coastal IOOS and the component elements required nationally. Additional collaborations and analyses are needed to translate the synthesis into a more detailed implementable plan. This next phase of planning should define regionally applicable but nationally consistent technical and functional
requirements for completing the build-out, and define roles for the many IOOS partners. To take coastal IOOS from a series of successful pilot projects to an operational system in the next decade, expert teams of representatives of federal agencies, RAs and subject matter experts need to be assembled to answer critical design issues for the build-out. Definition is needed on
technical and functional requirements such as spatial and temporal scales, data delivery rates, operation and maintenance requirements, estimated costs, along with definition of the roles and responsibilities across the federal/RA partnership. Teams should be developed to focus on: • Modeling, including nesting of models of different scales and development of boundary
conditions, validation/certification, use of ensembles of models, coupling of oceanic and atmospheric models and physical-biological models.
• Observations, including the best mix of in-situ fixed, in-situ mobile and remote platforms and sensors to meet user needs, more objective system design techniques, and appropriate spatial and temporal scales to meet user needs.
• Biology and ecosystems, including how coastal IOOS can best address user needs in this area, integration of biological, physical and chemical data, coupling of models, and expansion of new technologies into operational use.
• Products and services, including an integrated approach to developing and/or expanding use of the 27 products for the five themes outlined in the build-out plan, building on existing products, and coordinating efforts among regions and federal partners.
Additional expert teams are also recommended to further refine and develop implementation plans for user engagement, data management and communication and research and development. The recommendations from the various expert teams for the topics above must also be assembled and assessed by an overarching group of experts tasked with incorporating these components into a comprehensive vision and plan for the next phase of coastal IOOS implementation. This process can be used to resolve issues for each component so the federal agencies and regional systems can be integrated into an overall national system for coastal IOOS.
After 10 years, the build-out of coastal IOOS will provide the country with a dramatically improved system, with each region operating a suite of platforms, sensors, and models, while also taking advantage of a range of models and remote sensing systems operated by other entities. The regions and their federal partners will develop, produce and distribute a variety of critical products, with the spatial and temporal scales and accuracy needed to support health, safety and resource management.
Acknowledgements
This synthesis is based on the regional build-out plans prepared by the 11 IOOS Regional Associations and their Boards of Directors, Principal Investigators, staff, advisors and partners. Their hard work and vision provides the basis for the information in this report. To see the regional build-out plans, please see usnfra.org.
IOOS Association staff and Board of Directors dedicated their talents, time and effort to developing the build-out plans and providing guidance to this synthesis. Special thanks to the Steering Committee: Ann Jochens, Debra Hernandez, Josh Kohut, Molly McCammon, Ru Morrison, Josie Quintrell, Harvey Seim and Suzanne Skelley. The U.S. IOOS Program Office provided financial support for a detailed comparison of the 11 plans and the preparation of this synthesis document, and provided guidance throughout the process.
Table of Contents
Executive Summary ... i
Acknowledgements ... iv
1.0 Introduction ... 1
1.1 Integrated Ocean Observing Systems and their applications ... 1
2.0 Organization of existing observing systems ... 3
2.1 A regional approach ... 3
2.2 Partnerships ... 4
2.3 Components of observing systems ... 5
3.0 Synthesis of regional build-‐out plans for observing systems ... 6
4.0 User needs over the next 10 years ... 7
4.1 Products serving multiple user needs ... 8
5.0 Marine operations ... 9
5.1 Vessels ... 9
5.2 Search and Rescue ... 11
5.3 Spill response ... 12
5.4 Offshore energy ... 13
5.5 Regional differences in information needs ... 13
5.6 Outcomes and success measures ... 14
6.0 Coastal, beach and nearshore hazards ... 14
6.1 Emergency Response and Preparedness ... 15
6.2 Regional differences in information needs ... 16
6.3 Outcomes and success measures ... 16
7.0 Water quality ... 16
7.1 Nonpoint and point source pollution ... 17
7.2 Harmful algal blooms ... 18
7.3 Hypoxia and eutrophication ... 18
7.4 Regional differences in information needs ... 18
7.5 Outcomes and success measures ... 19
8.0 Ecosystems and fisheries ... 19
8.1 Healthy and productive ecosystems and fisheries ... 19
8.2 Regional differences in information needs ... 21
8.3 Outcomes and success measures ... 21
9.0 Long-‐term change and decadal variability ... 21
9.1 Ocean Acidification ... 22
9.2 Shoreline and water level changes ... 22
9.3 Long term trends in ecosystem conditions ... 23
9.4 Regional differences in information needs ... 24
9.5 Outcomes and success measures ... 25
10.0 Product development and engagement with users ... 25
11.0 The observing / modeling system -‐ platforms and measurements ... 26
11.2 Platforms ... 27
11.2.1 Fixed platforms ... 29
11.2.2 Mobile platforms ... 32
11.2.3 Remote sensing platforms / instruments ... 35
11.2.4 Distribution of platforms ... 36
11.2.5 Key partnerships and leveraging in the system of platforms ... 36
12.0 The observing / modeling system -‐ models ... 37
12.1 Characteristics of RA modeling efforts ... 38
12.2 Common types of models ... 39
12.3 Model development ... 41
13.0 The observing/modeling system – linkages ... 42
13.1 Relationship between platforms and variables ... 42
13.2 Other factors influencing the makeup of the observing system ... 43
14.0 Typical regional system of platforms and models in build-‐out plan ... 43
15.0 Data management and communication ... 46
16.0 Education ... 47
17.0 Research and Development ... 47
18.0 System management ... 48
19.0 Next Steps ... 49
19.1 Recommendation to Establish Expert Teams ... 49
19.2 Modeling ... 50
19.3 Observations ... 51
19.4 Biology and Ecosystems ... 52
19.5 Products and services ... 53
19.6 User Engagement ... 54
19.7 Data management ... 54
19.8 Emerging Technology/ Research and Development ... 54
19.9 Complete integration ... 55
20.0 Conclusions ... 55
References ... 57
1.0 Introduction
The oceans, coasts and Great Lakes are critical features of the nation, affecting our economy by providing food and recreation, sustaining complex ecosystems and species, and influencing coastal communities and marine transportation. The need for more comprehensive and higher resolution data and information about these waters has never been greater, including information on severe storm events, coastal flooding, water quality, ecosystem health and the long-term impacts of climate change. All of these factors require an expanded network of observations, analyses and forecasting capabilities to preserve public safety, protect property and sustain ecosystem health. The U.S. Integrated Ocean Observing System (U.S. IOOS®) provides the framework for such a network.
U.S. IOOS is a federal, regional, and private-sector partnership working to enhance our ability to collect, deliver and use ocean information. It delivers the data and information needed to
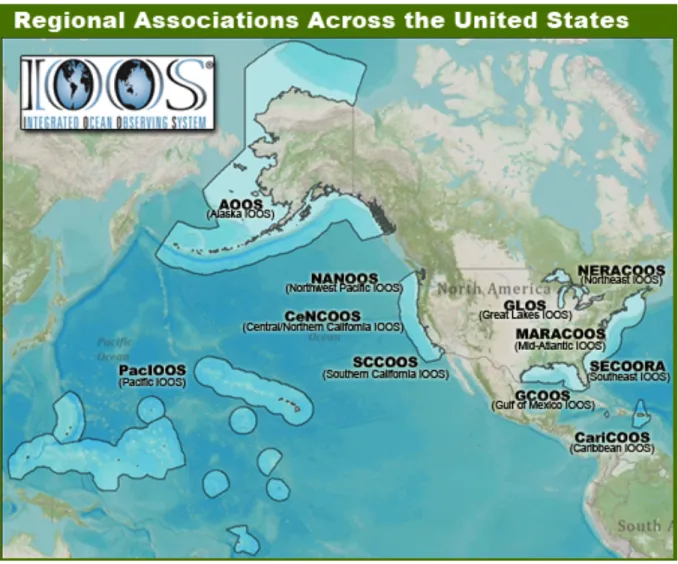
increase understanding of our oceans, coasts and Great Lakes, so decision makers can take action to improve safety, enhance the economy, and protect the environment. The National Oceanic and Atmospheric Administration (NOAA) is the lead federal agency for IOOS, which includes both a global and coastal component. The coastal component of IOOS (coastal IOOS) is a partnership among federal agencies and 11 Regional Associations (RAs) that operate coastal observing systems (Figure 1.1).
The Integrated Coastal and Ocean Observation System (ICOOS) Act authorizing the
establishment of IOOS in 2009 required the development of an Independent Cost Estimate for the IOOS program and an annual process for assessing gaps in observing assets and needs for capital improvements. To support that effort, in 2011 the 11 RAs developed build-out plans for the next decade based on the needs of stakeholders in their regions and their assessment of what is realistically achievable given the wide variability currently in regional observing assets and capacity.
This document synthesizes the 11 plans and presents the vision for full implementation, or build-out, of the IOOS regional observing systems for the oceans, coasts and Great Lakes over the next 10 years. It identifiesthe common elements to be included in the 11 regions, in concert with federal assets, by 2022. The build-out plan describes the organization of the system, identifies common products to address user needs, outlines key system assets that will be required, and recommends next steps to refine the vision. Ten years from now, the existing regional observing systems will be transformed into a sustained program of ocean observations and models that can reliably and rapidly supply the integrated information needed to plan, conserve and wisely manage our ocean, coast and Great Lakes ecosystems and resources.
1.1 Integrated Ocean Observing Systems and their applications
Information developed by coastal IOOS has widespread applications to critical issues affecting the nation’s economy, food supply, public health and safety, protection of coastal property, and the environment. Efficient and effective marine transportation, search and rescue operations, and oil spill response all rely on accurate information and predictions about ocean and weather conditions. Coastal communities need accurate predictions of storm events, erosion, and
information on contamination levels, waves, and rip currents. Sustainable fisheries depend on an understanding of the changing currents and temperatures that affect fish populations. Expanding dead zones, climate change and acidification of oceans, coasts and Great Lakes require detailed understanding of conditions to minimize impacts and inform decisions.
Figure 1.1. The 11 Regional Associations of IOOS
The increasing and sometimes conflicting uses of our coastal waters for food, transportation, energy, mineral resources and recreation require careful planning to balance economic, social and environmental concerns. Effective ecosystem-based management depends on monitoring and prediction of the physical, chemical and biological components and their relation to spatial patterns of human uses of the ocean. These and many other applications are critical uses of the information developed by coastal IOOS. Many of these applications will become even more important in future years as the impacts of global climate change affect oceanic and
meteorological conditions.
Full implementation of coastal IOOS is critically important for economic development, public health and safety, and managing marine ecosystems. Initial observing projects have
demonstrated the value of integrating and using locally specific data and nationally relevant information to support policy decisions, maintain safe operations and foster the successful management of healthy coastal ecosystems throughout the country. This ability is only
achievable through a coordinated network of regional systems linked with federal agencies, local stakeholders and regional partners.
2.0 Organization of existing observing systems
Coastal ecosystems are complex. U.S. territorial waters encompass 11 Large Marine Ecosystems (LMEs), as designated by NOAA, that range from the cold waters of the Chukchi Sea in the Arctic to the warm waters of the tropical Pacific Islands (Sherman and Hempel, 2008). The Great Lakes, with over 10,000 miles of coastline, are the world’s largest system of freshwater lakes. Although there are many common scientific and economic factors and types of ocean information users across U.S. waters, regions are also characterized by unique geological, physical and chemical properties, biological productivity and human uses. The complexities of the coastal environment and the inherent variability in regional ecology call for partnerships that not only cut across federal agencies but also reach out to regional managers, academia, industry, non-governmental organizations and the general public. The RAs of U.S. IOOS serve that function, and are essential to building and supporting the system.
2.1 A regional approach
The regional component of U.S. IOOS was created to enhance the ability of federal agencies to provide the depth or scale of information needed to solve national issues that manifest
themselves at the regional and local levels, and to benefit from the knowledge and expertise at the local and regional level. The U.S. Commission on Ocean Policy, the Pew Ocean
Commission and the Interagency Ocean Policy Task Force have endorsed a regional approach to ocean observing systems as a complement to the national and global components.
The RAs provide increased observation density at regional and local scales, expert knowledge, and technological competencies related to unique local environments, such as ice-filled seas, coral reefs, and the Great Lakes. They play a critical role in convening regional and local experts, agencies, industries and other users to understand mutual needs, evaluate priorities for ocean information, share knowledge and leverage resources to develop products addressing user needs. They also provide a forum for coordination on ocean observing among all interested parties at a regional level.
The 11 regional associations and their associated Regional Coastal Ocean Observing Systems (RCOOS) provide the regional component of U.S. IOOS and serve in the capacity of Regional Information Coordination Entities (RICEs) as described in the ICOOS Act. For brevity, these may be referred to as regional associations or RAs in the remainder of this report.
2.2 Partnerships
The regional associations are part of an integrated partnership with federal agencies. Federal partners of U.S. IOOS include 17
agencies (Table 2.1) — none of which alone has the capacity to fully
implement U.S. IOOS on a national scale, but all of whom contribute to the mission. These federal agencies are generally responsible for global and national scales of observation and analysis, and provide active support, funding, guidance, or advice to the program. The first 11 federal partners listed are also part of the Interagency Ocean Observation Committee (IOOC), and they play a direct oversight role in the development of U.S. IOOS. These federal agencies also are part of the Global Ocean Observing System (GOOS) that provides a framework for international cooperation on
observations, modeling and analyses of the interconnected nature of the world’s oceans.
The RAs have primary responsibility for nonfederal observations within their respective regions, for
developing and integrating these assets with the federal system and for delivering timely and effective products to meet user needs. Nonfederal partners in U.S. IOOS include state, local and tribal
governmental agencies, academia, industry and nongovernmental organizations who play critical roles in providing strategic guidance to system development, identifying user needs, collecting, distributing and evaluating data, and developing models and products. These collaborations with partners allow the system to achieve objectives that are too large and complex for any
component to achieve on its own.
Regions and federal agencies use the IOOS investment to leverage additional resources and thus multiply the value of the original investment. They link existing assets into a connected system, and enhance that system by adding new assets. Since much of the information made available through the IOOS regions is based on observing assets and data not funded by U.S. IOOS, regions provide access to information that was previously difficult or impossible to find.
National Oceanic and Atmospheric Administration (NOAA)
National Science Foundation (NSF) National Aeronautics and Space Administration
(NASA)
Environmental Protection Agency (EPA) Bureau of Ocean Energy Management, Regulation
and Enforcement (BOEM and BSEE) Marine Mammal Commission (MMC)
Office of Naval Research (ONR) Oceanographer of the Navy, representing the Joint Chiefs of Staff (JCS)
U.S. Army Corps of Engineers (USACE) U.S. Coast Guard (USCG) U.S. Geological Survey (USGS) Department of Agriculture, Cooperative State
Research,
Education and Extension Service (CSREES) Department of Energy (DOE)
Department of State (DOS) Department of Transportation (DOT) Food and Drug Administration (FDA) U.S Arctic Research Commission (USARC)
Effective and consistent collaboration among these various partner organizations is essential to support the planning and coordination of national IOOS development.
2.3 Components of observing systems
A regional observing system is a comprehensive operation that includes all the components necessary to collect observations and turn them into useful and meaningful information products. The 11 RAs design, operate and manage 11 regional ocean observing systems. They include the following core components that are integrated into a unified system as summarized below. Observing platforms and sensors:
• Platforms fixed in place that collect and relay data from above and/or below the water and provide detailed information on particular locations. These include shore stations on piers as well as offshore moorings that collect data on an array of meteorological and oceanographic variables.
• Mobile platforms that transit broad swaths of ocean and Great Lakes, conducting
monitoring along transit lines or responding to specific events such as upwelling or spills. These platforms, such as autonomous gliders and powered underwater vehicles, or more traditional ships, complement the point measurements collected by fixed platforms. • Remote instruments and platforms, such as high frequency radars and satellites, that
provide synoptic views of surface conditions. Models:
• Systems of mathematical equations solved on computers, used to infer information for places, times, and/or parameters that cannot be measured, and to forecast how the environment will change over time
• Observing systems use models to simulate a variety of atmospheric, ocean, or Great Lakes properties, including temperature, salinity, currents, waves, and water quality. • Regional-scale models are nested within basin and global-scale models to provide users
with higher resolution forecasts. Data management:
• Data management and integration that support seamless access to regional data • Ensures that data is archived, recorded and transmitted in ways that are consistent in
content and format with other providers of the same data Product development and engagement with users:
• Engagement with decision-makers and users to fully understand specific needs for IOOS information, the most appropriate formats and channels to receive the information, and to share knowledge to develop effective products
• Analysis that translates data into useful and meaningful information products
• Product development that integrates multiple types of measured and modeled data into higher level products
System management:
• System management to oversee operations, identify priorities and ensure routine and reliable delivery of information
3.0 Synthesis of regional build-out plans for observing systems
Over the next 10 years, the RAs propose to build on the existing system and accomplishments to develop an integrated system to address priority needs. Planning for the ten-year build-out included several key steps. First, each individual RA developed a plan identifying user needs, products and required assets for their own region. These plans were compared and common elements reviewed and refined with the RAs and U.S. IOOS Program Office staff at a workshop in Portland, Maine in November 2011. The resultant information was then synthesized and expanded into the current document identifying priority common elements across the nation as well as unique regional circumstances. A separate component consisted of the independent cost estimate of funding requirements for the ten-year plan for the entire IOOS system, including the federal agencies.
The synthesis of the build-out plans will provide important information for the National Ocean Policy Priority Objective, “Strengthen and integrate Federal and non-Federal ocean observing systems, sensors, data collection platforms, data management, and mapping capabilities into a national system and integrate that system into international observation efforts.” (National Ocean Council, 2012). Moreover, the plans will provide the detailed information and rationale to support budget requests and to enumerate the impacts of budget decisions. The plans will also assist in the development of regional gaps analysis that is required by the ICOOS Act.
A key step in this process was identification of priority user needs and the assets, services and products needed to meet those needs. Each RA conducted this evaluation separately, but coordinated their efforts to enhance comparability. The RAs, the IOOS Association (formerly National Federation of Regional Associations (NFRA)) and the U.S. IOOS Program Office developed templates that provided a consistent structure for the plans in advance. User needs, and products and services to meet those needs, were evaluated via a variety of mechanisms, including multiple years of interactions with regional users, stakeholder advisory panels, workshops targeted on specific issues and user surveys. Plans considered the variables, platforms, sensors, models, data management and product development required to meet user needs and to transform components into an effective integrated observing system. Federal assets are not enumerated in the regional plans, although data from them is, and will continue to be, incorporated into RA products.
The 11 regional plans were then analyzed to identify priority categories of user needs and products, and to identify the assets needed to meet those needs. The approach identifies the
many priority elements that the RAs have in common, while recognizing that unique attributes of each region also require attention to additional custom products and services. In addition to laying out a vision for a fully operational system in 10 years, the comparison and synthesis can facilitate synergism among the RA efforts to develop products while preserving unique regional qualities.
The sections below describe the basic
components of the build-out plans developed by the regions, including user needs and products and the assets required to meet those needs. Regional systems depend on federal observations and strong partnerships with federal agencies, supplemented by assets from state and local governments, the private sector and academics, to deliver products and
services. The synthesis of the regional build-out plans provides a basis for discussion with these partners to refine technical and functional requirements, identify appropriate leads and
complementary roles for meeting user and system needs in the next phase of coastal IOOS.
4.0 User needs over the next 10 years
Users of coastal IOOS include a broad spectrum of federal, state and local agencies, private industry, nonprofit organizations and the public. Users include mariners who need access to the latest sea state conditions, fishermen who are planning their days at sea, resource managers who need definitive ecological trends and risk factors; federal agency personnel who need data for modeling and prediction; emergency managers who need forecasts and predictions to protect public health and safety; and the general public who want to plan for coastal activities, recreation and tourism.
Five main themes of uses for coastal IOOS information are a) marine operations, b) coastal, beach and nearshore hazards, c) water quality, d) ecosystems and fisheries and e) long-term change and decadal variability. These broad themes and the specific user needs associated with them were defined through many years of interactions of the RAs with users in their regions and nationwide. User needs and required products and services were assessed over the years through a variety of means, including targeted user workshops, stakeholder advisory committees,
surveys, and ongoing one-on-one interactions with users.
For each of the key themes in the subsections below, the users' goals and/or decisions that could benefit from ocean information are identified, along with the type of information needed, and the product or service that U.S. IOOS and its partners could provide to meet that need. The user needs and common products and services that will be provided in all the regions after a 10-year implementation period are summarized in the tables below.
Assumptions of the planning process •Plan represents a joint vision of common
needs among regions
•Many partners will be involved in the build-out over the next 10 years
•Additional discussions with partners and expert teams will be needed to refine technical and functional requirements, determine appropriate leads, etc.
•Existing federal observing assets will be sustained at current operating levels •Individual regions will have additional
unique product needs and asset requirements beyond the common elements identified here •The build out plans represent what the RAs
The RAs may not necessarily be the lead in developing and delivering all the products summarized in this document. This document defines the needs of the users and outlines the products and observing system assets that are required to meet those needs. An estimate of the associated costs is being developed concurrently in a separate document. A next step in the planning process will require discussions with federal and state agencies, academia, industry and other partners on how to best coordinate activities, leverage resources and develop
implementation plans refining the technical and functional requirements for fulfilling these needs.
4.1 Products serving multiple user needs
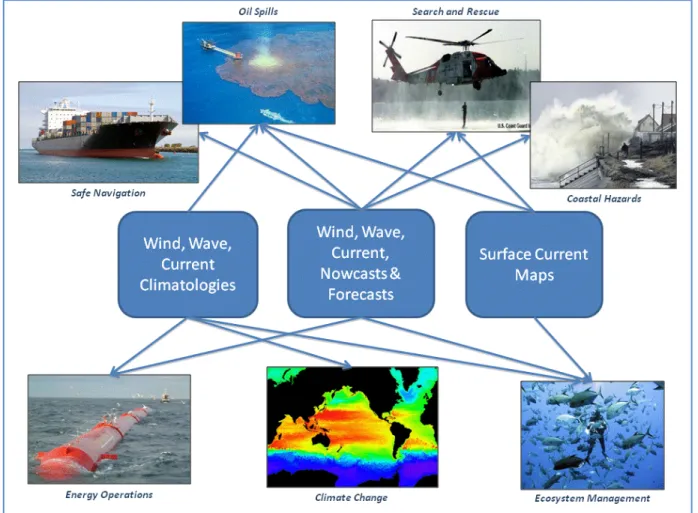
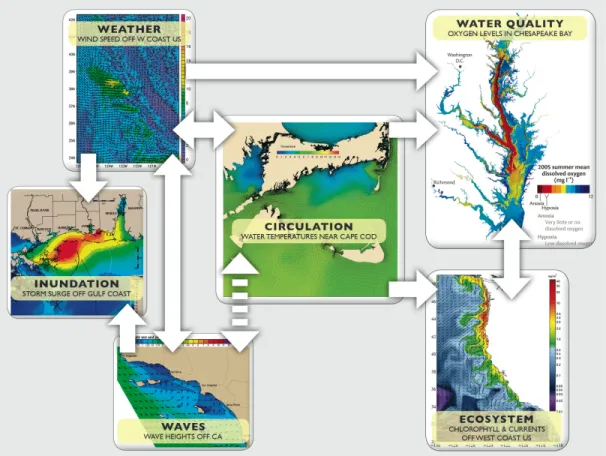
IOOS provides historical and real-time data and predictions for a variety of key variables, which can then be customized and packaged into the diverse set of products required by an array of users. The descriptions in Sections 5-8 below describe 27 common products organized by broad themes and targeted to specific user groups, such as the shipping industry, coastal emergency response managers, etc. However, the underlying data sources and model outputs for a number of these products are similar (Fig. 4.1). The ability to use core data sources and model outputs as a basis for multiple targeted products greatly improves the efficiency and cost-effectiveness of the IOOS system.
For example, wind, wave and current nowcasts1 and forecasts are critical products required by the shipping industry for safe navigation, federal and state agencies for oil spill response, the U. S. Coast Guard (USCG) for offshore search and rescue, coastal communities preparing for storm surges, and industry and agencies to evaluate offshore energy operations. Scientists and managers also use them to enhance ecosystem management through understanding of biological distributions and the connectivity between habitats. Other critical basic products such as long-term climatologies (historical average conditions), of wind, wave and currents, and real-time maps of surface currents also help meet the needs of a variety of users. However, various refinements are often necessary in spatial and temporal scale, timing of information delivery, formatting, packaging and distribution of the products to meet the targeted needs of specific types of users.
5.0 Marine operations
Commercial and recreational boating safety, efficient shipping and cruising, informed and efficient offshore renewable energy production, effective rescue operations and spill responses are key aspects of maritime operations. These operations impact human health and the economic vitality of the country. For example, more than 95% of U.S. overseas trade occurs by ship, providing bulk transport of raw materials and import/export of affordable food and manufactured goods.
Commercial and recreational mariners, as well as the USCG require information on sea, Great Lakes, and marine weather conditions. RAs have provided real-time conditions on websites and via NOAA weather radio and other information portals, as well as model solutions that
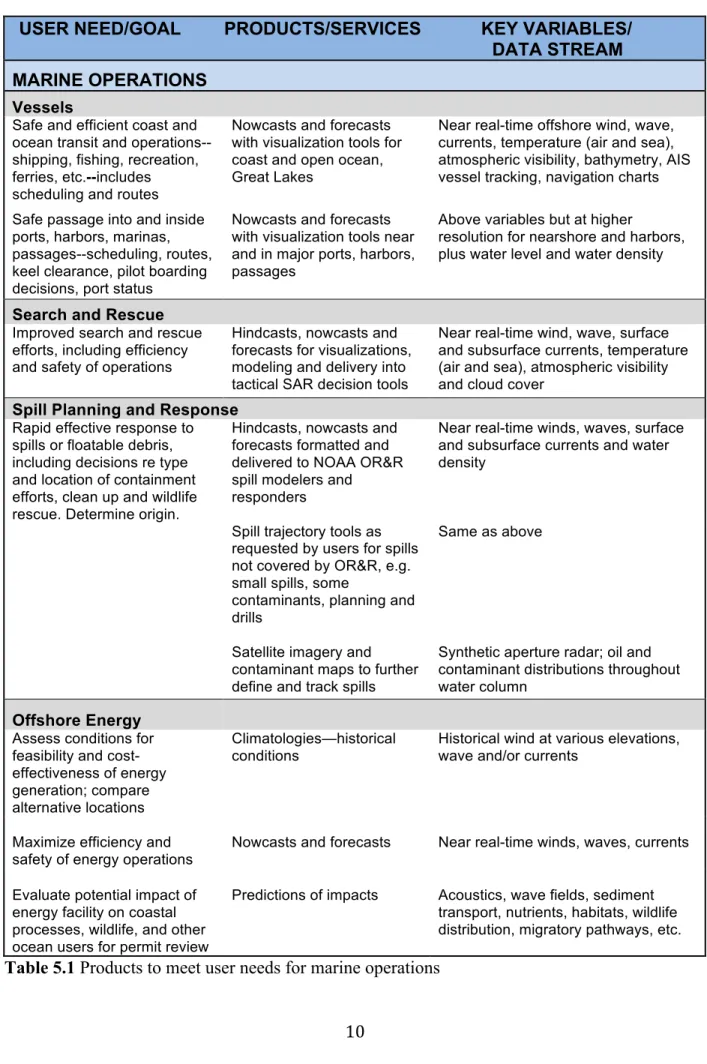
interpolate conditions between observations and forecast changes over time, to provide users with information exactly where and when they need it. Observations and modeling from the RAs can be used to supplement the coverage and enhance the resolution of NOAA’s Physical Oceanographic Real-time System (PORTS®). Over the coming 10 years, the RAs will expand and deliver a suite of targeted products and services for marine operations, in coordination with federal partners (Table 5.1).
5.1 Vessels
Safe and efficient coast and ocean transit and operations is a key aspect for commercial shipping operations, fishing, recreational boaters, as well as for public transportation such as ferries and cruise ships. The safe and efficient operation of commercial shipping and fishing, and
recreational boating and fishing requires that mariners have access to reliable, accurate real-time observations of weather and ocean conditions through a variety of communication technologies including the internet, cell phones, and radio. Accurate, real-time information on ocean and weather conditions across broad regions can help meet this goal by informing decisions such as scheduling of operations or choice of optimal routes to take advantage of preferred conditions or avoid dangerous ones.
IOOS observations of present conditions and models are used to develop key products such as nowcasts and forecasts for the oceans, coasts and Great Lakes describing winds, waves, currents,
USER NEED/GOAL PRODUCTS/SERVICES KEY VARIABLES/ DATA STREAM MARINE OPERATIONS
Vessels
Safe and efficient coast and ocean transit and operations--shipping, fishing, recreation, ferries, etc.--includes scheduling and routes
Nowcasts and forecasts with visualization tools for coast and open ocean, Great Lakes
Near real-time offshore wind, wave, currents, temperature (air and sea), atmospheric visibility, bathymetry, AIS vessel tracking, navigation charts
Safe passage into and inside ports, harbors, marinas, passages--scheduling, routes, keel clearance, pilot boarding decisions, port status
Nowcasts and forecasts with visualization tools near and in major ports, harbors, passages
Above variables but at higher
resolution for nearshore and harbors, plus water level and water density
Search and Rescue
Improved search and rescue efforts, including efficiency and safety of operations
Hindcasts, nowcasts and forecasts for visualizations, modeling and delivery into tactical SAR decision tools
Near real-time wind, wave, surface and subsurface currents, temperature (air and sea), atmospheric visibility and cloud cover
Spill Planning and Response
Rapid effective response to spills or floatable debris, including decisions re type and location of containment efforts, clean up and wildlife rescue. Determine origin.
Hindcasts, nowcasts and forecasts formatted and delivered to NOAA OR&R spill modelers and
responders
Near real-time winds, waves, surface and subsurface currents and water density
Spill trajectory tools as requested by users for spills not covered by OR&R, e.g. small spills, some
contaminants, planning and drills
Same as above
Satellite imagery and contaminant maps to further define and track spills
Synthetic aperture radar; oil and contaminant distributions throughout water column
Offshore Energy
Assess conditions for feasibility and cost-effectiveness of energy generation; compare alternative locations
Climatologies—historical conditions
Historical wind at various elevations, wave and/or currents
Maximize efficiency and safety of energy operations
Nowcasts and forecasts Near real-time winds, waves, currents
Evaluate potential impact of energy facility on coastal processes, wildlife, and other ocean users for permit review
Predictions of impacts Acoustics, wave fields, sediment transport, nutrients, habitats, wildlife distribution, migratory pathways, etc.
temperature and visibility. These must be supplemented by visualization tools combining observations and forecasts with bathymetry, navigation charts and Automatic Identification System (AIS) tracking of vessels.
Such information is also important for safe passage as vessels prepare to enter or transit constrained regions such as ports, harbors, marinas or narrow passages. Ocean and weather information at these small spatial scales is needed to inform decisions about optimal scheduling, keel clearance and loads, pilot boarding and port status designations. Information needed in and near these regions includes high-resolution bathymetry and real-time observations and models of waves, surface and subsurface currents, winds, visibility, water level, and water density.
Information should be available through a variety of communication technologies including Internet, cell phone, and radio. Output and distribution of data and models should be packaged to take full advantage of existing information channels already utilized by mariners, to streamline access and promote broad use. Specific distribution channels may evolve over time, but
currently include PORTS, e-Navigation, AIS and Portable Pilot Units. Key regional partners in product evaluation, packaging and distribution include the USCG, NOAA, port safety forums, tug and pilot associations, port and harbor authorities, state marine trade associations, and commercial and recreational fishing organizations.
5.2 Search and Rescue
The USCG conducts searches for lost, missing, or distressed vessels and persons in the coastal oceans and Great Lakes. Search and rescue and minimizing the loss of life, injury and property damage by rendering aid to the distressed in the maritime environment have always been a Coast Guard priority.
For effective and timely search and rescue operations, the USCG requires specific information on winds, currents, and a host of other variables. The USCG uses a Decision Support Tool (DST) known as the Search and Rescue Optimal Planning System (SAROPS) for planning search and rescue operations. SAROPS uses a sophisticated animated grid model to project how floating persons or objects might move, and to determine the location and size of a search area. The IOOS RAs provide critical environmental data to SAROPS. The USCG estimates that search areas can be reduced by as much as two-thirds over a 96-hour period if the SAROPS system is linked to surface current data and forecasts of currents, thereby leading to greater number of lives saved and significantly reducing search costs (U.S. IOOS Program, 2011a). In addition to providing data directly to SAROPS, the RAs also support search and rescue via other modes and products when state and local groups mount efforts in situations where the USCG is not available.
Key IOOS products needed for search and rescue are hindcasts, nowcasts and forecasts of winds, waves, surface and subsurface currents, temperature, visibility and cloud cover. Information on these variables should be packaged for direct visualizations, modeling and delivery into tactical DSTs such as SAROPS. Surface currents, as measured by high frequency (HF) radars are a key
component of IOOS information delivered into SAROPS. The 10-year plan envisions building on the successful use of this variable by providing more complex operational numerical ocean models that incorporate ocean circulation, waves, and winds into SAR decisions.
5.3 Spill response
Spills of oil, hazardous materials and debris have the potential to cause widespread ecological damage and broad economic impacts, and threaten human health. Spill response personnel (including from federal, state, and local agencies) require up-to-date and reliable information and forecasts that will allow rapid response to minimize adverse effects and assist in monitoring spill impact. Effective response involves decisions regarding type and location of containment efforts, cleanup and wildlife rescue. Evaluations may also be needed to determine where the spill, tar balls, or debris originated, to assist with diagnosis and containment. Archived information that can describe historical background and ambient conditions is important for damage assessment to determine the extent of impacts.
Key regional partners in spill response include NOAA’s Office of Response and Restoration (OR&R), the USCG, the EPA and state environmental protection agencies. These managers need information on spill location, size and extent in three dimensions (surface and subsurface), direction and speed of oil or other spill movement, and predictions of drift and dispersion to limit the damage by a spill and facilitate cleanup efforts. IOOS products to assist in meeting these needs include hindcasts, nowcasts and forecasts of winds, waves, currents and water density. In the Gulf of Mexico Deepwater Horizon oil spill, IOOS and its partners were able to deploy underwater gliders to the Gulf to assist with subsurface monitoring and provided model and HF radar information to the response teams.
IOOS will need to work with partners to ensure appropriate packaging and delivery mechanisms for these basic products dependent on the type and extent of the spill. During major oil spills, the USCG serves as the Federal On Scene Coordinator for spill response, NOAA is designated to provide the Scientific Support Coordinator (SSC) and NOAA’s OR&R staffs the SSCs with oceanographers, modelers, chemists, and biologists available 24 hours a day. During an oil spill, the primary Decision Support Tool for evaluating potential trajectories is currently the General NOAA Oil Modeling Environment (GNOME), although other models are under development. GNOME forecasts spill trajectories based upon the best wind and ocean circulation forecasts available at the time of the response. For major spills, RA data should be formatted and delivered for use by OR&R modelers.
However, not all spills are addressed by OR&R, and other users and distribution pathways are needed for some spills. For example, NOAA does not officially respond to oil spills until formally requested by the USCG. Therefore, the GNOME model as implemented by NOAA is generally not used in small oil spills, oil spill drills, or in pre-staging equipment in advance of an oil spill. Visualizations of currents, and spill trajectory models are needed for application to these types of cases, and for spills of contaminants other than oil.
Additional imagery and maps are needed beyond this basic set of inputs and models. Satellite imagery can assist in further defining the location and extent of the spill, although operational
use during spill response may be limited by low spatial resolution, slow revisit times and delays in receiving processed images. Subsurface oil distributions and other water quality
measurements are also needed to fully understand and track spills and their impacts.
5.4 Offshore energy
Exploration for offshore energy has accelerated in recent years, and may be a primary source of energy for the nation for many decades. The term offshore energy is used here to describe all forms of energy derived from the sea including oil and gas, as well as marine renewable energy sources such waves, tides, currents, and winds.
A wide range of information is needed to support wise ocean energy development, and the information must be available to diverse agencies and public and private groups involved in decision-making. These include various federal agencies such as the BOEM, Federal Energy Regulatory Commission (FERC), USACE, NOAA and U.S. Fish and Wildlife Service (USFW), energy developers, and state energy, coastal zone and environmental managers. U.S. IOOS products on past patterns of wind, wave and current conditions are needed to evaluate the
feasibility and cost-effectiveness of various forms of energy facilities and to compare alternative locations. Maps and monitoring of acoustics, wave fields, sediment transport, nutrients, habitats, wildlife distribution and migratory pathways are needed to evaluate the potential impact of proposed energy facilities on coastal processes, marine life, and other ocean users for planning and permit processes. Once facilities are approved, built, and operating, real-time information and forecasts of wind, wave and current conditions are needed to maximize efficiency and safety of energy operations.
5.5 Regional differences in information needs
Although there are many common elements of ocean information needed to support marine operations, there are also additional elements unique to individual regions. Marine operations in regions may vary due to differences in climate, geography, population sizes and industrial uses. For example, a key issue for the Alaska Ocean Observing System (AOOS) is the need to provide vessels information on current conditions and forecasts for floating ice. As Arctic sea ice
retreats, and northern oceanic passages stay open for longer periods, more vessels are passing through Alaska waters. These vessels take shipments to international destinations, as well as supporting increased economic development in western and northern Alaska and recreational tours of the Arctic. Highly mobile broken ice continues to be problematic especially for vessels in transit. AOOS will explore using ice radars, bottom mounted ice thickness sonars and
numerical modeling to develop a sea ice trajectory nowcast/forecast as an aid to vessels working in the Arctic.
An example of how geographic differences can lead to additional priorities is evident when examining marine operations in PacIOOS, a region of small islands separated from the
continents by vast stretches of open ocean. A priority under such conditions is development of an optimal ship routing tool that can evaluate how current, wave and wind conditions affect vessel speed, fuel efficiency and safety over long open ocean transits.
Even within a category such as offshore energy, there are significant regional differences in the target audiences for needed products. Wind energy is the primary new offshore energy source under development on the east coast, while western states are primarily evaluating the potential of offshore wave energy, and oil and gas remains the predominant focus of development for the Gulf of Mexico and Alaska. These and many other examples mean that each RA will have individual priorities and necessary product refinements that will extend beyond the common set identified throughout the country.
5.6 Outcomes and success measures
Full implementation of the build-out plan to routinely provide the above products across the 11 regions will result in a range of successful outcomes impacting the nation’s economy,
environment and public safety, as outlined below.
• Shipping incidents and time spent waiting to enter harbors will be reduced through improved decisions drawing on U.S. IOOSdata. The cost for holding large cargo ships offshore in California is estimated to be between $100,000-$200,000/day/ship.
• The size of the Coast Guard’s search area and the response time for rescues will be reduced, resulting in fewer lives lost at sea.
• The efficiency and accuracy of responding to oil spills will be increased by accessing real-time and forecast information on currents and other environmental factors.
• Recreational boaters and commercial fishermen will have information on local sea and weather conditions needed to plan safe trips.
• Energy siting and operations will be more efficient and environmentally sound due to incorporation of subsurface information from IOOS.
6.0 Coastal, beach and nearshore hazards
Coastal communities face a variety of physical hazards that threaten lives and property, resulting from natural cycles on a monthly or seasonal basis and from episodic events such as tsunamis, tropical storms, hurricanes or other extreme weather events. Susceptibility to these hazards is further increased by changing climatic and geological conditions, such as sea level rise, more frequent storms, loss of sea ice and land subsidence or uplift. In addition, dangerous beach conditions such as high waves, rip currents and contamination can impact public safety and coastal tourism activities such as beach visits, surfing, and kayaking. Natural hazards can have devastating impacts on people and property, and may also have deleterious effects on the environment, particularly sensitive habitats.
It is therefore critical to numerous groups (coastal residents, state, federal and local emergency managers and planners, scientists, etc.) in the regions to be able to predict, understand, and manage/mitigate coastal hazards. U.S. IOOS RAs and federal agencies provide information needed to develop products regarding hazards, such as the National Weather Service (NWS)
integrated meteorological observations, and the USACE wave and inundation models. The majority of regional plans include providing essential observations to decision-makers on environmental conditions for both systemic, long-term events such as sea level rise as well as episodic events such as seasonal storm events, flooding, and coastal erosion (Table 6.1).
6.1 Emergency Response and Preparedness
When faced with imminent threats, communities need timely hazard and disaster information at high resolution to inform emergency planning and response to save lives and protect property. Information needs include near real-time conditions and improved forecasts of extreme weather, storm surge, flooding and erosion events, including water level and wave observations, and inundation and wave forecasts. High-resolution maps of the shoreline and nearshore topography are also needed as a base for overlaying forecasts and detailed planning responses.
Over longer multi-year time scales, enhancing preparedness for future emergency response requires improved understanding of the frequency and intensity of extreme weather events and their impacts on shorelines. This requires climatologies and multiyear simulations and forecasts for the variables identified above.
For enhancement of public safety and improved planning of beach and coastal recreational activities, information on beach conditions such as rip currents, waves, presence of jellyfish or Harmful Algal Blooms (HABs), pathogens and water quality including levels of fecal indicator
USER NEED/GOAL PRODUCTS/SERVICES KEY VARIABLES/ DATA STREAM COASTAL, BEACH and NEARSHORE HAZARDS
Emergency Response and Preparedness
Timely and high resolution hazard and disaster information to coastal
communities to protect public and infrastructure
Nowcasts and forecasts of extreme weather, high water, storm surges and erosion events, inundation and waves
Accurate shoreline maps, nearshore bathymetry, near real-time water level, waves, winds, barometric pressure, precipitation
Long-term planning for future responses
Climatologies and long-term forecasts of frequency and intensity of extreme weather, high water, storm surges, erosion events, inundation and waves
Historical data on above variables
Enhance public safety and use of beaches
Beach conditions alerts Rip currents, waves, presence of jellyfish or HABs, water quality including fecal bacteria indicators
bacteria (FIB), is needed. This information can be provided directly to relevant agencies and via a web portal or an alert system that can inform coastal residents, tourists and businesses who are making decisions regarding the timing and location of beach visits and nearshore activities such as surfing, kayaking, and whale watching. Observing system information could be packaged for selected beaches as well as for advisories, alerts and warnings for specific conditions posted by state and local authorities, ranking of hazard levels, beach closures, etc. This information can enhance public safety and the tourist economy by guiding behavior at a site or directing the public to alternative safe locations and times.
6.2 Regional differences in information needs
Types of hazards and needed products have many common elements throughout the country but also unique regional differences. For example, the Gulf of Mexico, the Caribbean and the southeastern U.S. experience more frequent and more intense hurricanes than other regions of the country. Substantial improvements in the NWS forecasts of storm intensity, track, and timing of passage are necessary for timely evacuations of communities and offshore facilities in the path of the storm, while avoiding evacuations that are unnecessary. Long-term plans for these regions include close coordination of data products with the needs of hurricane modelers, including providing information on ocean heat content via air-deployed sensors during hurricane approach and passage, and autonomous underwater vehicles to monitor the water column. With the rapid loss of sea ice, Arctic weather and ocean conditions are increasingly endangering Alaska Native coastal communities. In a statewide assessment, flooding and erosion affects 184 out of 213 Native villages (GAO, 2003). This presents unique challenges in forecasting and effectively communicating conditions for small communities in isolated locations. These and many other types of regional differences must be considered when tailoring and refining common information needs.
6.3 Outcomes and success measures
• Reduction in risks to lives and property from extreme coastal storms and long-term water level changes because of improved forecasts and predictions on the regional scale. Increased access to actual observations is key to increasing accuracy of forecast models. • The accuracy and resolution of forecast models will be increased through the adoption of
new technologies and techniques that have been first tested at the regional level.
• Ready access to beach conditions will result in improvements in public health and safety due to better planning of beach visits. Coastal residents/visitors and tourism operation businesses will benefit from improved information affecting preferred scheduling and location of beach and nearshore activities.
7.0 Water quality
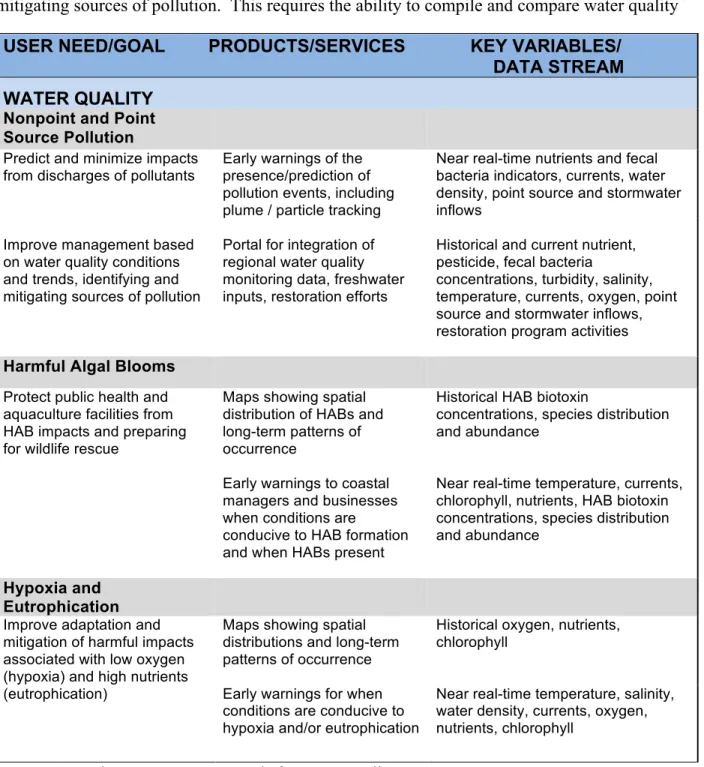
Pollutants, pathogens and harmful algal blooms threaten public beaches, shellfish stocks and public water supplies. IOOS can provide information to assist with prediction and tracking of pollution events and HABs and increase understanding and management of long-term water quality trends (Table 7.1).
7.1 Nonpoint and point source pollution
For short-term management of water quality, decision-makers aim to predict and minimize impacts from discharges of pollutants. Coastal observing systems can provide early indicators of the presence of pollution events such as sewage discharges, increased sediment loads or high nitrate levels. Tracking plumes or particles and predicting which locations will be most impacted can allow advance warnings for such events. Over longer time periods, managers strive to improve management based on water quality conditions and trends by identifying and mitigating sources of pollution. This requires the ability to compile and compare water quality
USER NEED/GOAL PRODUCTS/SERVICES KEY VARIABLES/ DATA STREAM WATER QUALITY
Nonpoint and Point Source Pollution
Predict and minimize impacts from discharges of pollutants
Early warnings of the presence/prediction of pollution events, including plume / particle tracking
Near real-time nutrients and fecal bacteria indicators, currents, water density, point source and stormwater inflows
Improve management based on water quality conditions and trends, identifying and mitigating sources of pollution
Portal for integration of regional water quality monitoring data, freshwater inputs, restoration efforts
Historical and current nutrient, pesticide, fecal bacteria
concentrations, turbidity, salinity, temperature, currents, oxygen, point source and stormwater inflows, restoration program activities
Harmful Algal Blooms
Protect public health and aquaculture facilities from HAB impacts and preparing for wildlife rescue
Maps showing spatial distribution of HABs and long-term patterns of occurrence
Early warnings to coastal managers and businesses when conditions are
conducive to HAB formation and when HABs present
Historical HAB biotoxin
concentrations, species distribution and abundance
Near real-time temperature, currents, chlorophyll, nutrients, HAB biotoxin concentrations, species distribution and abundance
Hypoxia and Eutrophication
Improve adaptation and mitigation of harmful impacts associated with low oxygen (hypoxia) and high nutrients (eutrophication)
Maps showing spatial distributions and long-term patterns of occurrence
Historical oxygen, nutrients, chlorophyll
Early warnings for when conditions are conducive to hypoxia and/or eutrophication
Near real-time temperature, salinity, water density, currents, oxygen, nutrients, chlorophyll
and related information from a variety of sources. The RAs can host integrated portals for regional water quality monitoring data, freshwater inputs that affect the volume and distribution of contaminants, and restoration program efforts that strive to improve water quality.
7.2 Harmful algal blooms
Harmful algal blooms (HABs) are concentrated, rapid growths of a variety of algal species that produce toxins or other negative human health, ecological and economic impacts. HAB events include paralytic shellfish poisoning from dinoflagellates and saxitoxins, amnesiac shellfish poisoning from diatoms and domoic acid, and diarrhetic shellfish poisoning from dinoflagellates and okadaic acid. During toxic HAB events, feeding shellfish accumulate the toxins, becoming a public health threat to consumers and disrupting the operation of aquaculture facilities. Toxic HAB events have also led to widespread mortality in marine mammals and seabirds. A variety of non-toxic HABs also occur which can discolor recreational waters, clog fish gills and deplete oxygen in the water column. Coastal managers and businesses face decisions about how to best protect public health, minimize impacts to aquaculture facilities and prepare for wildlife rescue. Timely information is needed from ocean observing systems regarding when HABs are present and when conditions are conducive to HAB formation. These early indicators will allow time to take action to minimize harm. Maps showing the spatial distribution of HABs and historical patterns of occurrence are also needed to enhance prediction and mitigation of impacts.
7.3 Hypoxia and eutrophication
Hypoxia (low oxygen concentration) has been reported with increasing frequency in many coastal areas in recent years, including the appearance of “dead zones” that result in widespread die-offs of fish and shellfish and significant impacts to tourism and the economy. Hypoxia can be initiated by excess nutrient loading from fertilizers and sewage, followed by algal blooms and decomposition (eutrophication), and the subsequent depletion of dissolved oxygen in the water, as in the Gulf of Mexico and the Chesapeake Bay dead zones. Hypoxia can also be driven by more complex factors including changing current patterns that move low oxygen waters into new regions, as occurs in dead zones off Oregon and Washington, or overall warming that reduces seawater’s ability to absorb oxygen. In addition to increased nutrient loading from urban and agricultural inputs and atmospheric deposition, eutrophication can also be impacted by natural factors such as depositional environments and mineral weathering. Similar to the situation with HABs, timely indicators and early warnings of the presence of hypoxia and eutrophication are needed. These early warnings could be based on the development of forecasting capabilities that predict the formation, extent, duration and severity of the events. Maps showing the spatial distribution of nutrient and oxygen concentrations and historical patterns of events are also needed to enhance understanding and mitigate impacts.
7.4 Regional differences in information needs
Water quality issues also exhibit a variety of regionally unique differences. For example, water quality contamination in the Great Lakes is not only an issue for wildlife, but also for 40 million consumers of public drinking water in the region. To address this concern, GLOS will provide a decision support tool to track the movement of drinking water contaminants, and will provide
model output that helps county officials manage drinking water intake systems to avoid contamination.
Tracking of water quality plumes and impacts also has unique challenges in the Gulf of Mexico. Drainage from urban development, industries and farmland comes into the Gulf from the
enormous Mississippi River watershed, covering 1,245,000 square miles and 41% of the 48 contiguous states of the U.S. This drainage leads to hypoxic conditions (low dissolved oxygen content) in summertime over the Texas-Louisiana shelf waters, and delivers large loads of sediment and associated pollutants to nearshore environments such as recreational waters and shellfish beds. Informed management decisions require a broad distribution of platforms,
sensors and derived products to track this plume and its impacts through estuaries, nearshore and offshore habitats.
7.5 Outcomes and success measures
• Fewer illnesses from exposure to contaminants in coastal waters and the Great Lakes • Reduction in financial loss to the shellfish and aquaculture industries from HAB
outbreaks because early warnings allow the industry to take precautionary measures, and managers to narrow the window of harvest closures
• Improved understanding and management of pollution sources
8.0 Ecosystems and fisheries
The nation's coastal waters support a rich and diverse ecosystem and are home to numerous fisheries, as well as abundant populations of seabirds and marine mammals. Many economically important fisheries are now declining due to loss of spawning grounds and other habitats, fishing pressure and changes in water temperature and chemistry.
Conflicts exist between threatened and endangered species, and development and extractive industries over critical marine habitats. The health of ecosystems has direct social and economic implications that are likely to be more profound as the effects of climate change are manifested by large-scale ecosystem adjustments. In addition, as human activities increase, management challenges increase and will require new sources of information and decision support tools.
8.1 Healthy and productive ecosystems and fisheries
The complex nature of coastal ecosystems and the wide array of natural and anthropogenic stressors emphasize the need for critical information. Federal, state and local managers strive for improved understanding, use, management and conservation of coastal, marine and Great Lakes ecosystems. Their efforts aim to restore and protect healthy ecosystems and sustainable
fisheries, and the cultures and economies that depend on them.
Information needs to support ecosystem-based approaches to management are beyond the capabilities of any one organization, yet such approaches are necessary to maintain the region’s ecosystem services. The ecosystem approach requires coordination and cooperation among multiple regional institutions. An organized research-observing-modeling framework is
necessary to assess and forecast the state of the ecosystem and its constituent habitats and living marine resources. The RAs can play an important coordinating role and fill observational and modeling gaps in the scientific support framework for the ecosystem-based approaches to management by providing subsurface information over time. IOOS can provide the driving physical information for marine ecosystems such as changes in temperature, salinity, currents and nutrients so that managers can understand the affects on living marine resources. Many RAs are already collaborating with fisheries and other marine managers to provide this critical
information.
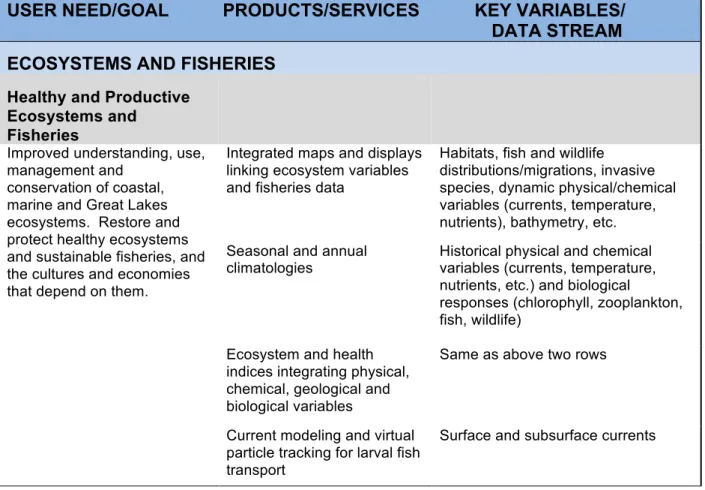
A variety of coastal IOOS products are needed to help decision-makers and scientists achieve these goals (Table 8.1). IOOS information can support regional ecosystem and health indices that are needed to integrate biological, chemical, physical and geological conditions and provide tools for managers to evaluate and refine management strategies. It can also provide input to NOAA’s Integrated Ecosystem Assessment. Integrated maps and displays are also needed linking habitats, wildlife distributions/migrations and invasive species with physical
oceanographic properties. Spatial analyses of existing and proposed ocean uses must be included to support regional planning.
USER NEED/GOAL PRODUCTS/SERVICES KEY VARIABLES/ DATA STREAM ECOSYSTEMS AND FISHERIES
Healthy and Productive Ecosystems and
Fisheries
Improved understanding, use, management and
conservation of coastal, marine and Great Lakes ecosystems. Restore and protect healthy ecosystems and sustainable fisheries, and the cultures and economies that depend on them.
Integrated maps and displays linking ecosystem variables and fisheries data
Habitats, fish and wildlife
distributions/migrations, invasive species, dynamic physical/chemical variables (currents, temperature, nutrients), bathymetry, etc. Seasonal and annual
climatologies
Historical physical and chemical variables (currents, temperature, nutrients, etc.) and biological
responses (chlorophyll, zooplankton, fish, wildlife)
Ecosystem and health indices integrating physical, chemical, geological and biological variables
Same as above two rows
Current modeling and virtual particle tracking for larval fish transport
Surface and subsurface currents
Table 8.1 Products to meet user needs for ecosystems and fisheries
In addition, seasonal and annual climatologies are needed displaying patterns over time of key ocean conditions and biological responses. For example, this information can be used to determine important physical factors that influence biomass of fisheries stocks. Mapping and