Ownership Concentration and Firm Performance: Evidence from
Pakistan
Imran Abbas Jadoon 1, Norkhairul Hafiz Bajuri1
1. Faculty of Management and Human Resource Development, University Technology Malaysia, 81310 Skudai, Johar, Darul Ta’zim, Malaysia.
Abstract
The current study aims to investigate the relationship between ownership concentration and firm performance. The study conducted the analysis on 262 non-financial listed firms on the Karachi stock exchange (KSE) for a time period of six years (2006-2011). The ownership concentration was measured through the percentage of shareholding by largest shareholder, five largest shareholders and ten largest shareholders, whereas firm performance was measured through market base performance parameters (Tobin’s Q) and accounting base performance parameter (ROA and ROE). The study employed multiple regression models to examine the relationship between ownership concentration and firm performance. The results revealed that ownership concentration has positive impact on firm performance for both accounting and market base performance parameters. The understanding of relationship dynamics of ownership concentration and firm performance helps investors and policy makers to better utilize the corporate governance internal control mechanisms for achieving the firm’s value maximization objective.
Key Words: Ownership Concentration, Firm Performance, and Emerging Markets. 1 Introduction
The relationship between ownership structure and firm performance has received significant consideration in finance literature. The concentration of ownership is considered as the tool for aligning the CEO self-intrinsic behavior to reduce the agency conflict and achieve value maximization objective of the firms. Several researchers in the last two decades have focused on the relationship between ownership concentration and firm performance to investigate whether the concentration of ownership is successful in achieving value maximum objective which yielded inconclusive result (Wang & Shailer, 2015). Although ownership concentration is considered as effective governance factor that limits managerial opportunism (Makhija, 2004) because the large and undiversified shareholders have both the incentives and the means to restrain the self-serving behaviour of managers (Zeckhauser & Pound, 1990). Furthermore, they also have legal rights to appoint well-qualified executives and/or dismiss managers involved in self-serving behavior. But studies did not provide empirical evidence on the relationship between corporate ownership patterns and firm’s performance around the world (see La Porta et al, 2000, for comprehensive survey).
1.1 Corporate Governance in Pakistan
The code of corporate governance was originally drafted by the Institute of Chartered Accountants of Pakistan (ICAP) in 1998 which was promulgated with some amendments by the Securities and Exchange Commission of Pakistan (SECP) in 2002. There are two regulatory bodies that are currently overseeing the corporate governance in Pakistan namely: the SECP and the State Bank of Pakistan (SBP). The SECP started its operations on 1st January, 1999 and its prime objective was to regulate the capital market, corporate sector and non-banking financial sector of Pakistan, whereas SBP is concerned with the implementation of corporate governance in the banking sector of Pakistan.
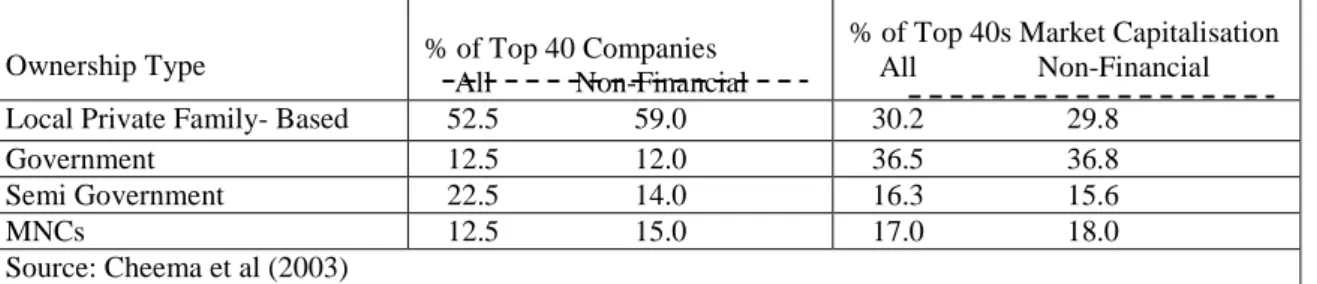
The SECP’s has made the compliance with a corporate governance code as the listing requirement for the stock exchanges of Pakistan; hence SECP has to ensure compliance of corporate governance in the listed companies. There are three stock exchanges in Pakistan namely: Karachi Stock Exchange (KSE 100 index), Lahore Stock Exchange (LSE 25 index), and the Islamabad Stock Exchange (ISE 10 index). KSE is largest among the three equity market of Pakistan and has 638 listed companies with a total market capitalization of approximately Rs 3147.6 billion ($ 37 billion) on 31 March 2011(Economic Survey of Pakistan, 2010-2011). KSE has achieved phenomenal growth in the last few years, but still equity financing is not preferred because of two reasons: firstly a lack of competition in various industries and secondly the family owners do not want to lose their control on the companies (Hamid & Kozhich, 2006). Shareholders basic rights of registration are secured by Central Depository Company (CDC) as this company electronically maintains the account of ownership for all the listed companies. Shareholders can legally demand information regarding the company’s affairs which allows them to actively participate in Annual general meeting (AGM). Shareholders elect directors through cumulative voting and they can also remove a director through resolution. Shareholders’ approval is mandatory for any major corporate asset sale, change in the Article of Association (AOA) or increasing authorized capital (SECP, 2005). The ownership structure of Pakistani corporation, is largely concentrated (see table 1 for top 40 companies ownership structure) and corporations are mostly controlled by the family (Cheema et al, 2003; Ghani et al,
2007) through crossholding and pyramid structuring (Cheema et al, 2003; Hamid & Kozhich, 2006). The Pakistan equity market is oriented towards few large companies as only 60 firm holds 80 percent of total market capitalization of KSE (Din and Javed, 2012) so the market is relatively shallow (Hamid & Kozhich, 2006). Likewise, there was not a single takeover attempt since 1988 till 1998 (Schneper & Guillén, 2004). According to study’s calculation Pakistan’s equity market was 21 percent of its GDP in 2010 while a World Bank data source has been used for calculation which shows the shallowness of the market.
Table 5: Ownership Structure of Top 40 Pakistani Listed Firms
Ownership Type % of Top 40 Companies All Non-Financial
% of Top 40s Market Capitalisation All Non-Financial Local Private Family- Based 52.5 59.0 30.2 29.8 Government 12.5 12.0 36.5 36.8 Semi Government 22.5 14.0 16.3 15.6 MNCs 12.5 15.0 17.0 18.0 Source: Cheema et al (2003)
2 Literature Review
Lins (2003) conducted the cross sectional analysis of the 18 emerging economies and concluded that there is a decrease in firm valuation as a result of the cross holding (indirect ownership). He also documented that the countries having a lower investor legal protection are better off maintaining the non-executive block holders as this will lighten the negative effect of the controlling concentration on the firm valuation. Similarly, Ongore (2011) depicted that there is a significant negative relationship between the concentration of ownership and firm performance, which was measured through return on assets, return on equity and dividend yield. On the other hand, Claessens & Djankov (1999) documented that higher concentration of ownership resulted in higher firm profitability and labor productivity in the emerging markets of the Czech Republic. Furthermore, Wiwattanakantang (2001) conducted the investigation on the role of the controlling shareholders on the firm performance in Thailand. He concluded that controlling shareholders increase the firm performance, which is measured through the accounting performance parameters (i.e. ROA and Sale to asset ratio). He further justified his result with the argument that his sample contains the firms that do not separate the cash flow rights from voting rights, so controlling shareholders have no incentive to apply pressure for expropriation of the minority shareholders’ rights. Likewise, Singal & Singal (2011) documented that firms with concentrated ownership have better performance that firms with dispersed ownership. Similarly, Isik & Soykan (2013) and Karaca & Ekşi (2012) have conducted analysis on Turkish list firms through panel regression models and depicted that concentrated ownership has a positive relationship with firm performance. Furthermore, Karaca & Ekşi (2012) employed only accounting base performance parameter (ROA) and Isik & Soykan (2013) measured firm performance, though both accounting (ROA) and market base performance parameters (Tobin’s Q). On other hand, Demsetz & Villalonga (2001), Earle et al (2005), Hussain & Johnson (2009), Najjar (2012), and Al-Saidi (2013) have depicted that there is no significant relationship between the ownership structure and firm performance.
2.1 Literature on Ownership Structure and Firm Performance in Pakistan
The study regarding ownership structure and firm performance was conducted by Javed & Iqbal (2008) in which they documented that the Pakistan has the concentrated ownership structure and ownership concentration has a positive relationship with the firm performance when endogeneity is removed through controlling the firm specific variables. Their results showed that ownership concentration is enhanced by market growth opportunity and dilute by firm size. Similarly, Khan et al (2011), Azam et al (2011) and Hassan et al (2014) also found a positive relationship between ownership concentration and firm performance. Khan et al (2011) conduction analysis on the tobacco sector and used only accounting base performance measure (ROA and ROE). Whereas, Azam et al (2011) empirically tested the ownership concentration on firm performance in oil and gas sector but firm performance was measured through accounting base performance measure only (i.e. ROA, ROE and NPM). They documented that ownership concentration has strong and positive impact on the firm performance. On the hand, there are few researches (e.g., Ibrahim et al, 2010; Wahla et al, 2012; Yasser, 2015) that found a nonsignificant impact of ownership concentration on firm performance in Pakistani context. Ibrahim et al (2010) conducted analysis on chemical and pharmaceutical sector and used return on asset (ROA) and return on equity (ROE) as firm performance measures. Whereas, Wahla et al (2012) used market base performance measure (Tobin’s Q) as depend variable on 137 non-financial companies listed on the Karachi stock exchange. Furthermore, Yasser (2015) had used both accounting (ROA, ROE and EVA) and market base performance (Tobin's Q) measures, but still did not find any relationship between ownership concentration and firm performance. Hence, there is no consensus on empirical relationship of ownership concentration and firm performance so further analysis is needed to conclude on these mix findings.
3 Data and Research Methodology
There are total 638 firms listed on the Karachi stock exchange which include 287 financial firms and 351 non-financial firms. As Mustafa et al (2009) proposed that non-financial and nonnon-financial firms could not be studied collectively in corporate governance literature due to the number of reasons (i.e. nature of business, functionality of regulators and state, board structure, fiduciary responsibilities and accountability, and management). Hence, the current study has considered only non-financial firms and the sample for the study was 351 companies listed on KSE. Although, current study employed the census approach for sampling, but the sample for the current study was reduced to 262 due to availability of data. The current study used data for six years (2006-2011) which were collected from secondary sources, i.e. firm’s annual reports, Balance Sheet Analysis (BSA), and SECP’s data. Annual reports and SECP database were used for collecting ownership concentration. Financial performance data were collected from the balance sheet analysis.
3.1 Multivariate Regression Model
The study employed three multivariate regression models to determine the relationship between ownership concentration and firm performance which are given as follows:
3.1.1 Model 1
Use to determine the effect of ownership concentration on ROA:
= α + β LSH + β 5LSH + β 10LSH + β FAge + β FSize + β LEV +
Where, ROA = Return on asset, α = constant term, LSH= Largest shareholder holder, 5LSH= shareholding of largest five owners, 10LSH= shareholding of largest ten owners, AGE= Age of firms, Size= log of total asset, LEV= leverage of firms, ε= error term and β = coefficients.
3.1.2 Model 2
Use to determine the effect of ownership concentration on ROE:
= α + β LSH + β 5LSH + β 10LSH + β FAage + β Size + β LEV +
Where, ROE = Return on equity, α = constant term, LSH= Largest shareholder holder, 5LSH= shareholding of largest five owners, 10LSH= shareholding of largest ten owners, FAge= Age of firms, Size= log of total asset, LEV= leverage of firms, ε= error term and β = coefficients.
3.1.3 Model 3
Use to determine the effect of ownership concentration on Tobin’s Q:
= α + β LSH + β 5LSH + β 10LSH + β FAge + β FSize + β LEV +
Where, TQ = Tobin’s Q, α = constant term, LSH= Largest shareholder holder, 5LSH= shareholding of largest five owners, 10LSH= shareholding of largest ten owners, FAge= Firms’ age, FSize= log of total asset, LEV= leverage of firms, ε= error term and β = coefficients.
3.2 Independent Variables
This study employed ownership concentration as the independent variable. The ownership Concentration is measured by percentage of ownership shares (votes) of the largest shareholder (Alimehmeti & Paletta, 2012; Denis et al, 1997; Hautz et al, 2013; Thomsen & Pedersen, 2000), largest five shareholders (Earle et al, 2005) and ten largest shareholders (Yasser, 2015).
3.3 Dependent Variable
Firm performance is used as the dependent variable for the purpose of this study. Considering the multi-dimensionality of firm performance, both accounting and market-based performance measures are employed in this study (Barney, 2002; Daily & Johnson, 1997; Hoskisson et al, 1994). Because Daily & Johnson (1997) noted that “reliance on multiple performance measures is important, as no one indicator reasonably captures firm financial performance”. Therefore, three proxies are used for measure firm performance that includes Returns on Assets (ROA), Return on Equity (ROE) and Tobin’s Q (TQ).
3.3.1 Return on Assets (ROA)
It is measured by dividing firm’s net income by total assets (Kumar, 2004; Silva & Leal, 2006; Tam & Tan, 2007; Wiwattanakantang, 2001).
ROA = Operating income
Total Asset
This is a measure of how efficiently the assets have been utilized in the production process and reflects the performance of the management. Bhagat & Bolton (2008) suggested that on average, higher ROA suggests the effective and efficient use of a firm’s assets in maximizing the value of its shareholders’ investments by management i.e. internal corporate governance structures. Demsetz & Lehn (1985) suggest that as accounting profit, ROA may reflect year-to-year fluctuations in underlying business conditions better than stock market rates of return. This is because stock market rates of return reflect expected future developments that may mask current fluctuations in business conditions. ROA is also a measure of choice because of its more desirable distributional properties and because it is not affected by leverage and other items (Core et al, 2006).
3.3.2 Return on Equity (ROE)
Return on equity is a ratio of operating income to total equity (Ibrahim et al, 2010; Javed & Iqbal, 2008; Kumar, 2004; Lam & Lee, 2008).
ROE = Operating income
Total Equity
ROE is cited frequently as a measure of performance in corporate governance related research. ROE indicates management’s effectiveness in generating a return on the funds invested by the common shareholders, to whom management is ultimately responsible and accountable. One may argue that ROE is relatively better as it measures operating performance from shareholders’ point of view (i.e. interest expense is removed from earnings) (Brown & Caylor, 2009).
3.3.3 Tobin’s Q
Tobin’s Q is measured by ratio of firm’s market value to its book value book value on a replacement cost basis (White et al, 1998). The value of Tobins’s Q is lower than 1 (price less than replacement book value) means that, earning of the firm is lower than required rate of return. So it can be explained as every marginal investment of single dollar by firm in its assets would generate a future cash flow whose present value is lower than 1$ (White et al, 1998).
Tobin’s Q = MV of equity + B. V of liabilities
Total Asset
3.4 Control Variables
In this study, the researcher included firm size, firm age and as controlling constructs in the model. The relevant items of controlling constructs are derived from past empirical literature.
3.4.1 Firm Size
The firm size was measured the taking log of book value of firm assets (Al-Smadi et al, 2013). The rationale is that a firm may derive economies of scales from large sized assets to increase productivity and sales (Demsetz & Lehn, 1985). Thus, the researcher expects firms with larger capital resources were likely to have higher market value and vice versa.
3.4.2 Firm Age
The firm age was measured by years since firm incorporation (Choi et al, 2012). Firm age is regarded as a determinant to influence ownership structure in which older firms may associate with more dispersed ownership structure compared to younger firms (Eisenberg et al, 1998).
3.4.3 Firm Leverage
The firm leverage was measured by ratio of total Debt to total Equity (Chen & Joggi, 2000; Hutchinson & Gul, 2004).
Firm Leverage = Total Debts
Total Equity
The rationale for inclusion of firm leverage as control is that a firm’s leverage may lead to increased in external control because creditors would monitor its capital structure more intensively to protect their interests (Chen & Joggi, 2000; Hutchinson & Gul, 2004).
4 Empirical Results and Analysis
This section provides detail of the empirical results of ownership concentration on firm performance that are given as below.
4.1 Descriptive Statistics
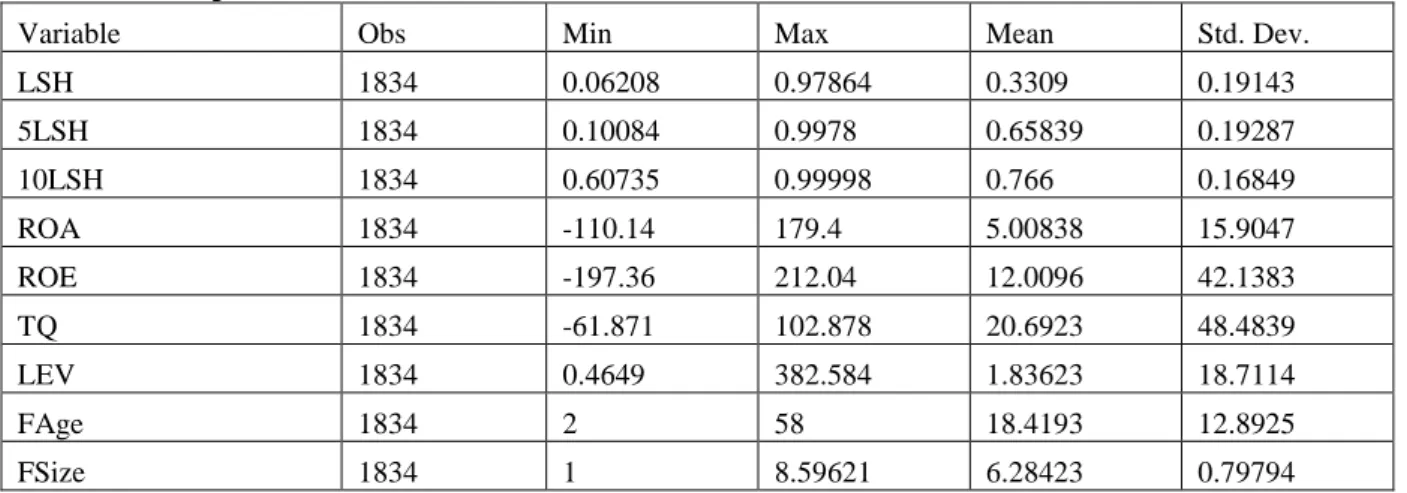
The descriptive statistics for independent (i.e. LSH, 5LSH, and 10LSH), dependent (i.e. ROA, ROE and Tobin’s Q) and control variable (i.e. Firm age, Firm size and firm leverage) is provided in table 2. The descriptive statistics reveals that largest shareholder on average owns 33 percent of shares in firms. However, largest five shareholders own substantial number of shareholding in firm with average of 65 percent. Similarly, largest ten shareholders own 76 percent firm’s shareholding on average. With respect to performance measures, descriptive statistics demonstrated that ROA has mean of 5 percent with a standard deviation of 15.90 percent. The minimum value is -110.14 percent and the maximum value is 179.42 percent. Furthermore, ROE has minimum and maximum value of -197 and 212.04 percent respectively. The mean value is 12 percent with a standard deviation of 42.13 percent. Moreover, Tobin’s Q has a mean value of 20 percent with standard deviation of 42 percent. The minimum value is -61.8 percent while the maximum value is 102.87 percent.
Table 6: Descriptive Statistics
Variable Obs Min Max Mean Std. Dev.
LSH 1834 0.06208 0.97864 0.3309 0.19143 5LSH 1834 0.10084 0.9978 0.65839 0.19287 10LSH 1834 0.60735 0.99998 0.766 0.16849 ROA 1834 -110.14 179.4 5.00838 15.9047 ROE 1834 -197.36 212.04 12.0096 42.1383 TQ 1834 -61.871 102.878 20.6923 48.4839 LEV 1834 0.4649 382.584 1.83623 18.7114 FAge 1834 2 58 18.4193 12.8925 FSize 1834 1 8.59621 6.28423 0.79794 4.2 Correlation Analysis
The study has three independent variables of ownership concentration which includes: largest shareholder (LSH), the largest five shareholders (Five LSH), and ten largest shareholders (Ten LSH). Pearson correlation coefficients matrix (see table 3) shows number of significant associations among dependent (ROA, ROE and Tobin’s Q) and independent variables (LSH, Five LSH, and Ten LSH). Such as ROA has significant positive association with LSH (0.1755) and, Five LSH (0.0867), whereas ROE has strong positive relationship with all the ownership concentration indicators (i.e. LSH (0.2928), Five LSH (0.2697) and Ten LSH (0.3842). Similarly Tobin’s Q is also positively correlated with LSH (0.2752), Five LSH (0.2317) and Ten LSH (0.2077). However, there are weak and statistically non-signigicant correlation between ROA and Ten LSH (0.0317).
In regards to control variables, it was depicted that ROA has a significant positive correlations coefficient for firm size (0.2475) and firm age (0.1387), whereas it is significantly negatively associated with leverage (-0.2411). On the other hand, ROE is only significantly positively correlated with firm size (0.1224) and firm age (0.1126), but it has non-significant correlation coefficient with firm’s leverage (-0.0098). Furthermore, Tobin’s Q is significant positive but weakly correlated with firm size (0.0905) and firm age (0.0688), whereas Tobin’s in not significantly correlated with firm’s leverage (0.0145). Furthermore, it should be noted that Firm age, the control variable, was significantly positively correlated (0.438) with the independent variable (LSH (0.1417)) and (10LSH (-0.1202)) while, it was significantly negatively correlated (0.10) with the 5LSH. Nevertheless, Firm size was significantly positively correlated (0.1898) with LSH and negatively correlated with 5LSH(-0.0755).
Table 7: Correlation Matrix
1 2 3 4 5 6 7 8 9 1) LSH 1 2) 5LSH 0.72** 1 3) 10LSH 0.54** 0.87** 1 4) ROA 0.18** 0.09** 0.03 1 5) ROE 0.29** 0.27** 0.38** 0.46** 1 6) TQ 0.28** 0.231** 0.21** 0.05* 0.11** 1 7) LEV -0.04 0.05* -0.03 -0.24** -0.01 0.02 1 8) FAge 0.14** -0.12** 0.10** 0.14** 0.11** 0.07* -0.06* 1 9) FSize 0.19** -0.08** 0.02 0.25** 0.12** 0.09** -0.22** 0.24** 1 ** sig. at P-value <.01 and * sig. at P-value <.05
Number of Observations=1834 4.3 Results of Regression Models
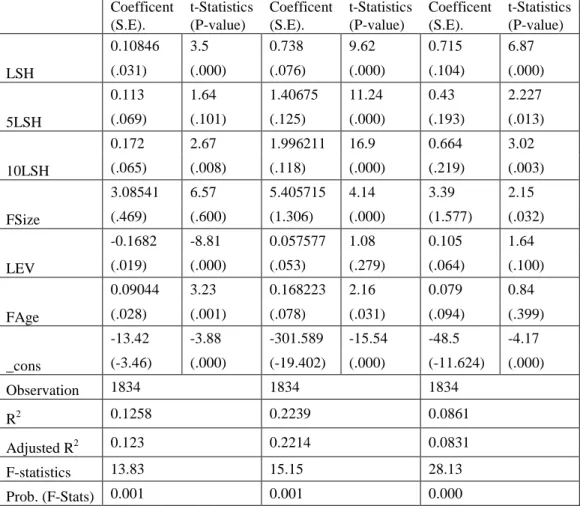
We began our analysis by assessing the effect of the three basic concentration indicators (LSH, 5LSH, and 10LSH) on the three firm performance parameters (ROA, ROE, and Tobin’s Q). Table 4 shows the results of the estimation of performance equations for the 262 companies listed on KSE. In respect to ROA, the largest
shareholder (LSH) and ten largest shareholder (10LSH) has significant positively relationship (see table 4), whereas five largest shareholder (5LSH) has non-significant relationship with ROA. These results implies that higher concentration of ownership for largest and ten largest shareholders increase the firm performance, while concentration of ownership of five largest shareholder has no influence on firm performance. Furthermore, in respect of ROE and Tobin’s Q as performance parameters, results concluded that they are positively related to all the three ownership concentration indicators. These results indicated that concentration of ownership increase the firm performance for all three ownership concentration indicators. The results of current study are consistent with argument proposed by agency theory which proposed that concentration of ownership is used to alleviating the principal agent problems, as it gives the owners more power or willingness to monitor the firms’ managers. However, these results differ from previous research studies in Pakistan (e.g., Ibrahim et al, 2010; Wahla et al, 2012; Yasser, 2015). The possible explanation is that the current study used large data set with extend time period. As mostly pervious research studies have focus on few sectors (Ibrahim et al, 2010; Wahla et al, 2012) or small data set (Yasser, 2015).
Table 8: Results of Multiple Regression Models
Coefficent t-Statistics Coefficent t-Statistics Coefficent t-Statistics (S.E). (P-value) (S.E). (P-value) (S.E). (P-value)
LSH 0.10846 3.5 0.738 9.62 0.715 6.87 (.031) (.000) (.076) (.000) (.104) (.000) 5LSH 0.113 1.64 1.40675 11.24 0.43 2.227 (.069) (.101) (.125) (.000) (.193) (.013) 10LSH 0.172 2.67 1.996211 16.9 0.664 3.02 (.065) (.008) (.118) (.000) (.219) (.003) FSize 3.08541 6.57 5.405715 4.14 3.39 2.15 (.469) (.600) (1.306) (.000) (1.577) (.032) LEV -0.1682 -8.81 0.057577 1.08 0.105 1.64 (.019) (.000) (.053) (.279) (.064) (.100) FAge 0.09044 3.23 0.168223 2.16 0.079 0.84 (.028) (.001) (.078) (.031) (.094) (.399) _cons -13.42 -3.88 -301.589 -15.54 -48.5 -4.17 (-3.46) (.000) (-19.402) (.000) (-11.624) (.000) Observation 1834 1834 1834 R2 0.1258 0.2239 0.0861 Adjusted R2 0.123 0.2214 0.0831 F-statistics 13.83 15.15 28.13 Prob. (F-Stats) 0.001 0.001 0.000 5 Conclusion
The purpose of this empirical research study is to investigate the relationship between ownership concentration and firm performance for a sample of Pakistan public companies listed on the KSE. The current paper contributes to the area of research on an emerging market, the Pakistan capital market. This study would help researchers and practitioners alike understand the relationship between ownership structure and firm performance in the Pakistani governance environment. The findings of this empirical study provide the importance of ownership concentration as corporate governance internal control mechanism for controlling the self-intrinsic behavior of managers. The findings of this study also imply that policy makers should consider the characteristics of firms and the nature of ownership structure before they implement new economic reform programs.
Despite the comprehensive effort to cover all aspects of the studied phenomena, but still current study is prone to few limitations. Although the study contributes to understanding the impact of ownership concentration on firm performance using a sample of Pakistani listed firms, but the impact of other governance mechanism (i.e. ownership identity and board characteristic) may enhance the effectiveness of governance and performance
models. Thus, the study opened a interesting aspects for future research which may replicate the present study by studying the impact of ownership concentration along with other corporate governance internal control mechanism. Therefore, future study should include comprehensive model of corporate governance internal control mechanism on firm performance to better understand the impact of controlling mechanism of corporate governance on firm performance in emerging markets.
6 References
Al-Hussain, A. H. & Johnson, R. L. (2009) Relationship Between Corporate Governance Efficiency and Saudi Banks’ Performance. The Business Review, Cambridge, 14(1), 111-117.
Al-Saidi, M. (2013) Ownership Concentration and Firm Performance: The Case of Kuwait. Jordan Journal of Business Administration, 9(4), 803-820.
Al-Smadi, A. A., Mohd-Saleh, N. & Ibrahim, I. (2013) Corporate Governance Mechanisms, Privatization Method and the Performance of Privatized Companies in Jordan. Asian Journal of Accounting & Governance, 4, 31-50.
Alimehmeti, G. & Paletta, A. (2012) Ownership concentration and effects over firm performance: Evidences from italy. European Scientific Journal, 8(22), 39-49.
Azam, M., Usmani, S. & Abassi, Z. (2011) The Impact of Corporate Governance on Firm’s Performance : Evidence from Oil and Gas Sector of Pakistan. Australian journal of basic and applied science, 5(12), 2978-2983.
Barney, J. (2002) Gaining and Sustaining Competitive Advantage, 2nd edition. Upper Saddle River, NJ: Prentice Hall.
Bhagat, S. & Bolton, B. (2008) Corporate Governance and Firm Performance. Journal of Corporate Finance, 14(3), 257-273.
Brown, L. & Caylor, M. (2009) Corporate governance and firm operating performance. Review of Quantitative Finance and Accounting, 32(2), 129-144.
Cheema, A., Bari, F. & Siddique, O. (2003) Corporate Governance in Pakistan: Issues of Ownership, Control and the Law, in Sobhan, F. & Werner, W. (eds), A Comparative Analysis of Corporate Governance in South Asia: Charting a Road Map for Bangladesh. . Dhaka: Bangladesh Enterprise Institute.
Chen, P. & Joggi, B. (2000) Association between independent non-executive directors, family control and financial disclosures in Hong Kong. Journal of Accounting and Public Policy, 19(4/5), 285-310.
Choi, H. M., Sul, W. & Min, S. K. (2012) Foreign Board Membership and Firm Value in Korea. Management Decision, 50(2), 3-3.
Claessens, S. & Djankov, S. (1999) Ownership Concentration and Corporate Performance in the Czech Republic. Journal of Comparative Economics, 27(3), 498-513.
Core, J. E., Guay, W. R. & Rusticus, T. O. (2006) Does Weak Governance Cause Weak Stock Returns? An Examination of Firm Operating Performance and Investors' Expectations. The Journal of Finance, 61(2), 655-687.
Daily, C. M. & Johnson, J. L. (1997) Sources of CEO power and firm financial performance: A longitudinal assessment. Journal of Management, 23(2), 97-117.
Demsetz, H. & Lehn, K. (1985) The Structure of Corporate Ownership: Causes and Consequences. Journal of Political Economy, 93(6), 1155-1177.
Demsetz, H. & Villalonga, B. (2001) Ownership structure and corporate performance. Journal of Corporate Finance, 7(3), 209-233.
Denis, D. J., Denis, D. K. & Sarin, A. (1997) Agency problems, equity ownership, and corporate diversification. The Journal of Finance, 52(1), 135-160.
Earle, J. S., Kucsera, C. & Telegdy, A. (2005) Ownership concentration and corporate performance on the Budapest stock exchange: do too many cooks spoil the goulash? . Corporate Governance: An International Review, 13(2), 254-264.
Economic Survey of Pakistan (2010-2011) Islamabad: Misnistry of Finance: Government of Pakistan.
Eisenberg, T., Sundgren, S. & Wells, M. T. (1998) Larger Board Size and Decreasing Firm Value in Small Firms. Journal of Financial Economics, 48(1), 35-54.
Ghani, W. I., Haroon, O. & Ashraf, J. (2007) Corporate Governance, Business Group Affiliations, and Firm Performance: Descriptive Evidence from Pakistan., Mid-Atlantic Regional Meeting of the AAA. Parsippany, New Jersey.2007.
Hamid, H. H. & Kozhich, V. (2006) CORPORATE GOVERNANCE IN AN EMERGING MARKET: A PERSPECTIVE ON PAKISTAN. Journal of Legal Technology Risk Management 1(1), 22-33.
Hassan, M. u., Shaukat, S. & Nawaz, M. S. (2014) Reconnecting the Ownership Structure and Independence with Financial Performance: An Empirical Evidence from Manufacturing Sector of Pakistan Pakistan Journal of Social Sciences, 34(1), 273-281.
Hautz, J., Mayer, M. C. & Stadler, C. (2013) Ownership identity and concentration: a study of their joint impact on corporate diversification. British Journal of Management, 24(1), 102-126.
Hoskisson, R., Johnson, R. & Moesel, D. (1994) Corporate divestiture intensity in restructuring firms: Effects of governance, strategy, and performance. Academy of Management Journal, 37(5), 1207.
Hutchinson, M. & Gul, F. (2004) Investment opportunity set, corporate governance practices and firm performance. Journal of Corporate Finance, 10(4), 595-614.
Ibrahim, Q., Rehman, R. & Raoof, A. I. (2010) Role of Corporate Governance in Firm Performance: A Comparative Study between Chemical and Pharmaceutical Sectors of Pakistan. International Research Journal of Finance & Economics(50), 7-16.
Isik, O. & Soykan, M. E. (2013) Large Shareholders and Firm Performance: Evidence from Turkey. European Scientific Journal, 9(25), 23-37.
Javed, A. Y. & Iqbal, R. (2008) Ownership Concentration, Corporate Governance and Firm Performance: Evidence from Pakistan. The Pakistan Development Review, 47(4), 643–659.
Karaca, S. S. & Ekşi, I. H. (2012) Corporate Governance as a Driver of Organizational Efficiency in Courier Service Firms : Empirical Findings from Nigeria. Interdisciplinary Journal of Research In Business, 1(11), 26-38.
Khan, K., Nemati, A. R. & Ifthikar, M. (2011) Impact of Corporate Governance on Firm’s value of Tobacco Industry of Pakistan. International Research Journal of Finance and Economics(61), 7-14.
Kumar, J. (2004) Does Corporate Governance Influence Firm Value? Evidence from Indian Firms. The Journal of Entrepreneurial Finance and Business Ventures, 9(2), 61 –93.
La Porta, R., Lopez-de-Silanes, F., Shleifer, A. & Vishny, R. (2000) Investor protection and corporate governance. Journal of Financial Economics, 58(1-2), 3-27.
Lam, T. & Lee, S. (2008) Ceo Duality and Firm Performance: Evidence from Hong Kong. Corporate Governance: The International Journal of Business in Society, 8(3), 299-316.
Lins, K. V. (2003) Equity ownership and firm value in emerging markets. Journal of Financial and Quantitative Analysis, 38(1), 159-184.
Makhija, M. V. (2004) The Value of Restructuring in Emerging Economies: The Case Of The Czech Republic. Strategic Management Journal, 25(3), 243-267.
Mustafa, M., Osmani, S., Elmazi, S., Tosuni, G., Aliu, F. & Hashi, I. (2009) Corporate Governance in Banks and Insurance Companies: The Experience of Kosovo.Washington, DC.
Najjar, N. (2012) The impact of corporate governance on the insurance firm’s performance in Bahrain. International Journal of Learning and Development, 2(2), 1-17.
Ongore, V. O. (2011) The relationship between ownership structure and firm performance: An empirical analysis of listed companies in Kenya. African Journal of Business Management, 5(6), 2120-2128.
Schneper, W. D. & Guillén, M. F. (2004) Stakeholder Rights and Corporate Governance: A Cross-National Study of Hostile Takeovers. Administrative Science Quarterly, 49(2), 263-295.
SECP (2005) Manual of Corporate Governance.Islamabad.
Silva, A. L. C. d. & Leal, R. P. C. (2006) Ownership, Control, Valuation and Performance of Brazilian Corporations Corporate Ownership & Control 4(1), 300-308.
Singal, M. & Singal, V. (2011) Concentrated ownership and firm performance: does family control matter? Strategic Entrepreneurship Journal, 5(4), 373-396.
Tam, O. K. & Tan, M. G.-S. (2007) Ownership, Governance and Firm Performance in Malaysia. Corporate Governance: An International Review, 15(2), 208-222.
Thomsen, S. & Pedersen, T. (2000) Ownership Structure and Economic Performance in the Largest European Companies. Strategic Management Journal, 21(6), 689-705.
Wahla, K.-U.-R., Shah, S. Z. A. & Hussain, Z. (2012) Impact of Ownership Structure on Firm Performance: Evidence from Non-Financial Listed Companies at Karachi Stock Exchange. International Research Journal of Finance and Economics, 84(1), 6-13.
Wang, K. & Shailer, G. (2015) OWNERSHIP CONCENTRATION AND FIRM PERFORMANCE IN EMERGING MARKETS: A META-ANALYSIS. Journal of Economic Surveys, 29(2), 199-229.
White, G. I., Sondhi, A. C. & Fried, D. (1998) The Analysis and Use of Financial Statements, 2 nd edition. New York: John Wiley and Sons.
Wiwattanakantang, Y. (2001) Controlling shareholders and corporate value: Evidence from Thailand. Pacific Basin Finance Journal, 9(4), 323-362.
Yasser, Q. R. (2015) Effects of ownership concentration on firm performance: Pakistani evidence Journal of Asia Business Studies, 9(2), 62-176.
Zeckhauser, R. J. & Pound, J. (1990) Are large shareholders effective monitors? An investigation of share ownership and corporate performance, in Hubbard, R. G. (ed), Asymmetric Information, Corporate Finance and Investment. Chicago and London: University of Chicago Press, 149-180.