Version: Published Version Article:
Wirth, C. orcid.org/0000-0002-1800-0899, Dockree, P.M., Harty, S. et al. (2 more authors) (2019) Towards error categorisation in BCI: single-trial EEG classification between different errors. Journal of Neural Engineering. ISSN 1741-2560
https://doi.org/10.1088/1741-2552/ab53fe
[email protected] https://eprints.whiterose.ac.uk/
Reuse
This article is distributed under the terms of the Creative Commons Attribution (CC BY) licence. This licence allows you to distribute, remix, tweak, and build upon the work, even commercially, as long as you credit the authors for the original work. More information and the full terms of the licence here:
https://creativecommons.org/licenses/
Takedown
If you consider content in White Rose Research Online to be in breach of UK law, please notify us by
ACCEPTED MANUSCRIPT • OPEN ACCESS
Towards error categorisation in BCI: single-trial EEG classification
between different errors
To cite this article before publication: Christopher Wirth et al 2019 J. Neural Eng. in press https://doi.org/10.1088/1741-2552/ab53fe
Manuscript version: Accepted Manuscript
Accepted Manuscript is “the version of the article accepted for publication including all changes made as a result of the peer review process, and which may also include the addition to the article by IOP Publishing of a header, an article ID, a cover sheet and/or an ‘Accepted Manuscript’ watermark, but excluding any other editing, typesetting or other changes made by IOP Publishing and/or its licensors” This Accepted Manuscript is © 2019 IOP Publishing Ltd.
As the Version of Record of this article is going to be / has been published on a gold open access basis under a CC BY 3.0 licence, this Accepted Manuscript is available for reuse under a CC BY 3.0 licence immediately.
Everyone is permitted to use all or part of the original content in this article, provided that they adhere to all the terms of the licence
https://creativecommons.org/licences/by/3.0
Although reasonable endeavours have been taken to obtain all necessary permissions from third parties to include their copyrighted content within this article, their full citation and copyright line may not be present in this Accepted Manuscript version. Before using any content from this article, please refer to the Version of Record on IOPscience once published for full citation and copyright details, as permissions may be required. All third party content is fully copyright protected and is not published on a gold open access basis under a CC BY licence, unless that is specifically stated in the figure caption in the Version of Record.
View the article online for updates and enhancements.
Towards error categorisation in BCI: single-trial
EEG classification between different errors
C Wirth1,∗, P M Dockree2, S Harty2, E Lacey2, and M
Arvaneh1
1Automatic Control and Systems Engineering Department, University of Sheffield,
Sheffield, UK
2Institute of Neuroscience, Trinity College Dublin, Dublin, Ireland
E-mail: [email protected]
Abstract.
1
Objective: Error-related potentials (ErrP) are generated in the brain when humans 2
perceive errors. These ErrP signals can be used to classify actions as erroneous 3
or non-erroneous, using single-trial electroencephalography (EEG). A small number 4
of studies have demonstrated the feasibility of using ErrP detection as feedback 5
for reinforcement-learning-based Brain-Computer Interfaces (BCI), confirming the 6
possibility of developing more autonomous BCI. These systems could be made more 7
efficient with specific information about the type of error that occurred. A few studies 8
differentiated the ErrP of different errors from each other, based on direction or severity. 9
However, errors cannot always be categorised in these ways. We aimed to investigate 10
the feasibility of differentiating very similar error conditions from each other, in the 11
absence of previously explored metrics. 12
Approach: In this study, we used two data sets with 25 and 14 participants to 13
investigate the differences between errors. The two error conditions in each task 14
were similar in terms of severity, direction and visual processing. The only notable 15
differences between them were the varying cognitive processes involved in perceiving 16
the errors, and differing contexts in which the errors occurred. We used a linear 17
classifier with a small feature set to differentiate the errors on a single-trial basis. 18
Results: For both data sets, we observed neurophysiological distinctions between 19
the ErrPs related to each error type. We found further distinctions between age groups. 20
Furthermore, we achieved statistically significant single-trial classification rates for 21
most participants included in the classification phase, with mean overall accuracy of 22
65.2% and 65.6% for the two tasks. 23
Significance: As a proof of concept our results showed that it is feasible, using 24
single-trial EEG, to classify these similar error types against each other. This study 25
paves the way for more detailed and efficient learning in BCI, and thus for a more 26
autonomous human-machine interaction. 27
Keywords: ErrP, EEG, Classification, BCI, Human Machine Interaction,
Neurophysiol-28
ogy, Error detection
29
Submitted to: J. Neural Eng. 30 4 5 6 7 8 9 10 11 12 13 14 15 16 17 18 19 20 21 22 23 24 25 26 27 28 29 30 31 32 33 34 35 36 37 38 39 40 41 42 43 44 45 46 47 48 49 50 51 52 53 54 55 56 57 58 59 60
Accepted Manuscript
1. Introduction
31
When a human recognises that an error has been committed, either by themselves
32
or in actions that they are observing, characteristic signals known as error-related
33
potentials (ErrP) are generated in the brain [1]. A number of studies have shown
34
that it is possible to differentiate between errors and correct actions, by detecting ErrP
35
using electroencephalography (EEG), on a single-trial basis [2, 3, 4, 5]. Interestingly,
36
previous studies have confirmed the possibility of using single-trial error vs non-error
37
classification as a feedback function for a reinforcement learning-based Brain Computer
38
Interfaces (BCI) [2, 3, 4, 5]. This opens up the possibility of moving toward autonomous
39
BCI systems, allowing the machine to learn appropriate low-level actions based on the
40
human’s perceptions of which actions are correct, and which are errors. Such systems are
41
able to reduce human mental workload by learning quasi-optimal solutions in scenarios
42
such as simple navigation tasks [3, 4]. However, when tasks increase in complexity,
43
learning will become slower if the only available information is whether a given action
44
was correct or erroneous. Hence, if a system can be given more detailed information
45
about the type of error that occurred, it can correct its actions more appropriately, and
46
learn more quickly.
47
More recently, a handful of studies have shown that, beyond classifying errors
48
against correct actions, it is possible to distinguish different errors against each other
49
based on their ErrP. In a study by Iturrate et al., participants observed a virtual robotic
50
arm, which had the task of selecting a specific basket [6]. However, the arm also could
51
erroneously select baskets 1 or 2 steps away from the target, to the left and to the
52
right. The study showed that there were significant differences between the ErrP for
53
errors to the left vs those to the right, and also between those of small vs large errors. In
54
addition to this, a small number of studies have considered neurophysiological differences
55
arising from varying sources of errors. Different ErrP and error types that have been
56
discussed are as follows: “response ErrP” caused when a human recognised that they
57
have responded incorrectly to a task [7, 8, 5], “feedback ErrP” caused when a human
58
is informed that they have made an error of which they were previously unaware [7, 5],
59
“observation ErrP occurring when a human observes an error committed by a machine
60
or another human [7, 5], “execution errors” occurring when a machine fails to execute
61
a command as instructed by the human [9, 5], and “outcome errors” appearing when
62
a human experiences a task failure [9, 5]. A study by Sp¨uler and Niethammer showed
63
that it is possible to classify outcome errors (committed by a human) against execution
64
errors (committed by a machine) on a single-trial basis [9].
65
Despite these recent advances, the vast majority of literature in the field concerns
66
the classification of errors against correct actions, rather than the classification of
67
different error types against each other. Where single-trial error categorisation has been
68
explored in a few recent studies, metrics that have been considered to distinguish the
69
error categories include direction, severity, and whether the error was committed by the
70
human or the machine. However, different errors cannot always be categorised by such
71 4 5 6 7 8 9 10 11 12 13 14 15 16 17 18 19 20 21 22 23 24 25 26 27 28 29 30 31 32 33 34 35 36 37 38 39 40 41 42 43 44 45 46 47 48 49 50 51 52 53 54 55 56 57 58 59 60
Accepted Manuscript
metrics. For example, if we are trying to navigate to a target location we could either
72
take a wrong turn on the way, or we could reach the target but then pass it. These two
73
errors could be of the same direction and magnitude, and therefore indistinguishable
74
by currently explored metrics, but knowing which one had occurred would provide
75
useful information. Therefore, it is important to consider whether there are significant
76
neurophysiological distinctions in EEG signals between the brain’s responses to very
77
similar error conditions, even in cases where metrics explored in existing literature are
78
not available.
79
To address this question, we evaluated data from two tasks. In the first task, users
80
were presented with “go” and “no-go” stimuli and asked to respond to “go” stimuli, but
81
withhold responses to “no-go” stimuli. All of the errors considered by this experiment
82
were response errors committed by humans who failed to withhold responses to “no-go”
83
stimuli, and then recognised their own errors. None of the errors had any direction
84
associated with them, and participants were not instructed to consider any errors as
85
more or less severe than any others. The key difference between the error conditions
86
lay in the cognitive processes required to recognise them, with the recognition of one
87
error condition being more memory-dependent than the other. In the second task, users
88
observed a virtual robot attempting to navigate to, and grab, a target object. Here,
89
we investigated users’ EEG responses to two navigational errors: moving away from
90
the target when in position and ready to grab it, and moving further away from the
91
target object if not already in position. Errors were equally likely to be made to the
92
left or the right. In this case, all errors were being committed by the machine. As
93
with the first task, direction could not be used to distinguish the error conditions, and
94
users were not told to consider either error to be more or less severe than the other. As
95
such, the error conditions considered here could not be differentiated by metrics used
96
in existing literature. However, the contexts in which the errors arose differed slightly:
97
In one condition, the expected correct action would be a lateral movement towards the
98
target. In the other condition, the expected correct action would be to grab the target.
99
We aimed to use distinctions in the EEG signals, arising from these subtle differences
100
of cognitive load and context, to classify the error conditions against each other.
101
To explore the neurophysiological distinctions between the responses to these error
102
conditions, we used time domain data to compare the latency and amplitude of key ErrP
103
features: the error-related negativity (ERN), and the error positivity (Pe). The ERN
104
is a negative deflection, usually peaking fronto-centrally around 100ms after an error
105
[10, 1, 2]. The Pe is a slower positive wave, often peaking centro-parietally between
200-106
400ms after the error [10, 11, 12, 2]. In contrast with the ERN, the Pe has been shown
107
to depend on participants’ awareness and confidence that an error has been committed
108
[13, 14, 15, 16], suggesting that the Pe is linked to conscious processing of errors. In
109
addition to amplitude, the “build-up rate” of the Pe (i.e. the steepness of the slope
110
as amplitude increases to the peak) has also been identified as a marker of evidence
111
accumulation for error detection [17]. Further to this, secondary Pe peaks have been
112
identified, again being linked to conscious, evaluative processes [18, 19]. The ERN and
113 4 5 6 7 8 9 10 11 12 13 14 15 16 17 18 19 20 21 22 23 24 25 26 27 28 29 30 31 32 33 34 35 36 37 38 39 40 41 42 43 44 45 46 47 48 49 50 51 52 53 54 55 56 57 58 59 60
Accepted Manuscript
Pe have been displayed in a variety of previous single-trial error classification studies
114
[2, 3, 7, 9].
115
We also investigated the spatial distribution of the brain’s response to each error
116
condition, using topographical maps. In order to distinguish between error conditions
117
on a single-trial basis, we employed a stepwise linear discriminant analysis classification
118
strategy, using a small, highly discriminative set of time domain features from 20
119
electrode sites. We tested the efficacy of this strategy using data from 20 young and 5
120
older adults performing one task, and 14 young adults performing the other task.
121
2. Methods
122
2.1. Participants
123
This study used data collected during two tasks, which we refer to as the “Error
124
Awareness Dot Task” (EADT) and the “Claw Observation Task” (COT). Fifty-four
125
healthy adults were recruited for the EADT. 28 of these were young (aged 18-34) and
126
26 were older (aged 65-80). Seventeen healthy adults were recruited for the COT.
127
All of these participants were included in neurophysiological analyses, but some
128
were excluded from the single-trial classification phase of this study. 23 were excluded
129
from the EADT (4 young, 19 older) due to not producing enough artefact-free trials for
130
all conditions. A further 6 from the EADT (4 young, 2 older) were excluded as it may
131
have been possible to classify their data based on motor signals, rather than ErrPs. The
132
rationale for these exclusions is explained in further detail in section 2.4.1. This left
133
25 participants from the EADT (20 young, 5 older) to be included in the single-trial
134
classification phase. 3 participants were excluded from the COT due to not producing
135
enough artefact-free trials for all conditions. All COT participants used for single-trial
136
classification were young (aged 18-35).
137
All participants for both tasks had normal or corrected-to-normal vision. They
138
reported no history of psychiatric illness, head injury, or photosensitive epilepsy. Written
139
informed consent was provided before testing began. All participants of the EADT also
140
reported that they had no history of colour-blindness. All procedures for both tasks
141
were in accordance with the Declaration of Helsinki. Procedures for the EADT were
142
approved by the Trinity College Dublin Ethics Committee, and procedures for the COT
143
were approved by the University of Sheffield Ethics Committee in the Automatic Control
144
and Systems Engineering Department.
145
2.2. Experimental Setup
146
2.2.1. EEG Setup For the EADT, 64 channels of EEG were recorded at 512Hz,
147
using the BioSemi ActiveTwo system. Electrodes were placed using the 10-20 system.
148
Electrooculogram (EOG) electrodes were also placed at the outer cantus of each eye,
149
and above and below the left eye. Reference electrodes were placed on the left and right
150 mastoid. 151 4 5 6 7 8 9 10 11 12 13 14 15 16 17 18 19 20 21 22 23 24 25 26 27 28 29 30 31 32 33 34 35 36 37 38 39 40 41 42 43 44 45 46 47 48 49 50 51 52 53 54 55 56 57 58 59 60
Accepted Manuscript
For the COT, 20 channels of EEG were recorded at 500Hz, using an Enobio 20 5G
152
headset. The electrode positions used were: F7, F3, Fz, F4, F8, FC1, FC2, T7, C3, Cz,
153
C4, T8, CP1, CP2, P3, Pz, P4, PO7, PO8, and Oz. Reference electrodes were placed
154
on the earlobe.
155
2.2.2. The Error Awareness Dot Task The EADT was a time-critical reaction task,
156
requiring sustained attention. The task employed a “go/no-go” paradigm, requiring
157
participants to react to “go” stimuli with a mouse click, but withhold their reaction in
158
the case of “no-go” stimuli.
159
Participants were shown a succession of randomised, differently-coloured dots on a
160
computer screen, with a blank grey screen shown between dots, as shown inFigure 1.
161
Participants were asked to perform a left mouse click, in a timely manner, in response
162
to the presentation of each new dot. However, in two “no-go” scenarios, they were asked
163
to withhold their response. These scenarios were the presentation of a blue dot, or of
164
a dot that was the same colour as the previous dot. These are known as the “colour
165
condition” and “repeat condition”, respectively. If participants did click in either of
166
these scenarios, they were asked to perform a second click with the right mouse button,
167
in order to indicate their awareness of the error.
168
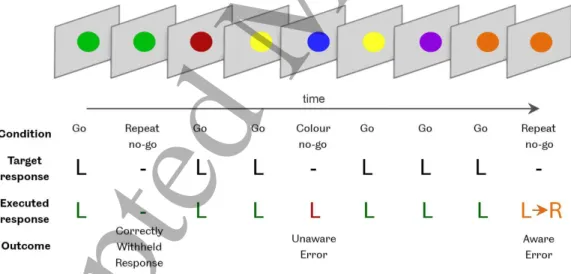
Figure 1. The Error Awareness Dot Task (EADT). Participants were asked to respond to “go” stimuli with a left mouse button click (L). They were asked to withold this response in the event of either a “colour no-go” stimulus (the stimulus is blue) or “repeat no-go” stimulus (the stimulus is the same colour as the previous stimulus). If participants performed a left mouse click following a no-go stimulus, they were asked to follow this with a right mouse button click (R), to register their awareness of their error.
Before testing began, a practice block took place, in which participants had to
169
respond successfully to three consecutive no-go trials, either by withholding their initial
170
response or, if they did click erroneously, by following up with an awareness click.
171 4 5 6 7 8 9 10 11 12 13 14 15 16 17 18 19 20 21 22 23 24 25 26 27 28 29 30 31 32 33 34 35 36 37 38 39 40 41 42 43 44 45 46 47 48 49 50 51 52 53 54 55 56 57 58 59 60
Accepted Manuscript
8 blocks of trials were collected from each participant, with the exception of five,
172
for whom 4-6 blocks of trials were collected. Each block lasted approximately 6 minutes,
173
and contained 176 “go” trials, 16 “repeat condition” trials, and 8 “colour condition”
174
trials.
175
The duration for which each stimulus was shown varied throughout the task,
176
depending on the accuracy of the participant in performing correct responses to go and
177
no-go trials. Initially, stimuli were displayed for 750ms. However, if the participant’s
178
accuracy were below 50%, stimulus duration would increase to 1000ms. Conversely,
179
if the participant’s accuracy were above 60%, stimulus duration would decrease to
180
500ms. Accuracy between 50 and 60% would result in stimulus duration remaining
181
at, or reverting to, 750ms. Stimulus duration was updated every 40 trials. An
inter-182
stimulus gap, in which the screen was a blank grey, remained constant at 750ms. This
183
meant that the time period between the onset of stimulus n and the onset of stimulus
184
n+ 1 could vary between 1250ms and 1750ms.
185
2.2.3. The Claw Observation Task In the COT, the errors in question were committed
186
by the machine and observed by the participants, as opposed to errors being committed
187
by the participants themselves in the EADT. Thus, the COT is similar to error-driven
188
BCI scenarios in which users observe actions made by a machine [6, 3].
189
Here, participants were asked to observe a computer-controlled simulation of an
190
arcade ‘claw crane’ game. Participants were shown a screen with 8 coloured circles
191
arranged in a row and, above the circles, a virtual robotic arm, as shown in Figure
192
2. A single circle, selected at random at the start of each run, was designated as the
193
target. This circle was coloured blue and marked with a score of +25 points. Every
194
other circle was coloured red. The red circles immediately adjacent to the target were
195
marked with a score of -10 points, and the scores marked on each circle decreased by a
196
further 5 points with each step further from the target. The robotic arm began each run
197
directly above a circle either 2 or 3 steps away from the target. Every 1.5s, the robotic
198
arm would either move 1 step to the left, move 1 step to the right, or extend downward
199
to grab the circle beneath it. Movements occurred instantaneously. The probability
200
of each type of action occurring depended on whether or not the arm was positioned
201
directly above the target circle. A table of action probabilities is shown in Table 1.
202
A score was also displayed in the top left corner of the screen. When a “grab”
203
action was performed, the score would be updated according to the score marked on
204
the circle that had been grabbed. After each “grab” action the run would finish and
205
the screen would become completely black. Nine of the COT participants were asked
206
to silently count the number of times each movement error was made in each run, in
207
an attempt to help them stay focused on the task. These participants were asked to
208
write down the number of errors on a sheet provided at the end of each run. As such,
209
the gap between the end of one run and the start of the next run was 10 seconds. The
210
remaining eight COT participants were not asked to perform the counting. For these
211
participants, the gap between runs was 5 seconds. In either case, a beep would sound
212 4 5 6 7 8 9 10 11 12 13 14 15 16 17 18 19 20 21 22 23 24 25 26 27 28 29 30 31 32 33 34 35 36 37 38 39 40 41 42 43 44 45 46 47 48 49 50 51 52 53 54 55 56 57 58 59 60
Accepted Manuscript
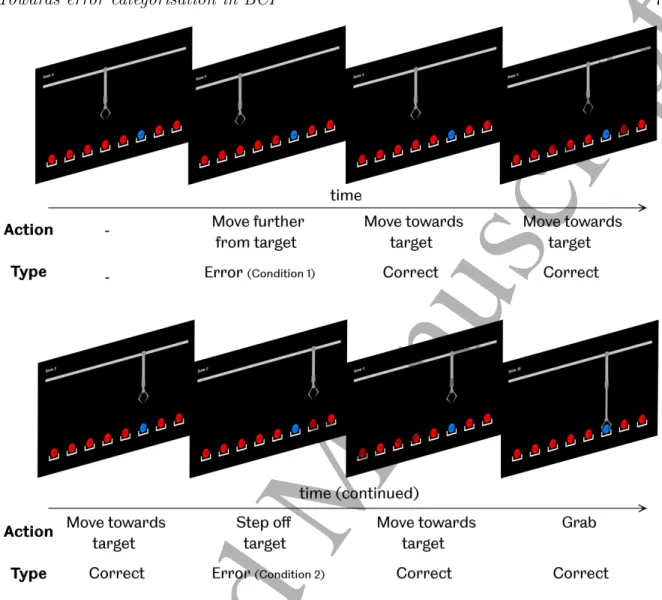
Figure 2. The Claw Observation Task (COT). Participants were asked to observe as a virtual robotic claw attempted to navigate towards, and grab, a blue target ball. If the claw was aligned over the target ball, possible actions were either to grab the ball or take 1 step away from the target. If the claw was not aligned over the target ball, possible actions were either to move 1 step towards the target, move 1 step further away from the target, or grab the red ball beneath the claw’s current position.
1 second before the next run began. Participants were asked to refrain from movement
213
and blinking during each run, but told that they could move and blink freely between
214
runs, while the screen was blank. This process repeated until the end of the block, with
215
each block lasting approximately 4 minutes. The score was reset to 0 at the beginning
216
of each new block.
217
The actions considered for this study were movement errors. Movements in which
218
the virtual robot was aligned over one of the red non-target balls, and moved further
219
away from the target, are hereafter referred to as “condition 1” errors. Movements
220
in which the virtual robot was aligned over blue target ball, but stepped off it, are
221
hereafter referred to as “condition 2” errors. A third error type was present in the task:
222 4 5 6 7 8 9 10 11 12 13 14 15 16 17 18 19 20 21 22 23 24 25 26 27 28 29 30 31 32 33 34 35 36 37 38 39 40 41 42 43 44 45 46 47 48 49 50 51 52 53 54 55 56 57 58 59 60
Accepted Manuscript
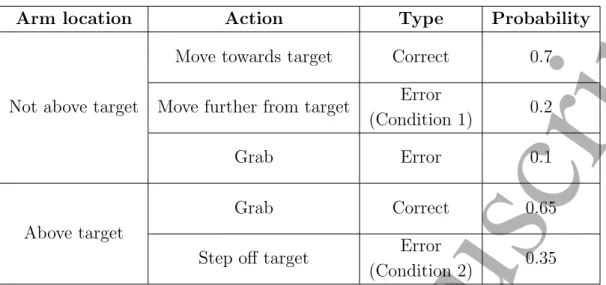
Arm location Action Type Probability
Not above target
Move towards target Correct 0.7 Move further from target Error 0.2
(Condition 1)
Grab Error 0.1
Above target
Grab Correct 0.65
Step off target Error 0.35 (Condition 2)
Table 1. Action probabilities for the Claw Observation Task. Note that correct actions and grabbing errors were not considered as a part of this study, as the robot would always have information about whether it had performed a lateral movement or a grab action.
a “grab error”, when the robot grabbed a non-target ball. These errors occurred from a
223
different type of movement than condition 1 and 2 errors, which both occurred as a result
224
of lateral movements. The robot would always have information about whether it had
225
made a lateral movement or a grab action. As such, in a BCI application, there would
226
be no need to differentiate grab errors against other error types using EEG. Standard
227
error detection applied following a grab action would be enough to identify them. For
228
this reason, grab errors were not considered as a part of this study. The score was
229
only updated after a “grab” action, and not after lateral movements (including either
230
“condition 1” or “condition 2” errors), therefore no points were directly gained or lost
231
as a result of either error condition. Considering this, together with the fact that each
232
error was of the same magnitude (1 step), we considered them to be of similar severity.
233
Participants were asked to observe blocks, with breaks of as long as they wished
234
between blocks, until they reported their concentration levels beginning to decrease.
235
Most participants observed 6 blocks of trials. However, four participants observed 3-5
236
blocks, and three participants observed 7-8 blocks.
237
2.3. Data Analysis
238
For both tasks, EEG data were first resampled to 64Hz. In order to do this trials were
239
first upsampled, then filtered using a least squares linear phase anti-aliasing FIR filter
240
with a lowpass cutoff of 32Hz. The filtered data were then downsampled by averaging
241
across data points, and initial data points from the output of filtering were removed to
242
compensate for the delay introduced by the linear phase filter. After resampling, data
243
were band-pass filtered from 1Hz to 10Hz, as ErrP components have been shown to
244
occur at low frequencies [1, 2]. Event related spectral perturbation plots confirmed that
245 4 5 6 7 8 9 10 11 12 13 14 15 16 17 18 19 20 21 22 23 24 25 26 27 28 29 30 31 32 33 34 35 36 37 38 39 40 41 42 43 44 45 46 47 48 49 50 51 52 53 54 55 56 57 58 59 60
Accepted Manuscript
activity for these tasks occurred predominantly in low frequencies (see Supplementary
246
Figure 1). For the EADT, trials were included in cases where the error was followed by a
247
secondary mouse click to indicate the participant’s awareness of their error. Trials were
248
extracted from a time window of -300ms to 700ms, relative to the commission of each
249
error (i.e. the initial, erroneous mouse click). Previous literature has shown evidence
250
that participants’ EEG may show signs of an error response before they commit the error
251
[12]. As such, the EADT time window began before error commission. Errors of which
252
the participants were unaware were not considered as part of the main investigations
253
of this study. As the COT involved errors committed by the machine, rather than the
254
human, it would not have been pertinent to consider signals prior to error commission.
255
Therefore, for the COT, trials were extracted from a time window of 0ms to 1000ms,
256
relative to the movement of the virtual robot. Each extracted error trial was baseline
257
corrected relative to a period of 200ms immediately before the presentation of its related
258
stimulus. Artefact rejection was performed by discarding any trials in which the range
259
between the highest and lowest amplitudes, in any channel, was greater than 100µV. In
260
EADT data, a mean of 1.9 colour condition trials and a mean of 3.0 repeat condition
261
trials were rejected per participant, from overall means of 22.2 and 32.5 trials per
262
participant for the two conditions respectively. In COT data, a mean of 2.0 trials from
263
condition 1 and a mean of 0.7 trials from condition 2 were rejected per participant, from
264
overall means of 48.8 and 23.4 trials per participant for the two conditions respectively.
265
Further to this, independent component analysis (ICA) was performed on the pooled
266
trials from all participants combined, for each task. Components resembling EOG
267
artefacts, as identified by visual inspection of topographic maps, were filtered out of
268
the data. Thus, one component was removed from the data related to each task, from a
269
total of 64 components for the EADT and 20 components for the COT. The remaining
270
components for each task were then recombined.
271
Grand average time domain ErrP data were plotted using the extracted trials,
272
showing the mean voltage ± 1 standard error of the following comparisons: EADT
273
colour condition vs repeat condition in young adults, EADT colour condition vs repeat
274
condition in older adults, and COT condition 1 vs condition 2 in all participants. A
275
small number of trials were excluded from the grand average time domain plots for the
276
EADT, where the initial click had occurred at least 550ms after the presentation of
277
the stimulus. This was due to the fact that longer reaction times could result in the
278
presentation of stimulusn+1, which could occur 1250ms after stimulusn in the EADT,
279
occurring within the time window (-300ms to 700ms, relative to the click) of stimulusn,
280
and so the inclusion of these trials could have contaminated the late part of the grand
281
average data with responses to these following stimuli. In total, 14 out of 717 colour
282
condition trials and 12 out of 1181 repeat condition trials were excluded from these plots
283
for this reason.
284
Peak analysis was performed in order to identify the latencies at which ERN and
285
Pe occurred in the ErrP data. ErrP signals are known to be associated with midline
286
electrodes [8]. Visual inspection of time domain ErrP and topographical plots showed
287 4 5 6 7 8 9 10 11 12 13 14 15 16 17 18 19 20 21 22 23 24 25 26 27 28 29 30 31 32 33 34 35 36 37 38 39 40 41 42 43 44 45 46 47 48 49 50 51 52 53 54 55 56 57 58 59 60
Accepted Manuscript
high positive Pe activity around the central midline across all tasks and age groups,
288
with the most notable amplitude difference between the classes being visible in Cz time
289
domain data. As such, electrode site Cz was chosen as the most suitable channel for
290
peak analysis for this study. In each task, this peak analysis was carried out on the
291
grand average ErrP waveform related to each error condition, and also for the grand
292
average ErrP of all trials of the two error conditions pooled together. In the EADT,
293
the analysis was carried out seperately for each age group. For each group, the data
294
were first averaged, and then peaks were identified in the resultant waveform. The ERN
295
was identified as most prominent negative peak, and Pe as the highest positive peak,
296
occurring in specific time windows. Time windows for ERN were -100ms to 200ms in
297
the EADT, and 0ms to 300ms in the COT. Time windows for Pe were 0ms to 400ms in
298
the EADT, and 100ms to 600ms in the COT. These time windows were selected based
299
on a visual inspection of the time-domain data; ERN windows started slightly before the
300
start of the negative deflection in grand average plots and centred on the negative peaks,
301
and Pe windows began just before the start of the positive deflection and ended once
302
amplitudes had returned approximately to baseline levels. As discussed earlier in this
303
section, evidence has shown that some participants may show signs of an error response
304
before they commit the error [12], hence the ERN time window in the EADT beginning
305
100ms prior to error commission. To check for statistically significant differences in
306
peak latencies across error conditions, the same peaks were identified in the average
307
time domain data for each individual participant with at least 12 trials per condition
308
and at least 40 trials in total, as previous literature has suggested that a minimum of 12
309
trials are required to achieve a reasonable level of temporal stability of ERN and Pe, and
310
that temporal stability increases with the number of trials [20]. Wilcoxon signed-rank
311
tests were then carried out on these data, comparing the latencies identified in each of
312
these participants’ average time domain waveforms for the two conditions. To check
313
for statistically significant differences in peak amplitude, the amplitude was calculated
314
in each of these participants’ average waveforms for each condition, in a 50ms window
315
surrounding the ERN and Pe peaks identified in grand average data (from peak -25ms to
316
peak + 25ms). Wilcoxon signed-rank tests were carried out to compare these amplitudes.
317
Furthermore, the build-up rate of the Pe was calculated for the average waveform of each
318
participant, in each error condition, for both tasks. This was achieved by performing a
319
linear regression on a time window, 100ms in duration, ending at the identified Pe peak.
320
This gives an indication of the rate at which the amplitude is increasing up to the peak.
321
Wilcoxon signed-rank tests were carried out to check whether the build-up rates of the
322
different error conditions varied in a statistically significant way.
323
Topographical maps were then plotted for each error condition, using the same
324
time windows. All topographical maps for a given task used the same scale, from the
325
minimum value to the maximum values across all grand averages.
326
While the main focus of this study was on errors of which the participants were
327
aware, a brief analysis was carried out to compare the number of “aware errors” (errors
328
followed by an awareness click) vs “unaware errors” (errors not followed by an awareness
329 4 5 6 7 8 9 10 11 12 13 14 15 16 17 18 19 20 21 22 23 24 25 26 27 28 29 30 31 32 33 34 35 36 37 38 39 40 41 42 43 44 45 46 47 48 49 50 51 52 53 54 55 56 57 58 59 60
Accepted Manuscript
click) in the EADT. The percentage of errors of which each participant was aware was
330
calculated for each error condition in each task. Wilcoxon signed-rank tests were carried
331
out in order to check whether there was any significant difference between awareness
332
rates for the various conditions.
333
2.4. Classification
334
Broadly, the same classification protocol was followed for all participants of both tasks.
335
However, different time windows were used to extract features for the two tasks. The
336
protocol is described in this section.
337
2.4.1. Preprocessing 20 electrode channels were available in the COT data (F7, F3,
338
Fz, F4, F8, FC1, FC2, T7, C3, Cz, C4, T8, CP1, CP2, P3, Pz, P4, PO7, PO8, and Oz).
339
As such, these 20 channels were used for single-trial classification of the both tasks. As
340
with the neurophysiological analysis, data for classification were resampled to 64Hz and
341
band-pass filtered between 1Hz and 10Hz. In the EADT, trials were extracted from
342
-100ms to 400ms, relative to the commision of errors (i.e. the erroneous click), in cases
343
where the participants showed awareness of the error. In the COT, trials were extracted
344
from 100ms to 700ms, relative to the virtual robot’s movement. These time windows
345
were selected based on visual inspection of grand average time domain data for each
346
task, aiming to encapsulate the areas which indicated differences between the amplitudes
347
of responses to the two conditions. Trials were baseline corrected to a period of 200ms
348
immediately before presentation of the stimulus, and artefact rejection was performed
349
to remove any trials with a range of greater than 100µV between the highest and lowest
350
amplitude in any of the channels being used for classification. After this, remaining
351
EOG artefacts were cleaned using ICA, as previously described in section 2.3.
352
As discussed in section 2.3, temporal stability of the ERN and Pe have been shown
353
to increase with the number of trials, with a minimum of 12 trials being recommended
354
to achieve a reasonable level of stability [20]. As such, for the purpose of single-trial
355
classification, we only included participants who had generated at least 12 trials per
356
error condition, and a minimum of 40 trials overall.
357
Due to the experimental setup of the EADT, which involved participants clicking a
358
mouse to confirm error awareness, motor movements would sometimes occur less than
359
400ms after error commission, i.e. within the classification time window. As such, it
360
was important to ensure that the classification was based on error responses rather
361
than sensorimotor rhythms. To this end, two analyses were carried out on the latency
362
between error commission and awareness confirmation in the various error conditions.
363
Firstly, for each participant, a Fisher’s exact test was carried out on the number of trials
364
that did contain awareness confirmation within the time window used for classification
365
vs the number that did not, in each of the two error conditions. This test was to check,
366
for each participant, whether significant classification could feasibly be achieved based
367
on the presense or absence of sensorimotor rhythms. Secondly, for each participant in
368 4 5 6 7 8 9 10 11 12 13 14 15 16 17 18 19 20 21 22 23 24 25 26 27 28 29 30 31 32 33 34 35 36 37 38 39 40 41 42 43 44 45 46 47 48 49 50 51 52 53 54 55 56 57 58 59 60
Accepted Manuscript
each task, Welch’s t-test was carried out, comparing the latencies at which participants
369
confirmed their error awareness, between the two error conditions. The latencies of
370
mouse clicks, confirming error awareness, were included in the t-test if they occurred
371
within the classification time window (-100ms to 400ms). Clicks outside this window
372
were ignored as they were not deemed to have a potential effect on classification.
373
The t-test was automatically marked as not significant if there were no awareness
374
confirmations within the classification epoch. The purpose of this test was to act as
375
a guide, for each participant, as to whether significant classification could feasibly have
376
been achieved based on differences in the time at which awareness-based sensorimotor
377
rhythms occurred. We were mindful that the classification results of this study could
378
have been unfairly biased if we had included any participants for whom classification may
379
have been possible due to differences between motor signals across the two conditions.
380
Therefore, participants for whom a significant result (p <0.05) was recorded, in either
381
the Fisher’s exact test or the t-test, were discarded from the classification phase.
382
After preprocessing, 25 participants remained to be used in the classification phase
383
from the EADT (20 young, 5 older), and 14 remained from the COT (8 asked to count
384
errors, 6 not asked to count errors).
385
2.4.2. Feature Extraction Our EEG data, having been resampled at 64Hz, contained
386
33 time points per trial in the EADT and 40 time points per trial in the COT. If we
387
were to consider all available time domain data, there would have been a total of 660
388
features (20 channels×33 time points) or 800 features (20 channels×40 time points) to
389
describe each trial. Although we employed a minimum cutoffs of 12 trials per condition
390
and 40 overall trials, many participants still had relatively few trials per class. With the
391
number of features given by the full time domain data greatly outweighing the number
392
of trials per condition, it was clear that the curse of dimensionality could cause problems
393
if we attempted to classify based on all available time domain data [21].
394
Our classification was performed using stepwise linear discriminant analysis
395
(SWLDA), as described in section 2.4.3. However, the feature selection inherent in
396
SWLDA is relatively sophisticated, and less complex methods are known to be less
397
susceptible to overfitting [22]. Therefore, we opted to reduce the dimensionality by
398
using a simpler first step for preliminary feature extraction. This allowed the SWLDA
399
to be applied to a small number of highly discriminative selected features.
400
For each participant, the preliminary step was carried out as follows: For each
time-401
domain feature (i.e. each time point in each channel), there were a set of training data
402
points. Each point had an amplitude and an associated class label. A linear correlation
403
coefficient was calculated between these amplitudes and class labels, resulting in each
404
feature having an associated correlation coefficient. The correlation coefficients acted
405
as a simple indication of how strongly related the amplitude was to the class labels in
406
a given feature, and thus how separable the classes may be based on the amplitude. In
407
each channel, the feature with the largest absolute correlation coefficient was selected.
408
This meant that each trial was represented by 20 features.
409 4 5 6 7 8 9 10 11 12 13 14 15 16 17 18 19 20 21 22 23 24 25 26 27 28 29 30 31 32 33 34 35 36 37 38 39 40 41 42 43 44 45 46 47 48 49 50 51 52 53 54 55 56 57 58 59 60
Accepted Manuscript
2.4.3. Stepwise Linear Discriminant Analysis Implementation In order to classify the
410
data based on the most pertinent subset of the extracted features, SWLDA was chosen
411
as our classification approach, since it has previously been shown to perform well in
412
feature selection and classification of EEG data [23, 24, 25]. Stepwise regression was
413
performed to select which features would be included in the model. Initially, an empty
414
model was created. At each step, a regression analysis was performed on models with
415
and without each feature, producing an F-statistic with a p-value for each feature. If
416
the p-value of any feature was < 0.025, the feature with the smallest p-value would
417
be added. Otherwise, if the p-value of any features already in the model had risen to
418
>0.075 at the current step, the feature with the largest p-value would be removed from
419
the model. This process continued until no feature’s p-value reached the thresholds for
420
being added to, or removed from, the model. If no features were added to the model at
421
all, a single feature with the smallest p-value would be selected. Training and test trials
422
were then reduced to the selected features. The class with the fewest training trials was
423
oversampled in order to ensure that training occurred with an equal number of trials
424
per class. A linear classification model was then trained and tested.
425
All classifiers were trained and tested using leave-one-out cross validation. For
426
each iteration, one trial was selected as the test sample, and all the other trials were
427
used as the training samples. Feature extraction and training of the stepwise linear
428
model were then performed on the training samples. The model was then tested on
429
the test sample. This process was repeated until each trial had been selected as the
430
test sample. To test statistical significance of the classification, a right-tailed Fisher’s
431
exact test was performed on the confusion matrix of each participant’s results. As the
432
individual participants were independent, no p-value adjustments were necessary [26].
433
Therefore, classification for an individual was deemed to be significant if the p-value
434
was less than 0.05. In order to test the significance at a group level, individual p-values
435
were combined into a group p-value using Fisher’s method [27, 28]. To test whether
436
there was any difference in the efficacy of the classification strategy across age groups,
437
Welch’s t-test was carried out comparing the overall accuracies of all young adults with
438
those of older adults in the EADT.
439
3. Results
440
3.1. Neurophysiological Analysis of Error-Related Potentials
441
Peak analysis was used to identify ERN and Pe latencies based on the grand average
442
Cz time domain waveform for each combination of task, condition, and age group. The
443
identified latencies are shown in Table 2.
444
Wilcoxon signed-rank tests were carried out to check for statistically significant
445
differences in the ERN and Pe amplitudes and latencies generated in response to the
446
different error conditions, as discussed in section 2.3. The results of these tests are
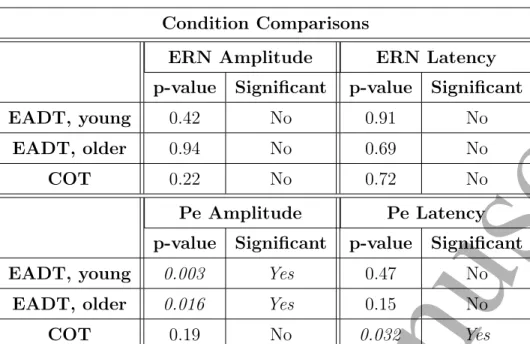
447 shown in Table 3. 448 4 5 6 7 8 9 10 11 12 13 14 15 16 17 18 19 20 21 22 23 24 25 26 27 28 29 30 31 32 33 34 35 36 37 38 39 40 41 42 43 44 45 46 47 48 49 50 51 52 53 54 55 56 57 58 59 60
Accepted Manuscript
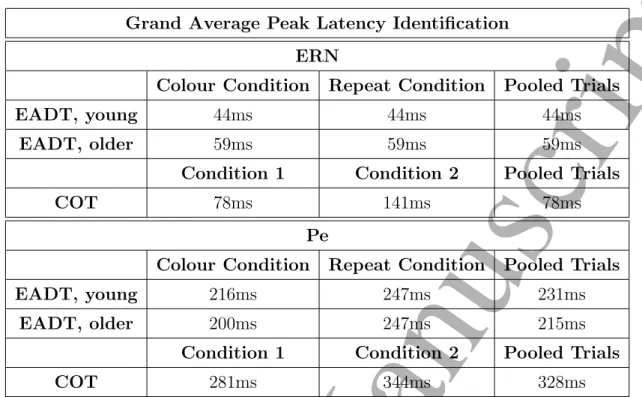
Grand Average Peak Latency Identification ERN
Colour Condition Repeat Condition Pooled Trials
EADT, young 44ms 44ms 44ms
EADT, older 59ms 59ms 59ms
Condition 1 Condition 2 Pooled Trials
COT 78ms 141ms 78ms
Pe
Colour Condition Repeat Condition Pooled Trials
EADT, young 216ms 247ms 231ms
EADT, older 200ms 247ms 215ms
Condition 1 Condition 2 Pooled Trials
COT 281ms 344ms 328ms
Table 2. ERN and Pe latencies, relative to error commission, as identified by peak analysis on the grand average channel Cz time domain waveform. The most prominent negative peak, between -100ms and 200ms in the EADT, or between 0ms and 300ms in the COT, relative to error commission, was selected as the ERN. The highest positive peak, between 0ms and 400ms in the EADT, or between 100ms and 500ms in the COT, relative to error commission, was selected as the Pe.
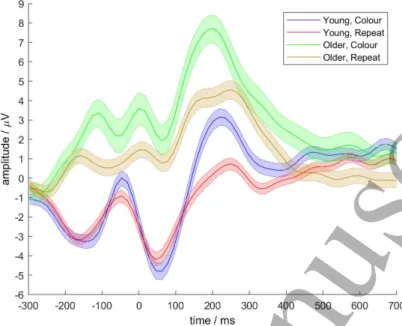
3.1.1. Error Awareness Dot Task In the grand average ErrP of young adults in the
449
EADT, responses to both conditions showed ERN with latencies of 44ms, as can be
450
seen inFigure 3(blue and red lines). Wilcoxon signed-rank test showed no significant
451
difference between the amplitudes of these ERNs (see Table 3), and showed no
452
significant difference between the ERN latencies related to the two conditions, based
453
on peaks identified in Cz data of each participant’s average waveform (p = 0.42).
454
However, there was a clear difference between the error conditions in the Pe. While
455
the latencies of the Pe in response to the two conditions showed no significant difference
456
(p= 0.47), the amplitudes of the Pe were increased in the colour condition, compared
457
to the repeat condition (p= 0.003). The build-up rate of the Pe was also greater in the
458
colour condition than the repeat condition, and a Wilcoxon signed-rank test showed that
459
this distinction was statistically significant (p= 0.001). Topographical maps confirmed
460
negative fronto-central activity during the ERN, and positive centro-parietal activity
461
during the Pe, in response to both error conditions, as shown inFigure 4 a, b, e, and
462
f.
463
Participants of all ages indicated awareness of a higher proportion of colour
464
condition errors (mean 89.3%, SD 17.7%) than repeat errors (mean 76.4%, SD 23.5%).
465
A Wilcoxon signed-rank test showed that this difference was significant (p= 8.7×10⁻⁸).
466
In the older adults’ EADT data, early positivity stalls the ERN, and some
467 4 5 6 7 8 9 10 11 12 13 14 15 16 17 18 19 20 21 22 23 24 25 26 27 28 29 30 31 32 33 34 35 36 37 38 39 40 41 42 43 44 45 46 47 48 49 50 51 52 53 54 55 56 57 58 59 60
Accepted Manuscript
Condition Comparisons
ERN Amplitude ERN Latency
p-value Significant p-value Significant
EADT, young 0.42 No 0.91 No
EADT, older 0.94 No 0.69 No
COT 0.22 No 0.72 No
Pe Amplitude Pe Latency
p-value Significant p-value Significant
EADT, young 0.003 Yes 0.47 No
EADT, older 0.016 Yes 0.15 No
COT 0.19 No 0.032 Yes
Table 3. Wilcoxon signed-rank test results from comparisions of peak amplitudes and latencies of colour condition vs repeat condition (EADT) and condition 1 vs condition 2 (COT). Comparisons were performed at ERN and Pe sites, in young adults and older adults, using electrode site Cz. Amplitude comparisons were based on the mean amplitude recorded, for each subject, in ERN and Pe time windows 50ms in duration, from -25ms to 25ms relative to the peak latencies identified by grand average peak analysis. Latency comparisons were based on the peak latencies identified from each participant’s average time domain data for each condition.
differences between the error conditions can be seen in the time domain data prior
468
to error commission, as shown in Figure 3 (green and brown lines). However, the
469
difference between responses to the conditions was not found to be significant in older
470
adults at the ERN. As with younger adults, the latencies of the ERN and Pe showed
471
no significant difference (p = 0.69 and p = 0.15, respectively). While the build-up
472
rate of the Pe was appeared to be steeper in response to the colour condition than
473
the repeat condition, a Wilcoxon signed-rank test did not find this to be significant in
474
older EADT participants (p = 0.25). Again, the most notable difference between the
475
two error conditions was the greater amplitude of the Pe in the colour condition, as
476
compared to the repeat condition (p= 0.016).
477
Both ERN and Pe peaks were observed to be more positive in older adults than
478
young adults, in response to both error conditions. Welch’s t-tests confirmed that that
479
these age-related amplitude differences were statistically significant (p= 2.1×10⁻¹⁵ for
480
colour condition related ERN amplitudes, p = 5.4×10⁻⁸
for colour condition related
481
Pe amplitudes, p = 3.1 ×10⁻²⁰
for repeat condition related ERN amplitudes, and
482
p= 5.4×10⁻¹³ for repeat condition related Pe amplitudes).
483
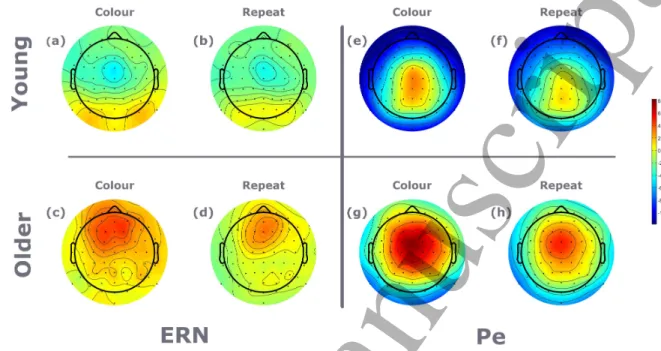
The typical fronto-central negativity cannot be identified by visual inspection of
484
the topographical maps of the ERN in response to either error condition for older
485
adults’ EADT data (Figure 4 c-d). A posterior-anterior shift in aging (PASA) has
486 4 5 6 7 8 9 10 11 12 13 14 15 16 17 18 19 20 21 22 23 24 25 26 27 28 29 30 31 32 33 34 35 36 37 38 39 40 41 42 43 44 45 46 47 48 49 50 51 52 53 54 55 56 57 58 59 60
Accepted Manuscript
Figure 3. Grand average time domain EADT data at electrode site Cz. Time shown is relative to error commission. Central lines represent mean signals. Shaded areas cover 1 standard error. Blue lines show colour condition data from young adults. Red lines show repeat condition data from young adults. Green lines show colour condition data from older adults. Brown lines show repeat condition data from older adults.
been reported in previous literature [29, 30] and is evident here in the Pe related to
487
both conditions of the EADT. As discussed previously, the most positively active areas
488
during the Pe are centro-parietal in young adults, as shown in Figure 4 e-f. In older
489
adults, this shifts toward more fronto-central activity, in both the colour condition and
490
the repeat condition, as can be seen in Figure 4 g-h. Indeed, the electrode sites
491
with the highest grand average Pe amplitudes in young adults were CPz & Cz for the
492
colour condition, and CPz & Pz in the repeat condition. In older adults, the highest
493
grand average Pe amplitudes were found at electrode sites FCz and FC1, for both error
494
conditions.
495
Across all EADT participants, mean amplitudes for individual channels in the
496
selected time windows ranged from −11.1µV to 8.1µV, and their associated standard
497
deviations ranged from 0.04µV to 1.3µV. Further topographical maps showing the
498
standard deviation from the mean at each channel in the EADT are shown in
499
Supplementary Figure 3a-h.
500
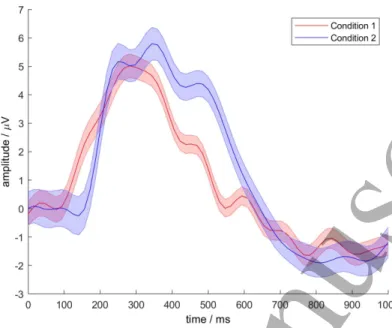
3.1.2. Claw Observation Task Time domain data related to responses to the COT can
501
be seen in Figure 5. Here, no statistically significant difference was found between
502
either the latency or amplitude of the ERN (p = 0.72 and p = 0.22, respectively). In
503
contrast to the EADT, neither the amplitude of the main Pe peak, nor the build-up rate
504
of the Pe showed signifigant differences (p= 0.19 and p= 0.60, respectively). However,
505
the latencies of the Pe peaks, at their highest points, were found to be significantly
506 4 5 6 7 8 9 10 11 12 13 14 15 16 17 18 19 20 21 22 23 24 25 26 27 28 29 30 31 32 33 34 35 36 37 38 39 40 41 42 43 44 45 46 47 48 49 50 51 52 53 54 55 56 57 58 59 60
Accepted Manuscript
Figure 4. Grand average topographical maps of EADT data. Maps were plotted based on a 50ms window surrounding the peaks identified as ERN and Pe from grand average data across all participants. Plots shown represent (a) ERN in the colour condition in young adults, (b) ERN in the repeat condition in young adults, (c) ERN in the colour condition in older adults, (d) ERN in the repeat condition in older adults, (e) Pe in the colour condition in young adults, (f) Pe in the repeat condition in young adults, (g) Pe in the colour condition in older adults, and (h) Pe in the repeat condition in older adults.
different (p = 0.032), with the Pe in responses to condition 2 peaking later than that
507
related to condition 1.
508
A secondary component of the Pe also appeared to be present in the grand average
509
COT data, and appeared to be more prominent in response to condition 2 than condition
510
1, followed by a difference in grand average amplitudes. We identified that the maximum
511
difference here occurred at 538ms (see Supplementary Figure 4 for illustration), and
512
performed a further Wilcoxon signed-rank test on the amplitudes of the two conditions
513
in the 50ms window surrounding this latency. The difference in amplitudes at this point
514
was found to be statistically significant (p= 6.1×10⁻⁴).
515
Topographical maps showed broad, slightly negative amplitudes across the brain
516
during the ERN of the COT, in response to both error conditions, as shown in Figure
517
6 a and c. Slightly more positive amplitudes can be seen in fronto-central regions in
518
response to condition 1. During the Pe, strong positive activity can be seen in central
519
and centro-parietal regions, as shown inFigure 6 b and d.
520
Mean amplitudes for individual channels in the time window ranged from−1.1µV to
521
5.4µV, and their associated standard deviations ranged from 0.01µV to 0.8µV. Further
522
topographical maps showing the standard deviation from the mean at each channel in
523 4 5 6 7 8 9 10 11 12 13 14 15 16 17 18 19 20 21 22 23 24 25 26 27 28 29 30 31 32 33 34 35 36 37 38 39 40 41 42 43 44 45 46 47 48 49 50 51 52 53 54 55 56 57 58 59 60
Accepted Manuscript
Figure 5. Grand average time domain COT data at electrode site Cz. Time shown is relative to the erroneous movement of the robot. Central lines represent mean signals. Shaded areas cover 1 standard error. Red line shows condition 1 data from all participants. Blue line shows condition 2 data from all participants.
the COT are shown in Supplementary Figure 3i-l.
524
Figure 6. Grand average topographical maps of COT data. Maps were plotted based on a 50ms window surrounding the peaks identified as ERN and Pe from grand average data across all participants. Plots shown represent (a) ERN in the condition 1, (b) ERN in the condition 2, (c) Pe in condition 1, and (d) Pe in condition 2.
4 5 6 7 8 9 10 11 12 13 14 15 16 17 18 19 20 21 22 23 24 25 26 27 28 29 30 31 32 33 34 35 36 37 38 39 40 41 42 43 44 45 46 47 48 49 50 51 52 53 54 55 56 57 58 59 60
Accepted Manuscript
3.2. Classification of EADT Errors
525
The classification accuracies achieved for each individual participant in the EADT are
526
shown in Table 4. The mean overall accuracy for all EADT participants was 65.2%.
527
Amongst young adults, mean overall accuracy was 63.7%, and for older adults it was
528
71.3%. Mean colour condition accuracy was 60.4% for all participants, 59.4% for young
529
adults, and 60.4% for older adults. The mean accuracy of the repeat condition was
530
67.6% for all participants, 66.0% for young adults, and 74.0% for older adults. Trained
531
classification models for the EADT included a mean of 3.7±1.3 features. Generally,
532
more features were selected from posterior regions of the brain than anterior regions,
533
echoing the heightened activity, varying in amplitude across the two classes, that was
534
shown in these regions. A Wilcoxon signed-rank test was used to compare the average
535
number of features selected per channel, for each participant, in more anterior channels
536
(fronto-central channels and further anterior) against those in more posterior channels
537
(centro-parietal channels and further posterior). The results showed the average number
538
of selected features per channel was significantly higher in the posterior region compared
539
to those in the anterior region (p= 4.9×10⁻⁴
). At an individual level, features were often
540
selected where the subject-average amplitude displayed a relatively large differences
541
between the two classes. Supplementary Figure 5 contains a further breakdown of
542
feature selection rates, including an example for an individual EADT participant.
543
Statistically significant separation of the error conditions (p < 0.05) was found,
544
using Fisher’s exact tests, for 17 of the 25 participants overall (68.0%). Statistical
545
significance was achieved for 13 of the 20 young adults (65.0%), and 4 of the 5 older
546
adults (80.0%). At a group level, the classification results were found to be statistically
547
significant in each age group (p= 1.6×10⁻¹⁶
for young adults and p= 3.2×10⁻¹¹ for
548
older adults) and overall (p= 2.7×10⁻²⁵ ).
549
The overall accuracies of young adults were compared with those of older adults
550
using Welch’s t-test. The result did not show any significant difference (p= 0.16). While
551
Welch’s t-test is considered to be reliable in dealing with unequal sample sizes [31, 32],
552
it should be noted that only 5 older adults remained in the single-trial classification,
553
which may mean that this finding should be treated with a measure of caution.
554
3.3. Classification of COT Errors
555
The classification accuracies achieved for each individual participant in the COT are
556
shown in Table 5. The mean overall accuracy for all COT participants was 65.6%.
557
Mean accuracy for condition 1 was 69.5%, and the mean accuracy for condition 2
558
was 57.4%. Welch’s t-test showed no significant difference in participants accuracy
559
depending on whether or not they were asked to keep count of the errors (p= 0.80, see
560
Supplementary Table 1). Trained classification models for the COT included a mean
561
of 2.9±1.5 features. At a population level, it was difficult to discern clear patterns of
562
which features were selected. However, as in the EADT, an individual level features
563
were often selected where there was a relatively large difference between the
subject-564 4 5 6 7 8 9 10 11 12 13 14 15 16 17 18 19 20 21 22 23 24 25 26 27 28 29 30 31 32 33 34 35 36 37 38 39 40 41 42 43 44 45 46 47 48 49 50 51 52 53 54 55 56 57 58 59 60
Accepted Manuscript
Age
Subject # Colour # Repeat Colour Repeat Overall Significant p-value Group Trials Trials Accuracy Accuracy Accuracy
Young 1 27 27 55.6% 48.1% 51.9% No 0.5 2 34 42 58.8% 69.0% 64.5% Yes 0.014 3 15 35 60.0% 74.3% 70.0% Yes 0.024 4 29 55 65.5% 70.9% 69.0% Yes 0.0014 5 21 26 57.1% 61.5% 59.6% No 0.16 6 30 38 50.0% 60.5% 55.9% No 0.27 7 14 31 42.9% 58.1% 53.3% No 0.60 8 17 57 58.8% 74.6% 71.1% Yes 0.012 9 41 53 64.3% 63.0% 63.5% Yes 0.0071 10 33 43 57.6% 65.1% 61.8% Yes 0.041 11 22 34 72.2% 70.6% 71.4% Yes 0.0017 12 26 42 50.0% 64.3% 58.8% No 0.16 13 32 51 75.0% 76.5% 75.9% Yes 4.5×10⁻⁶ 14 25 46 52.0% 76.1% 67.6% Yes 0.017 15 25 51 68.0% 72.5% 71.1% Yes 8.7×10⁻⁴ 16 20 29 55.0% 75.9% 67.3% Yes 0.029 17 30 30 46.7% 56.7% 51.7% No 0.50 18 42 45 61.9% 51.1% 56.3% No 0.16 19 33 58 66.7% 67.2% 67.0% Yes 0.0017 20 28 45 69.0% 64.4% 66.2% Yes 0.0049 Older 21 17 47 41.2% 61.7% 56.3% No 0.52 22 45 33 80.0% 81.8% 80.8% Yes 4.8×10⁻⁸ 23 21 47 76.2% 63.8% 67.6% Yes 0.0024 24 19 35 63.2% 80.0% 74.1% Yes 0.0021 25 13 46 61.5% 82.6% 78.0% Yes 0.0034
Young Mean 27.2 41.9 59.4% 66.0% 63.7% 65.0% Group p-value
SD 7.7 10.3 8.6% 8.3% 7.2% 1.6×10⁻¹⁶
Older Mean 23.0 41.6 64.4% 74.0% 71.3% 80.0% Group p-value
SD 12.6 7.0 15.3% 10.3% 9.8% 3.2×10⁻¹¹
All Mean 26.4 41.8 60.0% 67.6% 65.2% 68.0% Group p-value
SD 8.7 9.6 10.1% 9.1% 8.2% 2.7×10⁻²⁵
Table 4. Single-trial classification results of EADT data. Overall accuracy calculated as the percentage of trials, of either class, correctly classified. SD refers to standard deviation. The participant for whom the highest overall accuracy was achieved is highlighted in italics. Group p-values were calculated by combining p-values using Fisher’s method. 4 5 6 7 8 9 10 11 12 13 14 15 16 17 18 19 20 21 22 23 24 25 26 27 28 29 30 31 32 33 34 35 36 37 38 39 40 41 42 43 44 45 46 47 48 49 50 51 52 53 54 55 56 57 58 59 60
Accepted Manuscript
Subject # Condition 1 # Condition 2 Condition 1 Condition 2 Overall Significant p-value Trials Trials Accuracy Accuracy Accuracy
1 42 27 66.7% 63.0% 65.2% Yes 0.015 2 92 30 72.8% 53.3% 68.0% Yes 0.0088 3 69 22 58.0% 40.9% 53.8% No 0.63 4 43 23 65.1% 52.2% 60.6% No 0.13 5 46 29 73.9% 65.5% 70.7% Yes 8.2×10⁻⁴ 6 30 14 86.7% 64.3% 79.5% Yes 0.0011 7 48 18 79.2% 72.2% 77.3% Yes 1.8×10⁻⁴ 8 46 29 69.6% 62.1% 66.7% Yes 0.0069 9 49 21 77.6% 47.6% 68.6% Yes 0.036 10 33 19 63.6% 52.6% 59.5% No 0.20 11 34 21 58.8% 42.9% 52.7% No 0.56 12 39 26 64.1% 61.5% 63.1% Yes 0.038 13 44 13 70.5% 61.5% 68.4% Yes 0.040 14 32 22 65.6% 63.6% 64.8% Yes 0.032
Mean 46.2 22.4 69.4% 57.4% 65.6% 71.4% Group p-value
SD 16.4 5.4 8.0% 9.2% 7.6% 1.9×10⁻¹¹
Table 5. Single-trial classification results of COT data. Overall accuracy calculated as the percentage of trials, of either class, correctly classified. SD refers to standard deviation. The participant for whom the highest overall accuracy was achieved is highlighted in italics. The group p-values was calculated by combining p-values using Fisher’s method.
average amplitudes of the classes. Supplementary Figure 5 contains a further breakdown
565
of feature selection rates, including an example for an individual COT participant.
566
Statistically significant separation of the error conditions (p < 0.05) was found,
567
using Fisher’s exact tests, for 10 of the 14 participants (71.4%) in the COT. At a group
568
level, the classification results were found to be statistically significant (p= 1.9×10⁻¹¹ ).
569
4. Discussion
570
4.1. Distinctions in Responses by Condition and Age
571
Previous literature has shown that different tasks can elicit differing ErrP waveforms
572
[33]. In some cases, distinctions have been shown in ErrPs even when the errors are
573
committed during variants of the same task [34, 35]. Indeed, our findings are aligned
574
with those of the previous literature on this point. Interestingly, when comparing the
575
error conditions within each task, the key neurophysiological distinctions that we were
576
able to identify were found in different components of the ErrP for the two tasks in this
577
study.
578
In the EADT, the clearest distinction shown between the error conditions was
579
in the amplitude of the Pe. We witnessed greater amplitudes of Pe in the colour
580
condition than the repeat condition for both young and older adults. Previous studies,
581
including some which were based on error awareness tasks, have shown a diminished Pe
582 4 5 6 7 8 9 10 11 12 13 14 15 16 17 18 19 20 21 22 23 24 25 26 27 28 29 30 31 32 33 34 35 36 37 38 39 40 41 42 43 44 45 46 47 48 49 50 51 52 53 54 55 56 57 58 59 60