Europhys. Lett., 53(4), pp. 419–425 (2001)
Power law distribution of dividends in horse races
K. Parkand E. DomanyDepartment of Physics of Complex Systems, Weizmann Institute of Science Rehovot 76100, Israel
(received 8 August 2000; accepted 3 November 2000)
PACS.02.50.-r – Probability theory, stochastic processes, and statistics.
PACS.05.40.-a – Fluctuation phenomena, random processes, noise and Brownian motion. PACS.89.90.+n – Other topics of general interest to physicists.
Abstract. – We discovered that the distribution of dividends in Korean horse races follows a power law. A simple model of betting is proposed, which reproduces the observed distribution. The model provides a mechanism to arrive at the true underlying winning probabilities, which are initially unknown, in a self-organized collective fashion, through the dynamic process of betting. Numerical simulations yield excellent agreement with the empirical data.
During the past decade, power law distributions were discovered in a wide variety of phenomena. Quantitative analysis has been performed on distributions observed in diverse areas, such as fish school size [1], heart dynamics [2], frequency of jams in Internet traffic [3], size of war [4], scaling in currency exchange [5, 6] and stock market price changes [7, 8], just to cite from a random selection of disciplines.
In the physical sciences, power law scaling is usually associated with critical behavior or with scale free growth processes. A mechanism producing power law distributions has been found also in the study of stochastic processes involving multiplicative noise [9, 10].
Since the seminal work of Bak et al. [11], it has been tempting to try to connect such power laws with self-organized criticality (SOC). In existing models of SOC, such as sand-pile, sliding-block, forest-fire, evolution, etc., a dynamic process plays a central role, yielding avalancheswhose sizes follow a power law frequency distribution. Elucidating general mech-anisms underlying power law behaviors in biological and social sciences is a challenging task. We present here empirical evidence for a power law distribution in a new context; that of horse racing. We also propose a simple model to explain the phenomenon. We believe that the model is relevant beyond the specific context of horse racing, as it might explain how power law distributions emerge in social sciences, especially in a large assembly of interconnected human activities.
Although the mechanism of producing power laws is quite different, the problem and the proposed model have several similarities with those of foreign exchange [5, 6], stock market [7, 8], and the minority game [12]: many independent agents participate, and each makes decisions according to his own strategy, based on previous results. The activity results in a change of an index, such as price, exchange rate, and dividend, which is known to all.
c
We studied the distributions of the values of the winning dividends in horse races held from 1996 to 1999 in Korea, obtained from the database of the Korea Racing Association [13]. The dividend is determined in an interesting way in these races. Betting is open for a time interval before the race, during which people can bet on the horse of their choice. During the process of betting, ni, the total amount of money that has been bet so far on each horse i is displayed on a board, which is updated at time steps of 30 seconds. The dividend, fi, is determined at every time step according to the simple equation
fi= (1−r) Z
ni, Z≡
i
ni (1)
and is also displayed. Hereris a tax collected by the racing organization. Betting stops at a fixed time before the race. The final value reached byfi is the amount paid (per unit money invested) to a person who has picked the winning horse i. This kind of gambling is unique in that the dividend on each horse is determined only after the entire process of betting has been completed.
In general, a horse which is believed to have a high probability of winning, pi, yields a lower dividend than horses with little chance. Therefore it can be expected that races yielding higher dividends occur less often than those yielding lower ones, provided the bettors have reliable information on the horses.
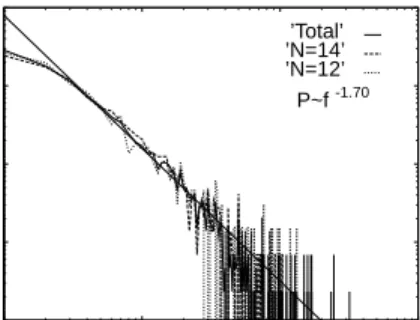
We collected and tabulated the values of the winning dividends; we defined bins limited by integer values of f (the first bin for 1 < f < 2, the second for 2 < f < 3, etc.), and evaluated the frequency of occurrence of the winning dividends in each bin. We found that over a considerable rangetheir distribution follows a power law,
P(f)∝f−x, x≈1.70, (2)
as shown in fig. 1. The value x≈1.70 was obtained by a best fit to the data in the range 2≤f ≤40. We plotted here the relative frequency of occurrence for all values of f, for races with N = 12 and N = 14 horses, as well as for the sum of all races, irrespective ofN. The database contains records of 1447 races with N = 14, 652 withN = 12; the number of races is considerably lower for other values of N, and hence the corresponding frequency plots are much noisier and not shown. For 8≤N ≤ 14 the distribution is effectively independent of the number of horses N. We look for models that reproduce the two main features of the empirical data: a) that the races yielding the lowest dividends occur most frequently, and b) the distribution has the form of a power law over a significant range off values.
We assume that the basic rule that governs people’s betting strategies is to pick at each moment t that horse for which the expectation value of the gain, fipi = (1−r)Zpi/ni, is maximal.
The simplest model we can think of assumes that there exists a fixed set of probabilitiespi (of horseiwinning the race). Assume that thesepi are accessible to everyone in the stadium and that all bettors use the same information and betting strategy. These assumptions define a dynamical betting process, which has a stable attractor: the state of equal constant gain for each horse, i.e., pifi =C. It is trivial to see that this situation is indeed stable against perturbations; e.g., increasingni/Z decreases the dividend of horse i, so that fipi decreases and at the next time steps no bets will be placed on horse i. This simplest model therefore yields the final dividends fi = C/pi, horse j will win the race with probability pj and the winning dividend will be fwinner = C/pwinner. If the winning probabilities are generated from any reasonable distribution, this simplest model fails to reproduce both aspects a) and b) mentioned above: the resulting dividend distribution has a peak at some intermediate
0.0001 0.001 0.01 0.1 1 1 10 100 1000 P(f) f ’Total’ ’N=14’ ’N=12’ -1.70 P~f
Fig. 1 – Number density distribution of the values of dividends in horse races in Korea from January 6, 1996 to December 19, 1999, for races withN= 12 andN = 14 horses, and for the sum of all races. A best fit for a power law is also shown.
f∗∼1/p∗ and we do not get the observed power law decay for largef. To obtain the power law distribution of dividends for larger f, we have to tune carefully the distribution from which the winning probabilities are selected for smallpi. Moreover, in order to have the peak at the lowestf, in a large fraction of the races there should be a most likely winner, whose chance of winning dominates all the other horses. However, nobody, especially no horse racing organization, would tolerate such a trivial race. Usually a rule ofhandicap is implemented to equalize the chance of winning for all the horses; the horses with better records carry heavier burdens than others in the race. The resulting difficulties of prediction are pointed out in ref. [14]. Although several kinds of information magazines are sold at the racing stadium which summarize the details of previous races, ground conditions, weather, handicap, harmony with jockey, etc., the expectations of the different experts are not consistent with each other for most races. Hence one cannot assume that there exists reliable information on the winning probabilities, which is shared and used by all bettors.
Nevertheless, our main conclusion, which will be substantiated later, is thatthere indeed exists a most-likely winner, in spite of the handicaps, even though the information is initially known to none. To explain this claim, we have to find out how a large fraction of the bettors identifies this likely winner in the absence of reliable information. And what kind of distribu-tion of probability of winning for each race will yield the empirical power law distribudistribu-tion of dividends?
To address these questions, we introduce a simple model of betting, in which people rely both on some initial naive guess and on the information displayed onthe board. There might be professional gamblers equipped with accurate information; they are, however, a small minority. Most bettors are amateurs who play the races just for their leisure and fun. For them the magazines are the only available prior information, and the dividends displayed on the board affect their decision considerably, since they reflect the information available to all other people, including the professionals. It is natural for this large majority of amateurs to regard the horse with the highestni as the best.
We therefore assume that initially people bet only on the basis of some naive expectations, based on the magazines, etc. We denote this initial naive guess of the probability that horse iwill win byp(0)i . For simplicity, betting is assumed to occur sequentially and with the same amount of money at each time step. Further, we assume that after every bet, the board is immediately updated. The followingbetting dynamicsis assumed and investigated: At timet,
the bettor views the information displayed on the board (fi(t)’s or, equivalentlyni(t)’s). The bettor uses this information to update his current estimates for the probabilities of winning,
Pi(t) =F[p(0)i , fi(t)], (3)
and places his bet on horsej, for which (at that time) the expected gain is maximal:
ni(t+ 1) =ni(t) +δi,j, (4)
where j is maxi fi(t)Pi(t). The dividends are updated on the board and at the next time step people bet using the modified probabilities and dividends, and so on. Due to the tax, the maximal gain may correspond to a dividend which is lower than unity. In such cases we add a restriction that moves the bet to the next sized gain. The results with and without this restriction do not yield noticeable difference in numerical simulations [15]. This process converges to a set of winning probabilitiesPi; the final assumption we take is that these are thetrue probabilities, according to which the winner is selected.
It is important to state that in all but a single special case simulations of the dynamic process described above converged to sets ofPi andfi such thatPifi = const, irrespectively of the modelsF and distributions of the initial probabilities that were used. However, finding a model which leads to the observed distribution of winning dividends is not an easy task.
The dynamic process described above is completely deterministic. The only stochastic components are that of initialization, i.e. when the initial probabilities p(0)i are drawn from some distributionQ(p(0)), and the final step of selecting the winning horse according to the fi-nal probabilitiesPi. The distribution of winning dividends is determined by these probabilities and is independent of the dynamic process that generated them.
We are left with the freedom of choosing a) the distributionQof the initialp(0)i and b) the model F, see eq. (3), used to update the probabilities. There are many plausible choices for Q. We do not know how the horse racing organization arranges the list of horses in each race from a pool of hundreds of horses; presumably the organizer himself does not have any idea of the probability distribution of winning. We hope to find a model which converges in a self-organizedway (i.e. through the betting dynamics, regardless of the distribution of initial probabilities), to a set ofPi which reproduce the observed power law distribution of winning dividends.
Numerical simulations. – Our simulations were done forN = 12 and 14 horses in each race. The value r = 0.2 was used for the tax. For each race we first generated a set of initial winning probabilities in the following way. A set ofN random independent numbers xi were generated from a normal distribution. The initial probabilities were determined by p(0)i =|xi|/i|xi|. Hereafter we will refer to this asthe primitive distribution.
Additive correction. – We analyzed various forms of the functionF[p(0)i , ni/Z]. We first tried an additive correction of the initial probability,
Pi= (1−λ)p (0)
i +λg(ni/Z)
1−λ+λig(ni/Z) , (5)
where λis a parameter that controls the weight given to the correction due to the updated dividends;g(x) is an increasing function ofx. We tried the form
and investigated three cases: α= 1,α >1, andα <1. Whenα= 1, the expected gain at timet is given by
fiPi= (1−r) (1−λ)Zp (0) i ni +λ . (7)
In the dynamics generated by this function the object to be maximized by the bettor depends only onfip(0)i , just as in the simplest model considered above, without corrections. Indeed we find convergence at long times to the same final state, withp(0)i /ni ≈const. Simulations with α= 1 and the primitive initial distribution forN = 12,14 horses yield dividend distributions that differ from the empirical observation [15]; a pronounced maximum is observed atf ≈5. On this basis we can rule out the additive model withα= 1.
For the case α >1 we found two regimes in our simulations. For λ >0.8 we found that after some transient always one horse dominates the betting; asni/Z increases, the increase ofPidominates the decrease offiand hence its expected gain increases. All people bet on the same horse: this situation does not lead to the observed distribution of dividends. For smaller values ofλ, increased betting on a horse decreases its expected gain, and the finalni/Z are again distributed so as to equalize the valuesfiPi. Our simulations with 0.0≤λ≤0.6 yielded results in qualitative agreement with the previous case, ofα= 1. In the intermediate region ofλ, the races fall into one of two classes: one won by the horse with the dominant bets,i.e., f ≈1, and the second won by other horses. The distribution of dividends for the second class becomes noisier and noisier asλgrows and finally forλ >0.8 it becomes discontinuous, so we are left with the first class.
For the last possibility, α <1, the gainfiPi is a monotonically decreasing function ofni. For increasingλthe values of theni’s become more and more uniform, tending to ni ∼1/N, and the corresponding distribution of dividends narrows, until atλ = 1 it reaches a delta-function with all dividends taking the value (1−r)N.
We thus conclude that the additive rule (5) with the simple form (6) forgdoes not produce the observed distribution of the winning dividends.
We now turn to amultiplicativerule, of the form Pi=p(0)i ·g(ni/Z)
j
p(0)j ·g(nj/Z) , (8)
again withg(x) =xα. It is easy to show thatαshould be less than unity; otherwise the horse with the initially maximal winning probability takes all the bets. Therefore we limited our simulations to 0≤α≤1.
We found that forα= 0 the distribution of winning dividends doesnotpeak in the lowest interval. The frequency of the lowest dividend increases withα. The best fits to the observed data were obtained usingαc= 0.63 and 0.65 forN= 12 andN= 14 horses, respectively. The results of our simulations, performed for these values ofα, are presented in fig. 2(a) and (b), together with the real data. In fig. 2(a), the simulation data are averaged over 10 samples of 5000 races withZ = 10000 for each race. The error bars have been estimated by the standard deviation. For a fixed value ofZ, dividends are found only at discrete values fn = rZ/n, with integer n. This makes the distribution of dividends discontinuous. Note that we have omitted the points of zero occurrence in fig. 2. In real situations the fluctuations inZ make the distribution continuous, and the tail is absorbed into the desired power law scaling in the entire range. We have verified that asZ is increased, the tail decreases, as is shown in
1e-05 0.0001 0.001 0.01 0.1 1 1 10 100 1000 P(f) f (a) Real data Simulation 0.0001 0.001 0.01 0.1 1 1 10 100 1000 P(f) f (b) Real data Z=10000 Z=50000
Fig. 2 – Number density distributions of real data and the best-fitted simulations, with (a)αc= 0.63 forN = 12 and (b)αc= 0.65 forN= 14. The simulation data are averaged over 10 samples of 5000 races. The error bars have been estimated by the standard deviation.
fig. 2(b); hence the long tail in the regionf >100 is a finite-size effect. The minimal value of P(f) is determined by the number of total races in the simulation.
The final distribution ofni’s for each race is such thatPifi≈const and hence
p(0)i 1/(1−αc/n) i ≈const. Thus from eq. (8) the self-organized probability of winning reduces to
Pi ∝p(0)i 1/(1−αc). (9)
This is an interesting result; it means that in the course of the betting dynamics, the probabil-ity of winning evolves in a way that enhances differences: the winning probabilities of initially better horses are much more increased and those of initially worse horses become even more suppressed. Thus, in the final states, there indeed exists a most likely winner whose probabil-ity of winning dominates those of all the other horses, giving rise to the observed maximum at the lowest bin of dividends.
To test the extent to which our results depend on the distribution of initial winning prob-abilities, we replaced the normal distribution for thexi (from which thep(0)i =xi/xi are constructed), by a uniform distribution 0≤xi ≤1. Simulations with this distribution and the multiplicative rule again yielded the observed distribution of dividends.
Detailed simulations with various initial distributions will be given elsewhere [15]. In general, the value of αc increases as the variance among the initial probabilities decreases. For bounded distributions, such as the uniform one, the best fits were found nearαc= 0.9.
We summarize and discuss the few assumptions that were made by our simple model of horse racing: i) The board of dividends is updated on-line and all bets are for the same amount. In fact betting is open for 30 minutes, during which the board is updated 60 times. The possible effects of having a finite number of updates, at discrete intervals, will be presented elsewhere [15]. ii) All bettors are rational and use the same optimal strategy. We did not allow any noise in the decision, such as that which may be introduced by random bettors. iii) All the bettors use the same initial guess for the winning probabilities.
We have reasons to believe that the amplifying mechanism described above, which is generated by the betting process, will reduce the effect of allowing noise into the initial guess. Nevertheless, an improved model should consider the effects of both kinds of “noise”. This is the strongest assumption.
There is an interesting analogy between this model and one of stock markets, in which traders are divided into the two classes,rational andnoisy[16]. We may also classify people intoprofessionals, who come with prior knowledge, and amateurs, who use only the informa-tion on the board. It is important to note that the role of the amateur is different from that of a noisy trader in stock market models; here the true probability of winning is determined through the decision of all the people, so that professionals alone cannot apply an optimal strategy.
∗ ∗ ∗
We thank I. Kanter for discussions; KP thanks H. Cho for teaching him about horse racing.
REFERENCES
[1] Bonabeau E.andDagorn L.,Phys. Rev. E,51(1995) R5220.
[2] Peng C.-K., Mietus J., Hausdorff J., Havlin S., Stanley H. E.andGoldberger A. L.,
Phys. Rev. Lett.,70(1993) 1343.
[3] Takayasu M., Takayasu H.andSato T.,Physica A,233(1996) 824. [4] Roberts D. C.andTurcotte D. L.,Fractals,6(1998) 351.
[5] Ghashghaie S., Breymann W., Peinke J., Talkner P.andDodge Y.,Nature,381(1996) 767.
[6] Galluccio S., Caldarelli G., Marsili M.andZhang Y.-C.,Physica A,245(1997) 423. [7] Mantegna R. N.andStanley H. E.,Nature,376(1995) 46.
[8] Bak P., Chen K., Scheinkman J. A.andWoodford M.,Ric. Economichi,47(1993) 3. [9] Levy M.andSolomon S.,Int. J. Mod. Phys. C,7(1996) 595.
[10] Amaral L. A. N., Buldyrev S. V., Havlin S., Salinger M. A.andStanley H. E.,Phys.
Rev. Lett.,80(1998) 1385.
[11] Bak P., Tang C.andWiesenfeld K.,Phys. Rev. Lett.,59(1987) 381. [12] Challet D.andZhang Y.-C.,Physica A,246(1997) 407;256(1998) 514.
[13] Data used here is available athttp://www.kra.or.kr.where 4283 races from January 6, 1996 to December 19, 1999 are collected.
[14] de Waal D. J.,S. Afr. Stat. J.,32(1998) 83. [15] Park K., in preparation.