Financial Services Commission
Annual Statistical Bulletin
2011
Financial Services Commission
Disclaimer
While all care has been taken in the preparation of this Statistical Bulletin, the Financial Services Commission does not, in any way whatsoever, warrant expressly or impliedly the accuracy and completeness of the contents of this Statistical Bulletin and shall not be liable for any loss or damage (including, without limitation, damages for loss of business or loss of profits) arising in contract, tort or otherwise suffered by any person/ entity relying on the information contained in this Statistical Bulletin or arising from any shortcoming, defect or inaccuracy, through inadvertence or otherwise.
The contents of this Statistical Bulletin are meant for information purposes only. The statistics collected through Statutory Returns and Surveys have been prepared as a general overview. The Financial Services Commission is in no way whatsoever providing financial or other professional advice through this Statistical Bulletin and none of its contents should be interpreted or relied on as such.
Any discrepancy may be brought to the notice of the Commission at: [email protected] .
The Financial Services Commission reserves the right to revise / amend any information published in this Statistical Bulletin. This Statistical Bulletin contains references to certain Acts of Parliament and secondary legislation and in the event of any discrepancy or inconsistency therein, the authoritative version of these Acts of Parliament or secondary legislation as published in the Government Gazette will prevail.
© 2011 Published by the Financial Services Commission, Mauritius.
Financial Services Commission
List of Acronyms
viii
FSC Codified List
ix
G
eneral Notes and Definitions
xii
1. INTRODUCTION 1
1.1. Introduction to FSC’s 9th Annual Statistical Survey 2010 2
1.2. Selected Economic Indicators of Mauritius 4
1.3. Highlights: Overview of Licensed Entities 5
1.4. New GBC 1’s & GBC 2’s Licensed in 2009-2010 8
1.5. FSC Surveyed Population Size and Response Rate 10
2. FINANCIAL PERFORMANCE OF RESPONDENTS 11
2.1 Overview 12
2.1.1 Financial Services Sector (excluding Companies holding
a Category 1 Global Business Licence) and Corporate and Trust Service Providers 12
2.1.2 Global Business Companies 13
3. SECTORAL OVERVIEW 17
3.1 INSURANCE AND OCCUPATIONAL PENSION SCHEMES 18
3.1.1. Insurers 19
3.1.1.1 New Business Breakdown for Long Term Insurance Business 20 3.1.1.2 Breakdown for Business in Force for Long Term Insurance Business 21 3.1.1.3 Breakdown for Business in Force for General Insurance Business 22 3.1.1.4 New Business breakdown for General Insurance Business 23
3.1.2 Insurance Brokers 24
3.1.3 Insured Pension Schemes and Superannuation Funds 25
3.1.3.1 Summary of Financial Performance of Insured Pension Schemes 25 3.1.3.2 Summary of Financial Performance of Superannuation funds
under Management by Insurers, Pension Scheme Managers and Pension Fund Administrators 27 3.1.4 Pension Fund Administrator (PFA) and Pension Scheme Management (PSM) 29
3.1.5 Actuarial Services 30
3.2 CAPITAL MARKETS 31
3.2.1 Overview of Stock Exchange of Mauritius 32
3.2.2 Foreign & Domestic Investment 34
3.2.3 Currency & Commodity Derivatives Market 35
3.2.4 Capital Market Operators 36
3.2.4.1 Investment Dealers 36
3.2.4.2 Investment Advisers 37
3.2.4.3 Assets Management 38
3.2.4.4 CIS Managers 39
3.2.4.4.1 Net Assets of Investment Schemes at Close of Quarters 2009- 2010 40
3.2.4.5 Custodian Services 41
3.2.4.6 Registrar and Transfer Agents 42
Financial Services Commission
3.3 SPECIALISED FINANCE INSTITUTIONS AND OTHERS 43
3.3.1. Credit Finance 44
3.3.2. Factoring 45
3.3.3. Leasing 46
3.3.3.1. Credit Exposure by Industry Sector 47
3.3.3.2. Details of Net Investments in Finance Leases 47
3.3.4. Treasury Management 48
3.4 CORPORATE AND TRUST SERVICE PROVIDERS 49
3.4.1 Management Companies 50
3.4.2 Management Companies (Corporate Trustees Only) 51
3.5 CATEGORY 1 GLOBAL BUSINESS COMPANIES (GBC 1’s) 52
3.5.1 Assets of GBC 1’s Under Management 53
3.5.2 GBC 1’s Range of Assets 56
3.5.3 Br eakdown of Activities of GBC 1’s 59
3.5.4 Analysis of Investments of GBC 1’s 60
4. APPENDICES 61
4.1 Aggregate Breakdown of Assets, Liabilities and Equity / Income and Expenses 62
Financial Services Commission
Table 1 - Categorisation of Licensees Surveyed 3
Table 2 - Selected Economic Indicators of Mauritius 4
Table 3 - Breakdown of Licensed Entities 5
Table 4 - Survey Participants 10
Table 5 - Consolidated Assets of GBC 1’s and GBC 2’s (Based on Survey Respondents) 13 Table 6 - Financial Performance of Financial Services Sector
(excluding Companies holding a Category 1 Global Business Licence) 14 Table 7 - Financial Performance of Corporate and Trust Service Providers 15
Table 8 - Employment as at 31 December 2010 16
Table 9 - Claims Breakdown 19
Table 10 - New Business Breakdown for Long term Insurance Business 2008 - 2010 20 Table 11 - Breakdown for Business in Force for Long Term Insurance Business 2008 - 2010 21 Table 12 - Breakdown for Business in Force for General Insurance Business 2008 - 2010 22 Table 13 - New Business breakdown for General Insurance Business 2008 - 2010 23
Table 14 - Financial Performance of Insurance Brokers 24
Table 15 - Financial Performance of Insured Pension Schemes - 2010 25
Table 16 - Financial Performance of Insured Pension Schemes - 2009 26
Table 17 - Financial Performance of Superannuation Funds - 2010 27
Table 18 - Financial Performance of Superannuation Funds - 2009 28
Table 19 - Financial Performance of Pension Fund Administrator (PFA) and Pension Scheme Management (PSM) 29
Table 20 - Financial Performance of Actuarial Services 30
Table 21 - Official Market Statistics 32
Table 22 - Market Indices (SEM / DEM) - High / Low Performance 33
Table 23 - Investment on the Stock Exchange of Mauritius 34
Table 24 - Summary of Market Activity for the Year 2010 35
Table 25 - Financial Performance of Investment Dealers 36
Table 26 - Financial Performance of Investment Advisers 37
Table 27 - Financial Performance of Assets Management 38
Table 28 - Financial Performance of CIS Managers 39
Table 29 - Financial Performance of Custodian Services 41
Table 30 - Financial Performance of Registrar and Transfer Agents 42
Table 31 - Financial Performance of Credit Finance 44
Table 32 - Financial Performance of Factoring 45
Table 33 - Financial Performance of Leasing 46
Table 34 - Credit Exposure by Industry Sector 47
Table 35 - Breakdown of Net Investments in Finance Leases 47
Table 36 - Financial Performance of Treasury Management 48
Table 37 - Financial Performance of Management Companies 50
Table 38 - Financial Performance of Management Companies (Corporate Trustees Only) 51
Table 39 - GBC 1’s (Excluding CIS & Closed-end Funds) 53
Table 40 - CIS with GBC 1 Licence 54
Table 41 - Closed-end Funds with GBC 1 Licence 55
Table 42 - Range of Assets of GBC 1’s (Excluding CIS and Closed-end Funds with GBC 1 Licence) - 2010 56 Table 43 - Range of Assets of GBC 1’s (Excluding CIS and Closed-end Funds with GBC 1 Licence) - 2009 56 Table 44 - Range of Assets of (NAV) of CIS with GBC 1 Licence - 2010 57
Table 45 - Range of Assets of (NAV) of CIS with GBC 1 Licence - 2009 57
Table 46 - Range of Assets of (NAV) of Closed-end Funds (CeF) with GBC 1 Licence - 2010 58 Table 47 - Range of Assets of (NAV) of Closed-end Funds (CeF) with GBC 1 Licence - 2009 58
Table 48 - Percentage of Investments through GBC 1’s by Sector 60
Financial Services Commission
Lists of Appendices
Appendix 1 - Financial Position of Insurance Brokers 62
Appendix 2 - Financial Performance of Insurance Brokers 63
Appendix 3 - Financial Position of Pension Scheme Managers (PSM) and Pension Fund Administrator (PFA) 64 Appendix 4 - Financial Performance of Pension Scheme Managers (PSM) and Pension Fund Administrator (PFA) 65
Appendix 5 - Financial Position of Actuarial Services 66
Appendix 6 - Financial Performance of Actuarial Services 67
Appendix 7 - Financial Position of Investment Dealers 68
Appendix 8 - Financial Performance of Investment Dealers 69
Appendix 9 - Financial Position of Investment Advisers 70
Appendix 10 - Financial Performance of Investment Advisers 71
Appendix 11 - Financial Position of Assets Management 72
Appendix 12 - Financial Performance of Assets Management 73
Appendix 13 - Financial Position of CIS Managers 74
Appendix 14 - Financial Performance of CIS Managers 75
Appendix 15 - Financial Performance of Custodian Services 76
Appendix 16 - Financial Position of Registrar and Transfer Agents 77
Appendix 17 - Financial Performance of Registrar and Transfer Agents 78
Appendix 18 - Financial Position of Credit Finance 79
Appendix 19 - Financial Performance of Credit Finance 80
Appendix 20 - Financial Position of Factoring 81
Appendix 21 - Financial Performance of Factoring 82
Appendix 22 - Financial Position of Leasing 83
Appendix 23 - Financial Performance of Leasing 84
Appendix 24 - Financial Position of Treasury Management 85
Appendix 25 - Financial Performance of Treasury Management 86
Appendix 26 - Financial Position of Management Companies 87
Appendix 27 - Financial Performance of Management Companies 88
Appendix 28 - Financial Position of Management Companies (Corporate Trustees only) 89 Appendix 29 - Financial Performance of Management Companies (Corporate Trustees only) 90 Appendix 30 - General Insurance Companies - Distribution of Assets - Year 2010 92 Appendix 31 - General Insurance Companies - Distribution of Equity and Liabilities - Year 2010 93 Appendix 32 - General Insurance Business - Income & Expenditure for Year 2010 (by Individual Insurer) 94 Appendix 33 - General Insurance Business - Premium Breakdown by Individual Insurer for Year 2010 95 Appendix 34 - General Insurance Business - Claims Breakdown by Individual Insurer for Year 2010 96 Appendix 35 - General Insurance Business -Business in Force and Claims Paid by Individual Insurer for Year 2010 97 Appendix 36 - Long Term Insurance Business - Distribution of Assets - Year 2010 98 Appendix 37 - Long Term Insurance Business - Distribution of Equities And Liabilities - Year 2010 99 Appendix 38 - Long Term Insurance Business - Company wise Summary of Revenue Accounts for the Year 2010 100 Appendix 39 - Long Term Insurance Business - Premiums Breakdown by Individual Insurer for the Year 2010 101 Appendix 40 - Long Term Insurance Business - Claims Breakdown by Individual Insurer for the Year 2010 102 Appendix 41 - Long Term Insurance Business - Policies in Force for the Year 2010 103 Appendix 42 - General Insurance Business - Distribution of Assets - Year 2009 104
Financial Services Commission
Appendix 43 - General Insurance Companies - Distribution of Equity and Liabilities - Year 2009 105 Appendix 44 - General Insurance Business - Income & Expenditure for Year 2009 (By Individual Insurer) 106 Appendix 45 - General Insurance Business - Premium Breakdown by Individual Insurer for Year 2009 107 Appendix 46 - General Insurance Business - Claims Breakdown by Individual Insurer for Year 2009 108 Appendix 47 - General Insurance Business - Business in Force and Claims Paid by Individual Insurer for Year 2009 109 Appendix 48 - Long Term Insurance Business - Distribution of Assets - Year 2009 110 Appendix 49 - Long Term Insurance Business - Distribution of Equities and Liabilities - Year 2009 111 Appendix 50 - Long Term Insurance Business - Company wise Summary of Revenue Accounts for the Year 2009 112 Appendix 51 - Long Term Insurance Business - Premiums Breakdown by Individual Insurer for the Year 2009 113 Appendix 52 - Long Term Insurance Business - Claims Breakdown by Individual Insurer for the Year 2009 114 Appendix 53 - Long Term Insurance Business - Claims Analysis for the Year 2009 115 Appendix 54 - Long Term Insurance Business - Policies in Force for the Year 2009 116
List of Charts
Chart 1 - Number of New GBC 1’s and GBC 2’s licensed in 2010 8
Chart 2 - Number of New GBC 1’s and GBC 2’s licensed in 2009 8
Chart 3 - Total Number of New GBC 1’s and GBC 2’s Licensed between 2006 - 2010 9 Chart 4 - Total Assets (USD Billion) of GBC 1’s & GBC 2’s as at 31 December 2010 13
Chart 5 - Net Assets of Investment Schemes 2010 40
Chart 6 - Net Assets of Investment Schemes 2009 40
Financial Services Commission
List of Acronyms
AMF Authorised Mutual Fund BoM Bank of Mauritius CeF Closed-end FundsCeREF Closed-end Real Estate Fund CIS Collective Investment Schemes DEM Development and Enterprise Market FSC Financial Services Commission, Mauritius FSDA Financial Services Development Act GBC 1’s Category 1 Global Business Companies GBC 2’s Category 2 Global Business Companies GBP Great Britain Pound
GDP Gross Domestic Product JPY Japanese Yen
MUR Mauritian Rupee NAV Net Assets Value PEF Private Equity Fund QSS Quarterly Statistical Survey RoC Registrar of Companies SEM Stock Exchange of Mauritius USD United States Dollar UT Unit Trust
Financial Services Commission
FSC Codified List
Financial Service Providers / Activities
Code
Licence
Relevant Section of
Financial Services Act 2007
FS-1.1
Assets Management
S 14
FS-1.2
Distribution of Financial Products
S 14
FS-1.3
Pension Fund Administrators
S 14
FS-1.4
Pension Scheme Management
S 14
FS-1.5
Registrar and Transfer Agent
S 14
FS-1.6
Treasury Management
S 14
FS-1.7
Custodian Services (non-CIS)
S 14
Specialised Financial Services / Institutions
Code
Licence
Relevant Section of
Financial Services Act 2007
FS-2.1
Retirement Benefits Scheme
S 14
FS-2.2
Superannuation Funds
S 14
FS-2.3
Credit Finance
S 14
FS-2.4
Factoring
S 14
FS-2.5
Leasing
S 14
FS-2.6
Occupational Pension Scheme
S 14
FS-2.7
Actuarial Services
S 14
FS-2.8
Credit Rating Agencies / Rating Agencies
S 14
FS-2.9
Payment Intermediary Services
S 14
FS-2.10
Representative Office (for financial services provided
S 14
by a person established in a foreign jurisdiction)
FS-2.11
Other Financial Business Activity
S 14
Corporate and Trust Service Providers
Code
Licence/Approval
Relevant Section of
Financial Services Act 2007
FS-3.1A
Management Licence
S 77
FS-3.1B
Management Licence
(Qualified / Corporate Trustee only)
S 77
FS-3.2
Nominee Company (Approval)
S 78
Self-Regulatory Organisations (SROs)
Code
Declaration /Recognition
Relevant Section of
Financial Services Act 2007
FS-5.1
SRO
S 33
Providers of Market Infrastructure
Code
Licence
Relevant Section of
the Securities Act 2005
SEC-1.1
Securities Exchange
S 9
SEC-1.2
Clearing and Settlement Facility
S 10
Financial Services Commission
Reporting Issuer
Code
Registration
Relevant Enactment
SEC-4.4
Reporting Issuer
S 86 and Rule 3 of
Securities (Disclosure
Obligations of Reporting
Issuer) Rules 2007
Securities or Capital Market Intermediaries
Code
Licence
Relevant Section of
Securities Act 2005
SEC-2.1A
Investment Dealer
(Full Service Dealer including Underwriting)
S 29 and S 53
SEC-2.1B
Investment Dealer
(Full Service Dealer excluding Underwriting)
S 29
SEC-2.2
Investment Dealer (Broker)
S 29
SEC-2.3
Investment Dealer (Discount Broker)
S 29
SEC-2.4
Investment Adviser (Unrestricted)
S 30
SEC-2.5
Investment Adviser (Restricted)
S 30
SEC-2.6A
Representative of Investment Dealer
(Full Service Dealer) Type 1
S 29
SEC-2.6B
Representative of Investment Dealer
(Full Service Dealer) Type 2
S 29
SEC-2.6C
Representative of Investment Dealer
(Full Service Dealer) Type 3
S 29
SEC-2.6D
Representative of Investment Dealer (Broker) Type 1
S 29
SEC-2.6E
Representative of Investment Dealer (Broker) Type 2
S 29
SEC-2.6F
Representative of Investment Dealer (Discount Broker)
S 29
SEC-2.7A
Representative of Investment Adviser (Unrestricted)
S 30
SEC-2.7B
Representative of Investment Adviser (Restricted)
S 30
SEC-2.8
Investment Dealer (Commodity Derivatives Segment)
S 29
SEC-2.9
Investment Dealer (Currency Derivatives Segment)
S 29
Collective Investment Schemes and Closed-end Funds
Code
Authorised /Recognised /Approved
Relevant Section of
Securities Act 2005
Collective Investment Scheme (CIS)
SEC-3.1A
CIS (Single fund)
S 97
SEC-3.1Bv
CIS (having more than 1 fund)
S 97
SEC-3.1Cv
CIS (Protected Cell Company)
S 97
Closed-end Fund
SEC-3.2A
Closed-end fund (Single Fund)
S 97
SEC-3.2Bv
Closed-end fund (having more than 1 fund)
S 97
SEC-3.2Cv
Closed-end fund (Protected Cell Company)
S 97
Foreign Scheme
SEC-3.3A
Single Fund
S101
SEC-3.3B
Scheme with more than 1 sub-fund
S101
For the recognition of the 1st to 25th sub-fund
For the recognition of the 26th to 50th sub-fund
For the recognition of the 51st sub fund and
Financial Services Commission
CIS Functionaries and Professionals
Code
Licence/Approval
Relevant Section of
Securities Act 2005
SEC-4.1
Custodian
S 100
SEC-4.2
CIS Manager
S 98
SEC-4.3
CIS Administrator (Approval)
S 99
Foreign Investment Dealers
Code
Authorization
Relevant Section of
Securities Act 2005
SEC-5.1
Foreign Investment Dealer
(Commodity Derivatives Segment)
S 29 (3)
SEC-5.2
Foreign Investment Dealer (Currency Derivatives Segment)
S 29 (3)
Insurers / Reinsurers
Code
Licence
Relevant Section of
Insurance Act 2005
INS-1.1
Long-Term Insurance Business
S 11
INS-1.2
General Insurance Business
S 11
INS-1.3
External Insurance Business
S 11
INS-1.4
Professional Reinsurer
S 11
Insurance Service Providers
Code
Licence
Relevant Section of
Insurance Act 2005
INS-2.1
Insurance Manager
S 70
INS-2.2A
Insurance Agent (Company)
S 70
INS-2.2 B
Insurance Agent (Individual)
S 70
INS-2.3
Insurance Broker
S 70
INS-2.4
Insurance Salesperson (Registration)
S 75
INS-2.5
Claims Professional
S 78
The Trusts Act 2001
Code
Approval/Authorisation
Relevant Section of
Trust Act 2001
TAC-1.1
Qualified Trustee (other than a Management Company) - Authorisation
S 2
TAC-1.2
Enforcer (purpose trust created by a Mauritian national only)
S19 and S 21
TAC-1.3
Successor to Enforcer (purpose trust created by a Mauritian national only)
S 19
Global Business Licence
Code
Licence
Relevant Section of
Financial Services Act 2007
FS-4.1
Category 1 Global Business Licence
S 72
FS-4.2
Category 2 Global Business Licence
S 72
Financial Services Commission
General Notes and Definitions
1. The FSC’s Ninth Annual Statistical Survey 2010 was launched on 14 April 2011. The population surveyed might thus
differ from the number of licensees as at 31 December 2010. Where applicable, necessary notes have been inserted to
explain the difference.
2. Data for Insurers captured in the Annual Survey (Table 9 to Table 13) are on a calendar year basis while data from
Statutory returns (Appendix - 30 to Appendix 54) are those pertaining to the different financial year end of the
Insurers.
3.
Table 6 to Table 38 exclude Companies holding a Category 1 Global Business Licence.
4. Insured pension schemes are schemes that are administered and managed by insurers, pay death and disability insurance
premiums, have administration charges deducted from contributions before investments are made and charge fund
management fees.
5. Insured pension schemes fall under the Insurance Act 2005.
6. Superannuation funds are private occupational pension schemes set up under the Employees Superannuation Fund Act
1954.
Financial Services Commission
Financial Services Commission
1. INTRODUCTION
1.1. Introduction to FSC’s 9th Annual Statistical Survey 2010
The FSC’s Ninth Annual Statistical Survey 2010 was launched by the Financial Services Commission (FSC) on 14 April 2011 to
capture financial data as at 31 December 2010 and 31 December 2009 respectively.
This survey was conducted pursuant to the powers conferred upon the Commission under section 7(2) of the Financial
Services Act 2007 which provides as follows:
In the discharge of its functions under section 6(j), the Commission –
(a) may require any licensee to furnish such statistical information relating to his business or to the business administered
or managed by him for his clients at such intervals and within such time as may be required by the Commission;
(b) may, subject to paragraph (c), publish and disseminate any information obtained under paragraph (a) in any aggregate
form and figures;
(c) shall not publish or disseminate information relating to the individual affairs of any particular client of the licensee.
The purpose of the survey was to collect reliable and up-to-date data from licensees to enable the Commission to capture
market trends industry-wise.
Reporting period
The survey captures financial data as at 31 December 2010 and 31 December 2009 respectively.
Reporting Currency
All figures from Corporate and Trust Service Providers are in United States Dollar (USD), whereas figures from Financial
Services (excluding Companies holding a Category 1 Global Business Licence) are in Mauritian Rupees (MUR).
Financial Services Commission
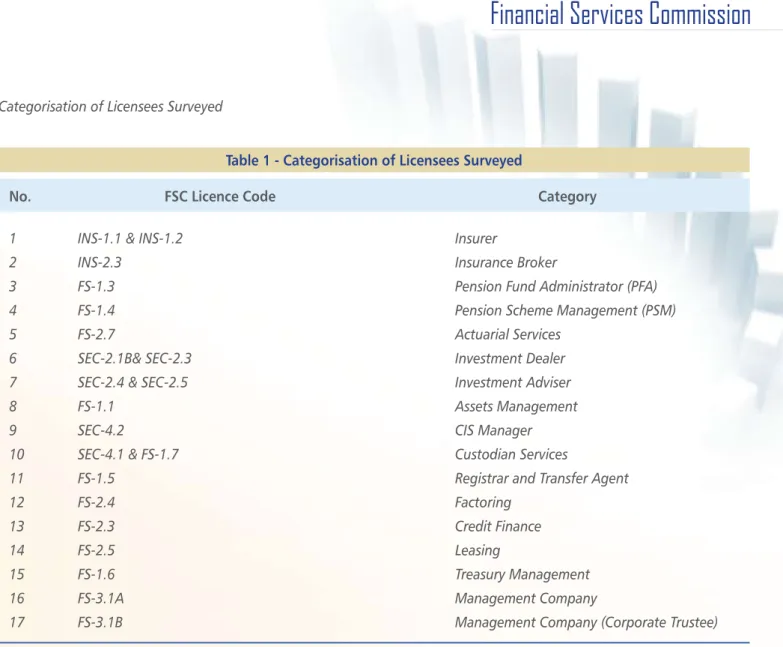
Categorisation of Licensees Surveyed
Table 1 - Categorisation of Licensees Surveyed
No.
FSC Licence Code
Category
1
INS-1.1 & INS-1.2
Insurer
2
INS-2.3
Insurance Broker
3
FS-1.3
Pension Fund Administrator (PFA)
4
FS-1.4
Pension Scheme Management (PSM)
5
FS-2.7
Actuarial Services
6
SEC-2.1B& SEC-2.3
Investment Dealer
7
SEC-2.4 & SEC-2.5
Investment Adviser
8
FS-1.1
Assets Management
9
SEC-4.2
CIS Manager
10
SEC-4.1 & FS-1.7
Custodian Services
11
FS-1.5
Registrar and Transfer Agent
12
FS-2.4
Factoring
13
FS-2.3
Credit Finance
14
FS-2.5
Leasing
15
FS-1.6
Treasury Management
16
FS-3.1A
Management Company
17
FS-3.1B
Management Company (Corporate Trustee)
Financial Services Commission
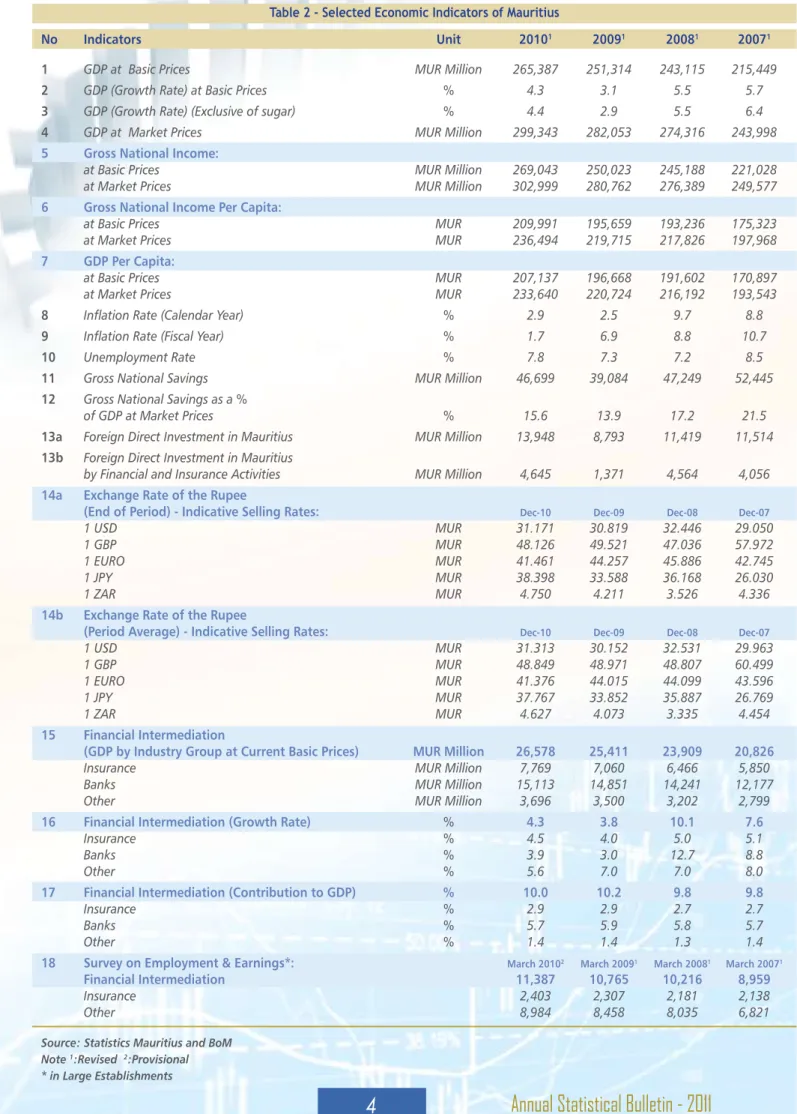
Table 2 - Selected Economic Indicators of Mauritius
No Indicators Unit 20101 20091 20081 20071
1 GDP at Basic Prices MUR Million 265,387 251,314 243,115 215,449
2 GDP (Growth Rate) at Basic Prices % 4.3 3.1 5.5 5.7
3 GDP (Growth Rate) (Exclusive of sugar) % 4.4 2.9 5.5 6.4
4 GDP at Market Prices MUR Million 299,343 282,053 274,316 243,998
5 Gross National Income:
at Basic Prices MUR Million 269,043 250,023 245,188 221,028
at Market Prices MUR Million 302,999 280,762 276,389 249,577
6 Gross National Income Per Capita:
at Basic Prices MUR 209,991 195,659 193,236 175,323
at Market Prices MUR 236,494 219,715 217,826 197,968
7 GDP Per Capita:
at Basic Prices MUR 207,137 196,668 191,602 170,897
at Market Prices MUR 233,640 220,724 216,192 193,543
8 Inflation Rate (Calendar Year) % 2.9 2.5 9.7 8.8
9 Inflation Rate (Fiscal Year) % 1.7 6.9 8.8 10.7
10 Unemployment Rate % 7.8 7.3 7.2 8.5
11 Gross National Savings MUR Million 46,699 39,084 47,249 52,445
12 Gross National Savings as a %
of GDP at Market Prices % 15.6 13.9 17.2 21.5
13a Foreign Direct Investment in Mauritius MUR Million 13,948 8,793 11,419 11,514
13b Foreign Direct Investment in Mauritius
by Financial and Insurance Activities MUR Million 4,645 1,371 4,564 4,056 14a Exchange Rate of the Rupee
(End of Period) - Indicative Selling Rates: Dec-10 Dec-09 Dec-08 Dec-07
1 USD MUR 31.171 30.819 32.446 29.050
1 GBP MUR 48.126 49.521 47.036 57.972
1 EURO MUR 41.461 44.257 45.886 42.745
1 JPY MUR 38.398 33.588 36.168 26.030
1 ZAR MUR 4.750 4.211 3.526 4.336
14b Exchange Rate of the Rupee
(Period Average) - Indicative Selling Rates: Dec-10 Dec-09 Dec-08 Dec-07
1 USD MUR 31.313 30.152 32.531 29.963 1 GBP MUR 48.849 48.971 48.807 60.499 1 EURO MUR 41.376 44.015 44.099 43.596 1 JPY MUR 37.767 33.852 35.887 26.769 1 ZAR MUR 4.627 4.073 3.335 4.454 15 Financial Intermediation
(GDP by Industry Group at Current Basic Prices) MUR Million 26,578 25,411 23,909 20,826
Insurance MUR Million 7,769 7,060 6,466 5,850
Banks MUR Million 15,113 14,851 14,241 12,177
Other MUR Million 3,696 3,500 3,202 2,799
16 Financial Intermediation (Growth Rate) % 4.3 3.8 10.1 7.6
Insurance % 4.5 4.0 5.0 5.1
Banks % 3.9 3.0 12.7 8.8
Other % 5.6 7.0 7.0 8.0
17 Financial Intermediation (Contribution to GDP) % 10.0 10.2 9.8 9.8
Insurance % 2.9 2.9 2.7 2.7
Banks % 5.7 5.9 5.8 5.7
Other % 1.4 1.4 1.3 1.4
18 Survey on Employment & Earnings*: March 20102 March 20091 March 20081 March 20071
Financial Intermediation 11,387 10,765 10,216 8,959
Insurance 2,403 2,307 2,181 2,138
Other 8,984 8,458 8,035 6,821
Source: Statistics Mauritius and BoM Note 1:Revised 2:Provisional
Financial Services Commission
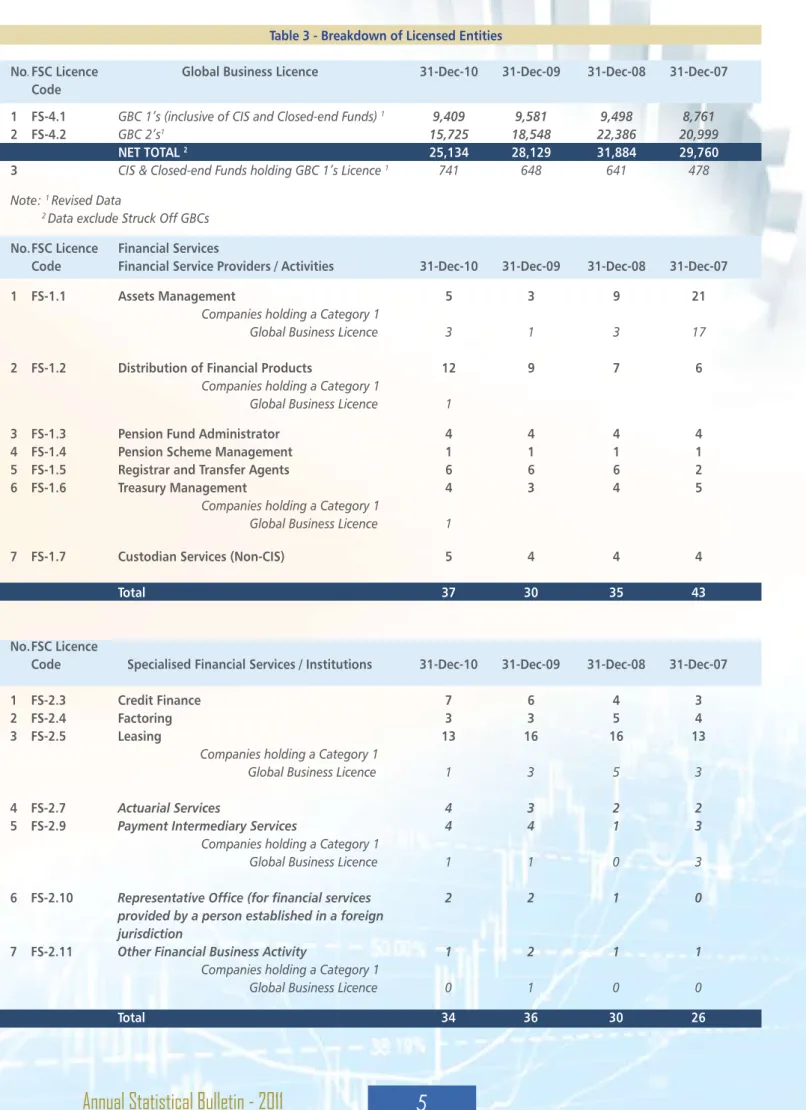
1.3. Highlights: Overview of Licensed Entities
Table 3 - Breakdown of Licensed Entities
No. FSC Licence Global Business Licence 31-Dec-10 31-Dec-09 31-Dec-08 31-Dec-07 Code
1 FS-4.1 GBC 1’s (inclusive of CIS and Closed-end Funds) 1 9,409 9,581 9,498 8,761
2 FS-4.2 GBC 2’s1 15,725 18,548 22,386 20,999
NET TOTAL 2 25,134 28,129 31,884 29,760
3 CIS & Closed-end Funds holding GBC 1’s Licence 1 741 648 641 478
Note: 1 Revised Data
2 Data exclude Struck Off GBCs
No. FSC Licence Financial Services
Code Financial Service Providers / Activities 31-Dec-10 31-Dec-09 31-Dec-08 31-Dec-07
1 FS-1.1 Assets Management 5 3 9 21
Companies holding a Category 1
Global Business Licence 3 1 3 17
2 FS-1.2 Distribution of Financial Products 12 9 7 6
Companies holding a Category 1
Global Business Licence 1
3 FS-1.3 Pension Fund Administrator 4 4 4 4
4 FS-1.4 Pension Scheme Management 1 1 1 1
5 FS-1.5 Registrar and Transfer Agents 6 6 6 2
6 FS-1.6 Treasury Management 4 3 4 5
Companies holding a Category 1
Global Business Licence 1
7 FS-1.7 Custodian Services (Non-CIS) 5 4 4 4
Total 37 30 35 43
No. FSC Licence
Code Specialised Financial Services / Institutions 31-Dec-10 31-Dec-09 31-Dec-08 31-Dec-07
1 FS-2.3 Credit Finance 7 6 4 3
2 FS-2.4 Factoring 3 3 5 4
3 FS-2.5 Leasing 13 16 16 13
Companies holding a Category 1
Global Business Licence 1 3 5 3
4 FS-2.7 Actuarial Services 4 3 2 2
5 FS-2.9 Payment Intermediary Services 4 4 1 3
Companies holding a Category 1
Global Business Licence 1 1 0 3
6 FS-2.10 Representative Office (for financial services 2 2 1 0
provided by a person established in a foreign
jurisdiction
7 FS-2.11 Other Financial Business Activity 1 2 1 1
Companies holding a Category 1
Global Business Licence 0 1 0 0
Financial Services Commission
No. FSC Licence
Code Corporate and Trust Service Providers 31-Dec-10 31-Dec-09 31-Dec-08 31-Dec-07
1 FS-3.1A Management Companies 121 108 99 82
2 FS-3.1B Management Companies (Corporate Trustees only) 28 26 22 23
Total 149 134 121 105
No. FSC Licence Activities under the Insurance Act 2005
Code Insurers / Reinsurers 31-Dec-10 31-Dec-09 31-Dec-08 31-Dec-07
1 INS-1.1 Long-Term and General Insurance Business 0 10 10 11
& INS-1.2
2 INS-1.1 Long-Term Insurance Business Only 19 13 11 10
Companies holding a Category 1
Global Business Licence 11 10 8 7
3 INS-1.2 General Insurance Business Only 15 8 8 7
Companies holding a Category 1
Global Business Licence 2 3 3 2
4 INS-1.3 External Insurer 3 4 4 4
Companies holding a Category 1
Global Business Licence 3 4 4 4
5 INS-1.4 Professional Reinsurer 4 3 2 1
Companies holding a Category 1
Global Business Licence 4 3 2 1
Insurance Service Providers
6 INS-2.2 A Insurance Agent (Company) 159 155 153 141
Companies holding a Category 1
Global Business Licence 2 2 2 1
7 INS-2.2 B Insurance Agent (Individual) 23 18 17 0
8 INS-2.3 Insurance Brokers 33 33 32 31
Companies holding a Category 1
Global Business Licence 9 9 9 11
9 INS-2.4 Insurance Salespersons 1257 925 805 1,767
TOTAL 1,513 1,169 1,042 1,972
No. FSC License Activities under the Securities Act 2005 31-Dec-10 31-Dec-09 31-Dec-08 31-Dec-07 Code Securities or Capital Market Intermediaries
1 SEC-2.1B Investment Dealer (Full Service Dealer
Excluding Underwriting) 14 13 9 0
Companies holding a Category 1
Global Business Licence 3 3 0 0
2 SEC-2.3 Investment Dealer (Discount Broker) 3 1 1 0
Companies holding a Category 1
Global Business Licence 2
3 SEC-2.4 Investment Adviser (Unrestricted) 44 52 44 1
Companies holding a Category 1
Global Business Licence 22 37 40 1
Financial Services Commission
4 SEC-2.5 Investment Adviser (Restricted) 13 8 10 4
Companies holding a Category 1
Global Business Licence 9 5 9 4
5 SEC-2.6A Representative of Investment Dealers
(Full Service Dealer) Type 1 12 9 9 0
6 SEC-2.6B Representatives of Investment Dealers
(Full Service Dealer) Type 2 10 9 9 0
7 SEC-2.6C Representatives of Investment Dealers
(Full Service Dealer) Type 3 18 16 19 0
8 SEC-2.6D Representatives of Investment Dealers
(Broker) Type 1 1 1 1 0
9 SEC-2.7A Representatives of Investment Adviser
(Unrestricted) 37 22 7 0
10 SEC-2.7B Representatives of Investment Adviser
(Restricted) 6 5 3 0
11 SEC-2.8 Investment Dealer (Commodity Derivatives Segment) 6
Companies holding a Category 1
Global Business Licence 4
12 SEC-2.9 Investment Dealer (Currency
Derivatives Segment) 13
Companies holding a Category 1
Global Business Licence 7
13 SEC- 5.1 Foreign Investment Dealer
(Commodity Derivatives Segment) 2
14 SEC-5.2 Foreign Investment Dealer
(Currency Derivatives Segment) 2
Collective Investment Schemes and Closed-end Funds
Collective Investment Schemes
15 SEC-3.1 A CIS (Single Fund) 4 3
16 SEC-3.1 B CIS (having more than 1 Fund) 1 1
Sub Funds 5 5
Closed-end Funds
17 SEC-3.2 A Closed-end Fund (Single Fund) 2 1
CIS Functionaries and Professionals
18 SEC-4.1 Custodian 5 3 1 0
19 SEC-4.2 CIS Manager 56 39 27 3
Companies holding a Category 1
Global Business Licence 39 28 25 3
20 SEC-4.3 CIS Administrator 3 2 1 0
21 Companies authorised as Funds
but not yet licensed under the Securities Act 2005
(transitional provision ends in September 2010 / 2012) 22 27 27
TOTAL 257 212 168 35
No. FSC License Activities under the Securities Act 2005 31-Dec-10 31-Dec-09 31-Dec-08 31-Dec-07 Code Securities or Capital Market Intermediaries
Financial Services Commission
1.4. New GBC 1’s & GBC 2’s Licensed in 2009-2010
The charts below depict the number of new GBC 1’s and GBC 2’s licensed during the years 2010 and 2009.
Chart 1 Number of New GBC 1’s and GBC 2’s licensed in 2010
Financial Services Commission
Chart 3 Total Number of New GBC 1’s and GBC 2’s Licensed between 2006 – 2010
Financial Services Commission
1.5. FSC Surveyed Population Size and Response Rate
The table below illustrates the number of licensees as at 31 December 2010, surveyed population size of each category of licensees, the survey respondents and the response rate..
Table 4 - Survey Participants
Category FSC Licence Licensed Surveyed1 No. of Response
No. Corporate and Trust Service Providers Code Population Population Respondents Rate (%)
1 Management Company FS-3.1A 121 113 111 98
2 Management Company (Corporate Trustees only) FS-3.1B 28 26 26 100
TOTAL 149 139 137 99
99%
No. Financial Services FSC Licence Licensed Surveyed1 No. of Response
(excluding Companies holding a Code Population Population Respondents Rate (%)
Category 1 Global Business Licence) 2
3 Long Term Insurance Business INS-1.1 19 8 8 100
4 General Insurance Business INS-1.2 15 12 12 100
5 Insurance Broker INS-2.3 33 24 20 83
6 Pension Fund Administrator
& Pension Scheme Management FS-1.3 & FS-1.4 5 4 4 100
7 Actuarial Services FS-2.7 4 2 2 100
8 Investment Dealer SEC-2.1B & SEC-2.3 17 12 10 83
9 Investment Adviser SEC-2.4 & SEC-2.5 57 15 10 67
10 Assets Management FS-1.1 5 2 2 100
11 CIS Manager SEC-4.2 56 15 14 93
12 Custodian Services FS-1.7 & SEC-4.1 10 7 6 86
13 Registrar and Transfer Agent FS-1.5 6 5 5 100
14 Factoring FS-2.4 3 2 2 100 15 Leasing FS-2.5 13 11 11 100 16 Credit Finance FS-2.3 7 2 2 100 17 Treasury Management FS-1.6 4 3 3 100 TOTAL 254 124 111 90 AGGREGATE TOTAL 403 263 248 94
Source: FSC 9th Annual Statistical Survey 2010
1 In certain cases, surveyed population size may differ from licensed population size for the following reasons:
a. Licensed Population include those holding GBC 1 Licence (Refer to Table 3) b. Population surveyed exclude those holding GBC 1 Licence
c. Some entities may hold more than one licence, to avoid duplication core business of the licensees was used. d. Some entities were not yet operational.
2 The following categories have been excluded since there was one respondent only: CIS Administrator, Distribution of Financial Products, Payment
Intermediary Services, Investment Dealer (Commodity Derivatives Segment), Investment Dealer (Currency Derivatives Segment) and Other Financial Business Activity. Data relating to individual licensees are not published by the Commission.
Financial Services Commission
2.
FINANCIAL
PERFORMANCE
OF RESPONDENTS
FINANCIAL
PERFORMANCE
OF RESPONDENTS
Financial Services Commission
2.1 Overview
2.1.1 Financial Services Sector (excluding Companies holding a Category 1 Global Business Licence) and Corporate
and Trust Service Providers
Table 6 provides an overview of the sector wise performance of the financial services sector (excluding Companies holding a
Category 1 Global Business Licence).
Excluding Insurers, the total assets for the financial services sector (excluding Companies holding a Category 1 Global Business
Licence), increased from MUR 22.6 billion in 2009 to reach MUR 26.0 billion in 2010, representing an increase of 15%.
In terms of assets, the leading performers were Leasing Companies, Treasury Management Companies and CIS Managers
respectively in 2010.
The total income generated by the entities surveyed for 2010 amounted to MUR 4.2 billion which represented an increase of
4% over the previous year. The top performers in 2010 in terms of total income were Leasing Companies, Insurance Brokers
and CIS Managers respectively.
The aggregate Profit after Tax for the financial services sector (excluding Companies holding a Category 1 Global Business
Licence) reached MUR 341.58 million in 2010 compared to MUR 335.18 million in 2009. The three most profitable categories
were Custodian Services, CIS Managers and Leasing Companies in 2010.
As highlighted in Table 7, the Corporate and Trust Service Providers generated total assets of USD 125 million in 2010,
representing an increase of 2 % over the previous year. Total income of Management Companies witnessed an increase of
9 %, going up from USD 147 million in 2009 to USD 160 million in 2010. Profits reported by the surveyed Management
Companies, in 2010 stood at USD 6.1 million.
Financial Services Commission
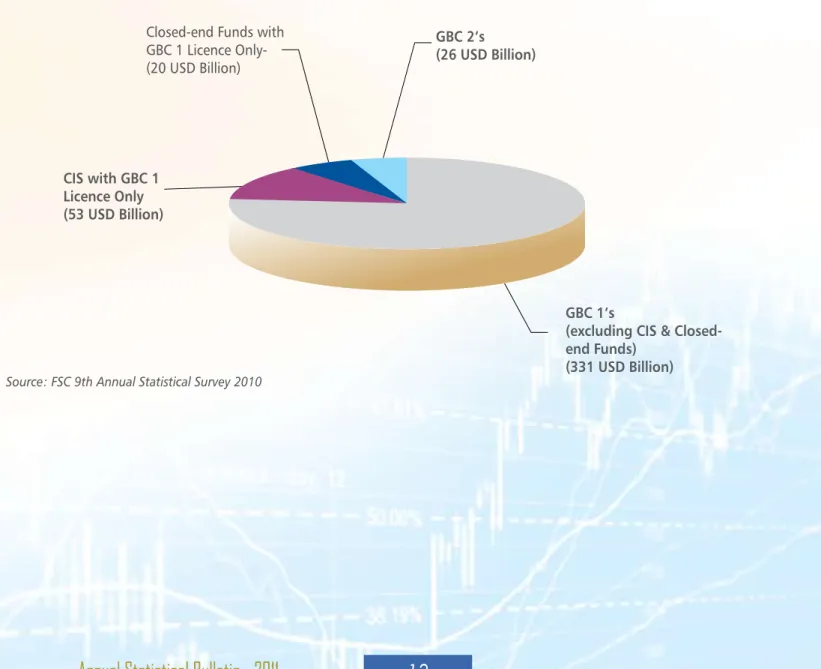
2.1.2 Global Business Companies
Based on data submitted by survey respondents, the overall assets of global business sector (i.e GBC 1’s (inclusive of CIS and
Closed-end Funds) and GBC 2’s) as at 31 December 2010 stood at USD 431 billion
Table 5 - Consolidated Assets of GBC 1’s and GBC 2’s (Based on Survey Respondents)
No. of
Assets (USD)
Assets (USD)
Total Assets (USD)
MCs Responded
GBC 1’s
GBC 2’s
GBC 1’s & GBC 2’s
111
404,794,307,121.78
26,384,395,180.11
431,178,702,301.89
Source: FSC 9th Annual Statistical Survey 2010
Note: GBC 1’s (Inclusive of CIS and Closed-end Funds with GBC 1 Licence)
Chart 4 Total Assets of GBC 1’s & GBC 2’s as at 31 December 2010
Source: FSC 9th Annual Statistical Survey 2010
Closed-end Funds with
GBC 1 Licence
Only-(20 USD Billion)
GBC 2’s
(26 USD Billion)
CIS with GBC 1
Licence Only
(53 USD Billion)
GBC 1’s
(excluding CIS &
Closed-end Funds)
Financial Services Commission
Table 6 - Financial P
erformance of Financial Services Sector (excluding Companies holding a Category 1 Global Business Licence)
Category
1Surveyed
No. of
Response
2010
2009
2010
2009
2010
2009
Population
Respondents
Rate (%)
Assets (MUR)
Income (MUR)
Profit / (Loss) (MUR)
1
Insurance Broker
24
20
83
564,215,624
573,683,295
336,273,222
307,845,625
32,074,677
58,968,740
2
Pension Scheme Management
& P
ension F
und Administrator
4
4
100
36,498,164
31,016,644
60,618,760
51,642,033
6,837,379
597,631
3
Actuarial Services
2
2
100
16,486,732
18,744,168
27,917,489
36,850,764
(286,596)
5,759,890
4
Investment Dealer
12
10
83
310,265,832
357,641,504
130,204,153
118,507,987
32,426,308
23,544,930
5
Investment Adviser
15
10
67
213,317,438
158,754,671
213,100,710
231,163,393
5,342,797
29,434,836
6
Assets Management
2
2
100
33,873,759
11,391,028
41,110,989
22,615,369
21,112,651
6,098,752
7
CIS Manager
15
14
93
1,216,056,233
877,553,120
321,446,017
203,900,136
92,836,970
31,523,155
8
Custodian Services (CIS & Non-CIS)
7
6
86
N.A
N.A
87,211,832
238,869,214
45,074,900
184,313,625
9
Registrar and T
ransfer Agent
5
5
100
32,438,541
29,055,449
31,062,961
26,888,347
2,854,445
382,874
10
Factoring
2
2
100
684,240,494
561,529,169
91,588,414
82,120,180
14,470,995
10,044,861
11
Leasing
11
11
100
20,048,365,901
18,751,003,781
2,609,002,543
2,589,338,658
98,598,319
36,143,471
12
Credit Finance
2
2
100
330,625,924
342,518,978
87,113,395
89,489,684
1,617,263
1,688,821
13
Treasury Management
3
3
100
2,545,562,548
922,131,985
164,227,724
45,079,261
(11,373,658)
(53,316,739)
Total
104
91
88
26,031,947,190
22,635,023,792
4,200,878,209
4,044,310,651
341,586,450
335,184,847
Source:
FSC 9th Annual Statistical Survey 2010
1Figures exclude Insurers.
(
See
Appendix - 30
to
Appendix 54
for Data on Insurers (Statutory Returns
))
N.A
:
Financial Services Commission
Table 7 - Financial P
erformance of Corporate and T
rust Service Providers
Category
Surveyed
No. of
Response
Assets (USD)
Income (USD)
Profit / (Loss)(USD)
No.
Corporate and T
rust Service Providers
Population
Respondents
Rate (%)
2010
2009
2010
2009
2010
2009
1
Management Company
113
111
98
117,990,380
116,398,700
155,307,799
142,817,996
5,247,417
11,737,514
2
Management Company
(Corporate T
rustees only)
26
26
100
7,038,817
5,955,114
5,103,112
4,765,781
855,451
1,329,056
Total
139
137
99
125,029,197
122,353,814
160,410,911
147,583,777
6,102,868
13,066,570
Source:FSC 9th Annual Statistical Survey 2010
Appendix 1
to Appendix 29
provides an aggregate breakdown of financial per
Financial Services Commission
Table 8 provides an overview of the size of employment of the respondent population. Corporate and T
rust service providers is the largest employer followed by the insurance sector
.
Table 8 - Employment as at 31 December 2010
Category
Population
No. of
Response
Local - No . of Employees
Expatriate - No. of Employees
Agregate
Surveyed
Respondents
Rate (%)
Managerial
Support
Technical
Managerial
Support
Technical
Total
Management Company
113
111
98
386
531
1,195
43
0
9
2,164
Management Company
(Corporate T
rustees only)
26
26
100
14
13
18
7
0
0
52
Total
139
137
99
400
544
1,213
50
0
9
2,216
Financial Services (excluding Companies holding a Category 1 Global Business Licence)
Insurers
20
20
100
217
1,298
422
20
1
4
1,962
Insurance Broker
24
20
83
38
103
90
1
0
1
233
Pension Scheme Management
& P
ension F
und Administrator
4
4
100
4
11
22
0
0
1
38
Actuarial Services
2
2
100
4
5
8
1
0
0
18
Investment Dealer
12
10
83
19
32
30
0
0
0
81
Investment Adviser
15
10
67
23
28
18
2
0
1
72
Assets Management
2
2
100
1
4
8
0
0
0
13
CIS Manager
15
14
93
28
84
24
2
0
0
138
Custodian Services (CIS & Non-CIS)
7
6
86
14
18
11
0
0
0
43
Registrar and T
ransfer Agent
5
5
100
8
24
9
0
0
0
41
Factoring
2
2
100
5
20
4
0
0
0
29
Leasing
11
11
100
57
415
33
0
0
0
505
Credit Finance
2
2
100
5
77
1
0
0
0
83
Treasury Management
3
3
100
7
2
6
0
0
0
15
Total
124
111
90
430
2,121
686
26
1
7
3,271
Aggregate T
otal
263
248
94
830
2,665
1,899
76
1
16
5,487
Financial Services Commission
3.
SECTORAL
Financial Services Commission
3.1 INSURANCE AND OCCUPATIONAL PENSION
SCHEMES
Financial Services Commission
3.1.1 Insurers
Table 9 – Claims Breakdown
Long T
erm Insurance Business - As at 31 December 2010
General Insurance Business - As at 31 December 2010
Value of Gross Claims P
aid (MUR):
7,945,105,483
Value of Gross Claims P
aid (MUR):
2,666,730,442
Out of which:
Out of which:
Maturity payments
3,997,994,867
Motor
1,327,181,185
Death benefits
325,271,394
Accident & Health
724,768,637
Surrenders
745,752,198
Engineering
67,461,213
Periodical payments
2,174,819,513
Liability
36,553,128
Lump sum
453,029,023
Property
358,485,289
Other
248,238,487
Transportation
51,510,407
Guarantee
105,725
Miscellaneous
100,664,858
Number of P
olicies (on which Claims P
aid):
Number of P
olicies (on which Claims P
aid):
Maturity payments
20,088
Motor
32,078
Death benefits
1,516
Accident & Health
7,818
Surrenders
6,386
Engineering
349
Periodical payments
62,737
Liability
799
Lump sum
1,588
Property
597
Other
3,364
Transportation
401
Guarantee
3
Miscellaneous
1,452
Financial Services Commission
New Business for period
Individual
Group
1 January 2010 to 31 December 2010
LINKED
NON-LINKED
LINKED
NON-LINKED
Life Assurance
Pension
Life Assurance
Pension
Life Assurance
Pension
Life Assurance
Pension
New Business for period
Individual
Group
1 January 2009 to 31 December 2009
LINKED
NON-LINKED
LINKED
NON-LINKED
Life Assurance
Pension
Life Assurance
Pension
Life Assurance
Pension
Life Assurance
Pension
New Business for period
Individual
Group
1 January 2008 to 31 December 2008
LINKED
NON-LINKED
LINKED
NON-LINKED
Life Assurance
Pension
Life Assurance
Pension
Life Assurance
Pension
Life Assurance
Pension
No. of P
olicies
3,832
1,17
9
46,572
1,215
-
93
283
10
Sum Assured (MUR)
920,208,961
47,085,47
6
15,688,574,885
199,149,256
-
58,955,193
6,183,907,177
144,854,065
Annual Premium (MUR)
68,564,235
13,908,39
4
469,210,338
17,319,879
-
3,243,446
46,098,511
545,144
Single Premium (MUR)
231,333,095
103,869,50
9
6,111,513,321
33,262,808
-
30,225,349
25,293,407
6,459,700
No. of P
olicies
3,236
892
41,381
813
1
76
969
9
Sum Assured (MUR)
848,137,738
66,215,18
5
12,470,206,532
133,632,821
-
22,748,799
7,995,308,082
187,975,147
Annual Premium (MUR)
61,709,379
13,874,64
7
366,910,782
11,224,965
79,064
2,662,661
33,363,835
1,180,036
Single Premium (MUR)
115,588,814
119,554,80
4
4,002,214,196
24,693,070
-
16,110,447
31,082,113
1,032,373
No. of P
olicies
4,577
1,03
1
35,546
639
-
100
6,045
39
Sum Assured (MUR)
864,705,657
65,078,70
2
12,583,134,117
64,136,583
-
14,402,890
9,541,711,728
127,787,303
Annual Premium (MUR)
74,206,643
12,770,69
8
256,998,712
9,734,179
-
6,864,486
47,782,698
3,238,847
Single Premium (MUR)
257,904,461
122,613,40
6
3,784,459,878
10,557,002
-
86,600,135
32,518,798
25,190,412
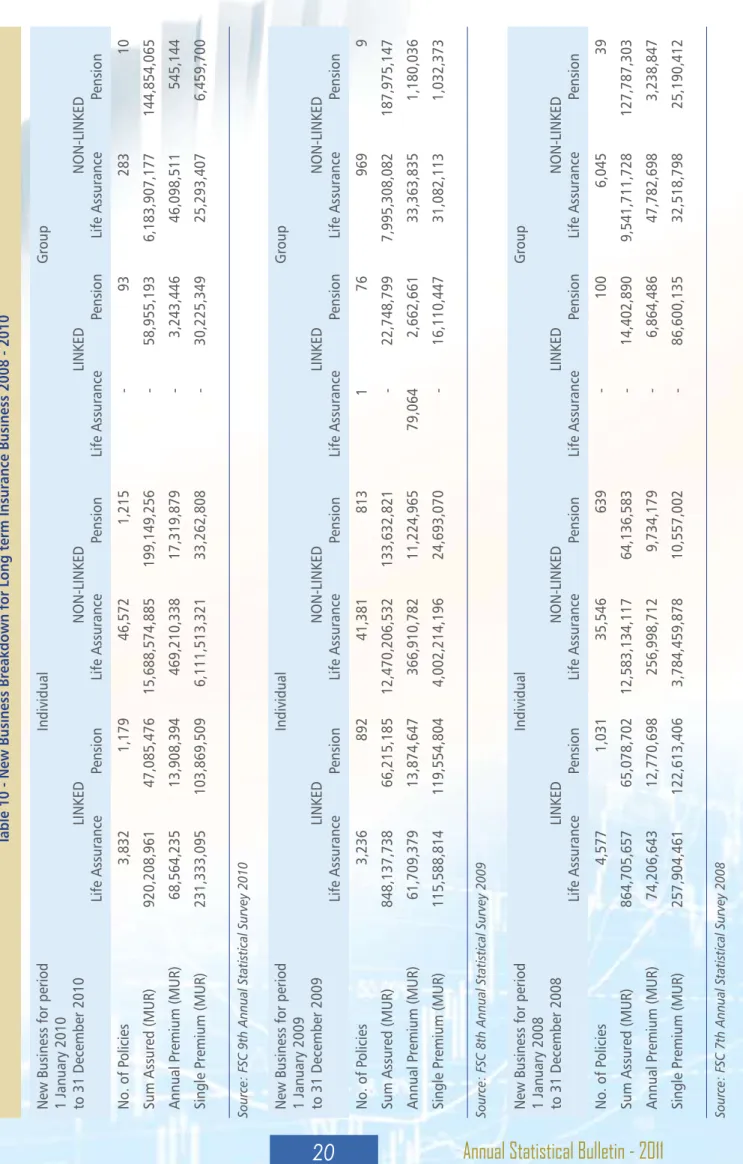
Table 10 - New Business Breakdown for Long term Insurance Business 2008 - 2010
Source: FSC 9th Annual Statistical Survey 2010 Source: FSC 8th Annual Statistical Survey 2009 Source: FSC 7th Annual Statistical Survey 2008
3.1.1.1 New Business Breakdown for Long T
Financial Services Commission
Individual
Group
Business in F
orce as at
LINKED
NON-LINKED
LINKED
NON-LINKED
31 December 2010
Life Assurance
Pension
Life Assurance
Pension
Life Assurance
Pension
Life Assurance
Pension
Individual
Group
Business in F
orce as at
LINKED
NON-LINKED
LINKED
NON-LINKED
31 December 2009
Life Assurance
Pension
Life Assurance
Pension
Life Assurance
Pension
Life Assurance
Pension
Individual
Group
Business in F
orce as at
LINKED
NON-LINKED
LINKED
NON-LINKED
31 December 2008
Life Assurance
Pension
Life Assurance
Pension
Life Assurance
Pension
Life Assurance
Pension
No. of P
olicies
36,226
10,470
311,730
15,066
12
680
10,111
702
Sum Assured (MUR)
8,620,597,612
776,188,981
71,631,572,355
3,285,224,898
51,592,500
453,666,480
54,558,347,472
1,374,658,062
Fund V
alue (where applicable)
2,973,666,077
1,637,063,435
-
37,982,890
502,741,424
-
Annual Premium (MUR)
495,761,143
144,574,929
2,770,657,922
180,696,498
3,660,968
61,439,960
374,064,923
1,113,371,613
Single Premium (MUR)
545,287,587
401,083,751
12,074,447,498
51,457,849
-
288,677,634
181,486,771
288,493,360
No. of P
olicies
34,187
9,256
314,702
15,010
12
496
10,265
701
Sum Assured (MUR)
8,511,870,636
828,378,371
67,269,998,022
3,298,739,730
37,607,418
647,761,668
66,235,112,436
1,310,528,399
Fund V
alue (where applicable)
2,445,384,175
1,333,261,121
-
-
29,648,658
388,228,069
-
-Annual Premium (MUR)
447,429,783
133,647,984
2,626,234,791
172,604,210
4,105,965
58,451,398
297,385,308
1,395,186,866
Single Premium (MUR)
427,055,879
449,486,144
9,045,277,885
44,664,747
-
254,404,613
168,293,489
296,123,947
No. of P
olicies
33,571
7,983
305,125
14,212
17
446
9,550
832
Sum Assured (MUR)
8,932,602,013
726,219,409
66,087,679,140
2,927,817,185
54,071,568
389,938,023
59,142,443,232
1,177,867,887
Annual Premium (MUR)
468,479,558
116,469,894
2,555,156,465
159,352,957
5,337,992
38,797,436
275,042,874
921,239,260
Single Premium (MUR)
465,212,792
360,063,097
6,623,185,396
31,550,120
19,580
263,764,438
164,019,607
320,400,038
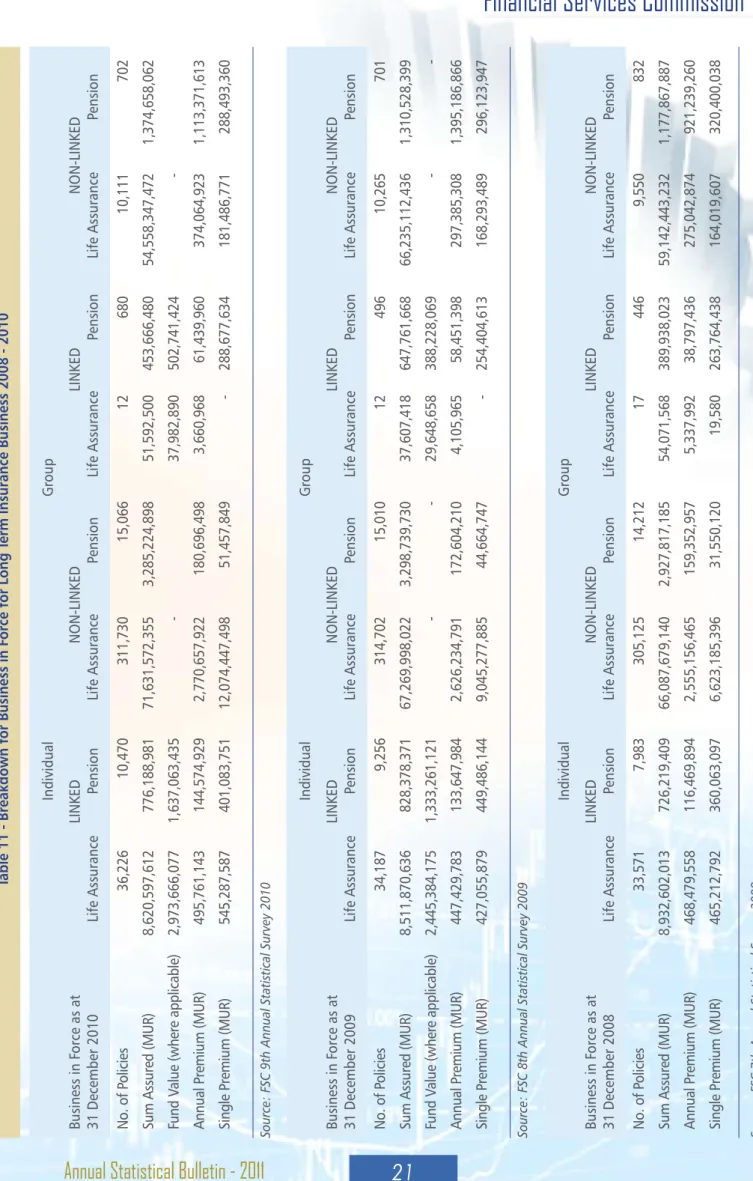
Table 11 - Breakdown for Business in F
orce for Long T
erm Insurance Business 2008 - 2010
Source: FSC 9th Annual Statistical Survey 2010 Source: FSC 8th Annual Statistical Survey 2009 Source: FSC 7th Annual Statistical Survey 2008
3.1.1.2 Breakdown for Business in F
orce for Long T
Financial Services Commission
Business in F
orce
as at 31 December 2010
Motor
Accident & Health
Engineering
Liability
Property
Transportation
Guarantee
Miscellaneous
No. of P
olicies
279,259
25,562
4,611
18,830
31,996
18,923
220
15,667
Sum Assured (MUR)
54,666,767,703
67,565,862,450
123,653,739,997
240,056,073,811
536,976,456,329
101,003,756,543
2,073,069,775
56,388,613,574
Annual Premium (MUR)
2,390,870,946
1,079,706,362
288,589,693
424,159,609
888,077,161
293,756,628
30,946,209
234,462,608
Single Premium (MUR)
-
4,756,787
113,731
11,211
39,551
240,321
100
1,331,153
Table 12 - Breakdown for Business in F
orce for General Insurance Business 2008-2010
Source: FSC 9th Annual Statistical Survey 2010
Business in F
orce
as at 31 December 2009
Motor
Accident & Health
Engineering
Liability
Property
Transportation
Guarantee
Miscellaneous
No. of P
olicies
272,482
18,072
5,815
18,183
58,984
22,371
184
14,999
Sum Assured (MUR)
37,824,493,727
41,678,662,648
112,376,411,094
219,258,126,608
766,211,444,997
135,118,810,637
222,044,379
24,043,137,076
Annual Premium (MUR)
2,168,591,986
820,063,839
238,734,550
297,745,505
947,905,275
276,101,701
8,014,171
289,884,876
Single Premium (MUR)
-
4,848,457
-