www.jbpe.org
Optimization of Brain Tumor MR Image
Classification Accuracy Using Optimal
Threshold, PCA and Training ANFIS with
Different Repetitions
Tahmasebi Birgani M. J.
1, Chegeni N.
2, Farhadi Birgani F.
2*,
Fatehi D.
3, Akbarizadeh Gh.
4, Shams A.
51Department of Radia-tion Oncology, Faculty of Medicine, Ahvaz Jundis-hapur University of Medi-cal Sciences, Ahvaz, Iran 2Department of Medical Physics, Faculty of Medi-cine, Ahvaz Jundishapur University of Medical Sciences, Ahvaz, Iran 3Department of Medi-cal Physics, Faculty of Medicine, Shahrekord University of Medical Sci-ences, Shahrekord, Iran 4Department of Electri-cal Engineering, Faculty of Engineering, Shahid Chamran University of Ahvaz, Ahvaz, Iran 5Department of Radia-tion Oncology, Golestan Hospital, Ahvaz Jundis-hapur University of Medi-cal Sciences, Ahvaz, Iran
*Corresponding author: F. Farhadi Birgani Department of Medical Physics, Faculty of Medi-cine, Ahvaz Jundishapur University of Medical Sciences, Ahvaz, Iran E-mail: farhadi.f92@ gmail.com
Received: 10 June 2017 Accepted: 25 October 2017
Introduction
N
owadays, Computer-aided Diagnosis (CAD) has proved signifi -cant capability to improve the accuracy and reliability of diag-nosis results for tumors [1, 2]. It provides much information regarding the abnormality of the brain and helps physicians in planning the best treatment [3, 4]. CAD can classify entirely automatic normal and abnormal brains from MR images through machine learning.Clas-sification is employed to find patterns in mass dataset and group into
diverse class labels depending on the trend of input data [5]. Numerous
techniques have been reported for the classification of brain tumors in MR images, such as Artificial Neural Network (ANN), Fuzzy, Support Vector Machine (SVM), knowledge-based techniques, k-nearest neigh
-bors (kNN), Expectation Maximization (EM) algorithm and clustering [6-14]. Another common classifier is Adaptive Neuro Fuzzy Inference
Original
ABSTRACT
Background: One of the leading causes of death is brain tumors. Accurate tumor classification leads to appropriate decision making and providing the most efficient treatment to the patients. This study aims to optimize brain tumor MR images clas -sification accuracy using optimal threshold, PCA and training Adaptive Neuro Fuzzy Inference System (ANFIS) with different repetitions.
Material and Methods: The procedure used in this study consists of five steps: (1) T1, T2 weighted images collection, (2) tumor separation with different threshold levels, (3) feature extraction, (4) presence and absence of feature reduction applying principal component analysis (PCA) and (5) ANFIS classification with 0, 20 and 200 training repetitions.
Results: ANFIS accuracy was 40%, 80% and 97% for all features and 97%, 98.5% and 100% for the 6 selected features by PCA in 0, 20 and 200 training repeti -tions, respectively.
Conclusion: The findings of the present study demonstrated that accuracy can be raised up to 100% by using an optimized threshold method, PCA and increasing training repetitions.
Keywords
System (ANFIS) which benefits from both ANN and fuzzy logic in a single framework and overcomes their individual weaknesses
and suggests more outstanding features [15,
16]. ANFIS classifier can also remove inac -curate information present in the image which leads to a high interpretability and good
de-gree of accuracy [17, 18].
One of the main issues that arise in classifi
-cation is the large number of variables. Fea
-ture reduction (FR) is a process which selects
an optimum subset of variables according to
a certain criterion [19]. Generally, reasons for performing FR may comprise eliminating ir -relevant data, increasing predictive accuracy of learned models, decreasing storage re-quirements, computational cost, run-time and improving the understanding of the data and
model [20-23]. Over the last decade, numer -ous methods and algorithms have been pro-posed to reduce features in MR brain images
such as principal component analysis (PCA),
independent component analysis (ICA), linear
discriminate analysis (LDA) and Genetic Al
-gorithm (GA) [24-28]. PCA is the most com
-mon technique and a linear method for FR in MR image classification [29, 30].
This study aims to optimize ANFIS classi
-fication accuracy by: 1) Using an optimized
thresholding method to detect tumors in im-ages with different intensities, 2) Applying the
PCA algorithm and 3) Training ANFIS clas
-sifier in different repetitions. The novelty of this study is by examining the effect of train -ing repetitions on the accuracy not addressed in recent literature.
Material and Methods
The steps involved in the proposed method
for MR image classification are illustrated in a flowchart as presented in Figure 1 and ex
-plained hereafter. It involves five steps: (1)
image collection, (2) image preprocessing, (3)
feature extraction, (4) presence and absence of feature reduction and (5) classification. In the following, each step will be explained:
Dataset
The dataset employed in this study consists
of T1 and T2-weighted, 256×256 pixel MR
brain images. The images were downloaded
from Harvard Medical School website (http:// med.harvard.edu/AANLIB/). The dataset in
-cluded 140 images in which 100 images were abnormal showing a tumor, and 40 images
were normal. The images used in the dataset
were obtained in axial plane.
Image Preprocessing
Image preprocessing is the initial step for brain tumor detection and diagnosis process.
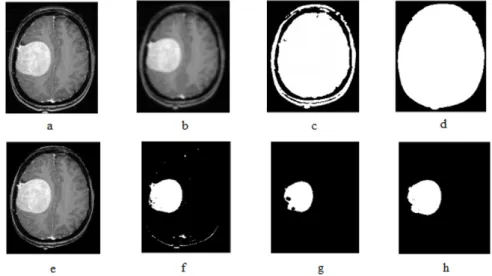
Tumor separation steps are illustrated in Fig -ure 2.a-h. In this step, to improve the image quality, it is essential to improve the quality of
the system. At first, noise is removed from the original image (Figure 2.a) with a Gaussian Filter (Figure 2.b). Dilation and erosion are
two fundamental operations in morphological
image processing. Dilation is defined as the Figure 1: Steps of the proposed
Optimize brain tumor MRI classification maximum value in the window. Thus, after di
-lation, the image will be brighter or its
inten-sity will increase. Furthermore, dilation ex
-pands the image and is mostly used to fill in the spaces. Erosion is just opposite dilation. It is defined as the minimum value in the win
-dow. The image after erosion will be darker than the original one; it shrinks the image. The
dilation and erosion of the binary image A by
the structuring element B are defined by A⊕B
and AB, respectively. As our original imag -es were in gray scale, and morphological
op-erations are originally defined for binary im
-ages, the filtered image was firstly converted to a binary image by threshold method (Figure
2.c). Then, the dilation operation was applied
to the binary image by disc-shaped masks with 4 pixels radius. In the next step, the holes (empty spaces) were filled (Figure 2.d). To separate the brain from image background, the
original image was multiplied in a binary im-age, the result of which was a gray scale image
of the brain (Figure 2.f). The gray scale image
of the brain was converted to a binary image, afterwards, the erosion operation was applied
to the binary image by disc-shaped masks with
4 pixels radius. The image was labeled to de
-termine the number and location of objects. The area of the objects and the mean area of
the total ones were calculated. The areas of
less than the mean area were deleted (Figure
2.g). The ultimate image was multiplied in a
gray image (Figure 2.h). The result of this step
was a gray scale image of the tumor applied to calculate morphological and statistical fea-tures.
Feature Extraction
The objective in image analysis is to extract
worthwhile information for solving
applica-tion-based problems. Features of an image are
the properties that completely describe the im-age. In this study, morphological and
statisti-cal features of all images were extracted and stored in an Excel file. Morphological features were Perimeter, Area, Extent, Major Axis Length, Minor Axis Length, Equivalent Di
-ameter, Convex Hull Area and Compactness. The first order statistical features assessed in
this study were mean, standard deviation and
Entropy. The mean is defined as the average
value of the image intensity and reveals gen-eral brightness of the image. Thus, a bright im-age has a high mean; a high mean represents a
Figure 2: Tumor separation steps: (a) Original image, (b) filtering, (c) primary binary image, (d) dilation and filling holes, (e) multiplying the gray in binary image, (f) ultimate binary image, (g) erosion and removing low areas, (h) filling the holes of the ultimate object
bright image. The standard deviation, known as the square root of the variance, exhibits the
contrast that describes the data spread. An im-age with high contrast has a high standard
de-viation. Entropy represents the uniformity of
the histogram and measures the number of bits
required to code the image data. Second-order
statistical (structural) features are obtained
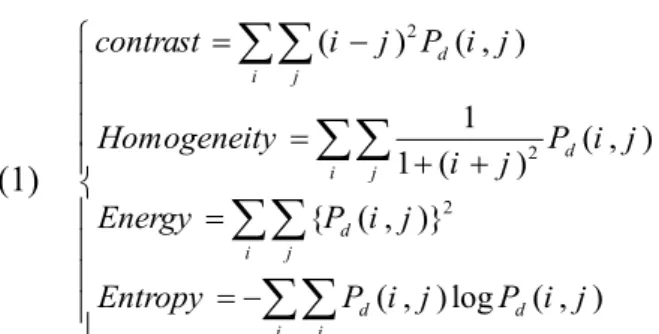
applying Gray-level co-occurrence matrix (GLCM). GLCM examines texture features to consider the spatial relationship of pixels also known as the gray-level spatial dependence matrix. Features extracted from GLCM were
contrast (Con), homogeneity (HOM), energy
(E) and entropy (EN) which were calculated in four directions; 0, 45, 90 and 135 degrees (Eq. 1). The Contrast returns a measure of the intensity difference between a pixel and its neighbor over the whole image. Contrast is 0
for a constant image. Homogeneity is a value that measures the closeness of the
distribu-tion of elements in the GLCM. Energy returns the sum of the square of elements in GLCM, which is 1 for a constant image. Entropy is a
measure of randomness. (1) 2 2 2 ( ) ( , ) 1 ( , ) 1 ( ) { ( , )} ( , )log ( , ) d i j d i j d i j d d i j contrast i j P i j Homogeneity P i j i j Energy P i j Entropy P i j P i j = − = + + = = −
∑∑
∑∑
∑∑
∑∑
Where (i,j) demonstrates level and column number and Pd (i,j) is signal intensity for pixel (i,j).
Feature Reduction
In this study, PCA was used for feature re
-duction. Main components are the projection of the original features into Eigen vectors and correspond to the biggest Eigen values of the covariance matrix of the original feature set.
The total number of morphological and
statis-tical features was 8 and 19, respectively. Three
statistical features were first-order statistical
features, and 16 of them were structural
fea-tures. Coefficients obtained by PCA were a matrix of 27×27. Greater efficient coefficients were in the first column and their amount re
-duced gradually. Finally, six of the best fea
-tures were achieved using PCA applied for training and testing the designed ANFIS model. As shown in Figure 3, coefficients in order from high to low are area, Entropy 135 degrees, Homogeneity 45 degrees, Equivalent Diameter, Entropy 45 degrees and Convex
Hull Area.
ANFIS Classification
Initially, input and output data were
deter-mined to design the ANFIS model. Then, the
system was trained with training data and
checked with a test dataset. To protect the clas
-sifier from over-fitting, 5-fold cross validation
was applied for setting train and test images
Training was performed by characterizing the
number of membership functions, selecting
the type of training, adjusting intended error rate called Error Tolerance, determining the
number of repetitions and starting training.
If the error was less than Error Tolerance, the training phase was finished. In the next step, the system was checked with the test dataset.
Figure 3: PCA coefficients graph to deter
-mine the effective features for the classifica
Optimize brain tumor MRI classification ANFIS model was designed and analyzed in
this research in the following seven steps:
1. Retrieving the Excel file containing all extracted features of normal and abnormal im -ages,
2. Dividing the data into two parts, training and testing,
3. Creating an ANFIS model based on the input data and analyzing the results,
4. Comparing the results with the actual val-ues of the target and estimating the accuracy,
5. Plotting charts of the original values (‘Ob
-served’), error (‘Error’) and the values pre
-dicted (‘Pre-dicted’) by ANFIS,
6. Training ANFIS model with 0, 20 and 200 repetitions and analyzing the results,
7. Plotting charts of the observed, error and predicted values after training with 0, 20 and 200 repetitions.
All mentioned steps were applied to Excel file containing selected features by PCA. Fi -nally, the results of two operations were com-pared.
Results
Thresholding is one of the common methods
utilized for image segmentation. Employing
this method, the image is partitioned directly into different regions based on the intensity
values so that the tumor can be detected. Based
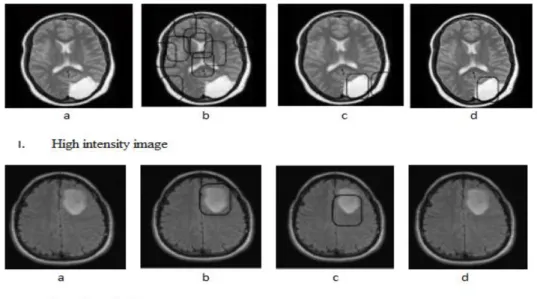
on imaging conditions, images reveal various intensities; thus, tumor segmentation requires a desired threshold. In this study, three
thresh-olds of 0.4, 0.6 and 0.8 were assessed which
were employed for each image automatically.
Finally, the optimal threshold is the one lead
-ing to identify-ing only one object. As Figure
4 shows, high intensity images require higher
threshold values (Figure 4.I-d) than low inten
-sity images (Figure 4.II-b).
Parameters used in the ANFIS model for
data training, i.e. number of linear, nonlin-ear, total parameters and membership
func-tions with and without PCA are illustrated in Table 1. Classification was performed in two
modes; classifying with all features (without
PCA) and features selected by PCA. Apply
-ing the PCA algorithm causes the number of
membership functions to reduce from 45 to 3
which reduces run time from 200 to 1 minute. Figure 5 shows membership functions graphs used for data training with PCA. The accuracy of ANFIS classifier is the probability that a di -agnostic test is properly performed and is
cal-Figure 4: Tumor detection in (І) a high intensity image and (ІІ) low intensity image. (a) Original image, the threshold of (b) 0.4, (c) 0.6 and (d) 0.8
culated as follows: 100 (2) TP TN accuracy TP TN FP FN × + = + + + Where,
TP (True Positive): Correctly classified posi -tive cases,
TN (True Negative): Correctly classified
negative cases,
FP (False Positive): Incorrectly classified
negative cases, and
FN (False Negative): Incorrectly classified
positive cases.
The accuracy of ANFIS model is shown in Table 2 which was enhanced using PCA from 40% to 97%. The amount of RMS increased with PCA which is reasonable as the number
of features decreased although the study was conducted using only 6 features. An important
finding in this study was that training repeti -tion plays a substantial role in enhancing the
accuracy of classification. As seen in Table 2, ANFIS accuracy is 40%, 80% and 97% with
-out PCA and 97%, 98.5% and 100% with PCA in 0, 20 and 200 training repetitions, respec
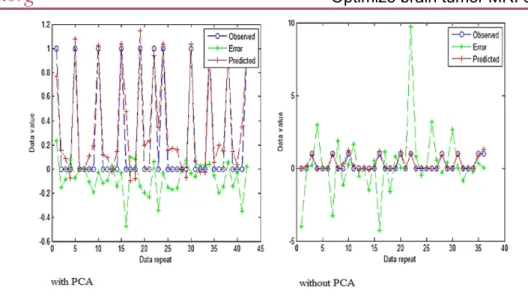
-tively. Furthermore, accuracy enhanced from 40% to 97% and from 97% to 100% applying PCA and increasing repetition, respectively. To further examine the effects of training rep
-etition and PCA, charts of the observed (blue), error (green) and predicted (red) in 200 repeti
-tions with and without PCA were plotted (Fig -ure 6). In comparison with other diagrams, error is smaller, which indicates the accuracy
of ANFIS is improved by PCA and increas -ing train-ing repetition. The range of the error
values was between -5 to 10 and -0.5 to 0.3 for training with and without PCA, respectively. Figure 7 shows changes in the selected fea
-tures from PCA. The values range from 0 to 3300 and from 0 to 1 for the input and output
data, respectively.
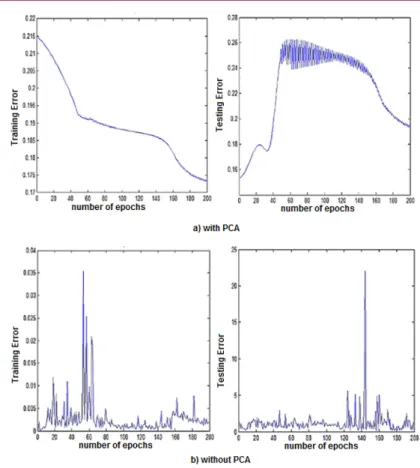
Figure 8 exhibits error changes by increasing the repetition after using PCA. The amounts of
groups Linear parameters nonlinear parameters Total parameters membership functions Without PCA 1000 200 730 1230 45 With PCA 51 21 36 57 3
Table 1: Parameters used in the ANFIS model for training data.
All features features obtained from PCA
repetition 0 20 200 0 20 200
Accuracy 40% 80% 97% 97% 98.5% 100%
RMSE of training 0.0012 0.0176 0.016 0.2147 0.2083 0.1945
RMSE of test 0.1165 0.1121 0.1020 0.1532 0.1774 0.1502
Table 2: Accuracy of the results obtained from the ANFIS model.
Figure 5: Charts of membership functions used for data training using PCA.
Optimize brain tumor MRI classification
Discussion
Nowadays, accuracy of classification is one
of the basic challenges for classifying brain
tu-mors in early stages. Bhardwaj approved that ANFIS classifier with accuracy greater than 90% has the potential to detect tumors [18]. As shown in Table 3, accuracy of ANFIS has been compared with other common classifiers. ANFIS combines Neuro and Fuzzy classifiers to achieve a more accurate classification [31]. For instance, the accuracy of ANN, Fussy Figure 6: Charts of the observed (blue), error (green) and predicted (red) in 200 repetitions with and without PCA.
Figure 7: hanges in the obtained features from PCA.
the error with PCA for the training data were descending; while test data errors first in -creased and then de-creased. The accuracy en-hanced with increasing the repetition, where
the best accuracy was obtained in 200 repeti
-tions. For further evaluation, 500 repetitions
were investigated. However, error was
neg-ligible relative to 200 repetitions. As seen in Figure 8, error changes without PCA because
both training and test data have not followed a regular procedure.
and ANFIS classifiers is 90% [11], 98.35% [20] and 99.4% [32], respectively. The clas
-sification accuracy of KNN and SVM classi
-fiers has been observed to be 98.6% [33] and 96% [34], respectively which are lower than the accuracy of ANFIS obtained in our study. Lakshymy proposed an algorithm to segment
out a tumor from a given brain MR image
us-ing ANFIS classifier and showed that ANFIS classifier could detect tumors with an accuracy of about 99.4% [32]. Our study revealed that the classification accuracy of ANFIS could be increased up to 100% using 1) an optimum
threshold method to get the morphological and
structural features, 2) GLCM to obtain struc
-tural characteristics, 3) PCA to reduce the fea -tures, and 4) higher training repetition.
The efficiency of PCA, as a feature reduc -tion method to increase the accuracy, has been approved by others [3, 24]. This study also
confirms the capabilities of PCA in increasing the accuracy of classification. As illustrated in Table 4, Rathi showed that classification ac
-curacy with feature selection using PCA was higher than those found without PCA, and also reported that accuracy with PCA is bet -ter than Linear Discriminant Analysis (LDA)
[20]. Abdullah found that using PCA reduced Figure 8: The trend of changes and fluctuations of error in different repetitions (epochs) for training and test (checking) data: (a) with PCA and (b) without PCA.
Methods accuracy KNN (33) 98.6% ANN (11) 90% ANFIS (32) 99.4% SVM (34) 96% Fuzzy (20) 98.35% Proposed (ANFIS) 100%
Table 3: Comparing the accuracy obtained in this study and that reported in recent works.
the number of feature vectors and improved the accuracy [35]. We conclude that
apply-ing PCA algorithm reduces the number of
membership functions from 45 to 3 which
de-creases the run time from 200 to 1 min, and increases the accuracy from 97% to 100% in 200 training repetitions.
Conclusion
Our results proves that ANFIS has a high capacity to increase classification accuracy of brain tumors to 100%. Generally, selection
of a suitable feature reduction method and an
optimized ANFIS classifier are very effective in classification accuracy. It is clear that more investigation is required for classification ac
-curacy by optimizing feature reduction meth
-ods and classifier algorithms.
Acknowledgment
The authors thank Dr. Rahmani for com -ments that greatly improved the manuscript.
We also thank the office of Vice-Chancellor for Research of Jundishapur University of Medical Sciences, Ahvaz, Iran for financial support of this study (grant number U-95042).
Conflict of Interest
None
References
1. Noureen E, Hassan K. Brain Tumor Detection Us-ing Histogram ThresholdUs-ing to Get the Threshold point. IOSR Journal of Electrical and Electronics Engineering. 2014;9:14-9.
2. Zhang WL, Wang XZ, editors. Feature extraction and classification for human brain CT images. 19-22 Aug. 2007. Hong Kong: Machine Learning and
Cybernetics, 2007 International Conference on; 2007: IEEE.
3. Sahu G, Bhaiya P. A Survey Paper Based on the Classification of MRI Brain Images Using Soft Computing Techniques. International Journal of Emerging Technology and Advanced Engineer-ing.2014;4:309-14.
4. Borole VY, Nimbhore SS, Kawthekar DSS. Image Processing Techniques for Brain Tumor Detec-tion: A Review. International Journal of Emerg-ing Trends & Technology in Computer Science (IJETTCS). 2015;4:2.
5. Roy S, Sadhu S, Bandyopadhyay SK, Bhattacha-ryya D, Kim T-H. Brain tumor classification using adaptive neuro-fuzzy inference system from MRI. International Journal of Bio-Science and Bio-Tech-nology. 2016;8:203-18.
6. Reddick WE, Glass JO, Cook EN, Elkin TD, Deaton RJ. Automated segmentation and classification of multispectral magnetic resonance images of brain using artificial neural networks. IEEE Trans Med Imaging. 1997;16:911-8. PubMed PMID: 9533591. 7. Joshi DM, Rana N, Misra V, editors. Classification
of brain cancer using artificial neural network. 7-10 May 2010. Kuala Lumpur: Electronic Computer Technology (ICECT), 2010 International Confer-ence on; 2010: IEEE.
8. Alfonse M, Salem A-BM. An automatic classifica-tion of brain tumors through MRI using support vector machine. Egyptian Computer Science Jour-nal. 2016;40:11-21.
9. Shubhangi D, Hiremath P, editors. Support vector machine (SVM) classifier for brain tumor detec-tion. 23-24 January 2009. Mumbai: Proceedings of the International Conference on Advances in Com-puting, Communication and Control; 2009: ACM. 10. Clark MC, Hall LO, Goldgof DB, Velthuizen R,
Murtagh FR, Silbiger MS. Automatic tumor seg-mentation using knowledge-based techniques. IEEE Trans Med Imaging. 1998;17:187-201. doi: 10.1109/42.700731. PubMed PMID: 9688151. 11. Rajini NH, Bhavani R, editors. Classification of MRI
brain images using k-nearest neighbor and artifi-cial neural network. 3-5 June 2011. Chennai: Re-cent Trends in Information Technology (ICRTIT), 2011 International Conference on; 2011: IEEE. 12. Gering DT, Grimson WEL, Kikinis R, editors.
Rec-ognizing deviations from normalcy for brain tumor segmentation. Berlin: International Conference on Medical Image Computing and Computer-Assisted Intervention; 2002: Springer.
13. Preetha R, Suresh G, editors. Performance analysis of fuzzy c means algorithm in automated detection Optimize brain tumor MRI classification
classifiers With PCA Without PCA
KNN(20) 98.48% 95.47%
SVM (35) 85% 65%
ANFIS (Proposed) 100% 97%
Table 4: Comparing accuracy with and with
of brain tumor. 27 Feb.-1 March 2014. Trichirap-palli: Computing and Communication Technologies (WCCCT), 2014 World Congress on; 2014: IEEE. 14. Singh A, editor Detection of brain tumor in MRI
images, using combination of fuzzy c-means and SVM. 19-20 Feb. 2015. Noida: Signal Processing and Integrated Networks (SPIN), 2015 2nd Inter-national Conference on; 2015: IEEE.
15. Hosseini MS, Zekri M. Review of Medical Image Classification using the Adaptive Neuro-Fuzzy In-ference System. J Med Signals Sens. 2012;2 :49-60. PubMed PMID: 23493054; PubMed Central PMCID: PMC3592505.
16. Subasi A. Application of adaptive neuro-fuzzy inference system for epileptic seizure detec-tion using wavelet feature extracdetec-tion. Comput Biol Med. 2007;37:227-44. doi: 10.1016/j.comp-biomed.2005.12.003. PubMed PMID: 16480706 17. Rajasekaran MP, Sri Meena R. Application of
adap-tive neuro-fuzzy inference systems for MR image classification and tumour detection. Int J Biomed Eng Technol. 2012;9:133-46.
18. Bhardwaj A, Siddhu KK. An approach to medical image classification using Neuro fuzzy logic and Anfis classifier. International Journal of Computer Trends and Technology. 2013;4:236-40.
19. Zhang Y, Dong Z, Wu L, Wang S. A hybrid method for MRI brain image classification. Expert Syst Appl. 2011;38:10049-53.
20. Rathi V, Palani S. Brain tumor MRI image clas-sification with feature selection and extraction using linear discriminant analysis. arXiv preprint arXiv:12082128. 2012.
21. Zhang N, Ruan S, Lebonvallet S, Liao Q, Zhu Y, editors. Multi-kernel SVM based classification for brain tumor segmentation of MRI multi-sequence. 7-10 Nov. 2009. Cairo: Image Processing (ICIP), 2009 16th IEEE International Conference on; 2009: IEEE.
22. Jolliffe I. Principal component analysis. New Yourk: Wiley Online Library. 2005.
23. Zhang Y, Wu L. An MR brain images classi-fier via principal component analysis and kernel support vector machine. Prog Electromagn Res. 2012;130:369-88.
24. Lahmiri S, Boukadoum M, editors. Comparison of ANFIS and SVM for the classification of brain MRI Pathologies. 7-10 Aug. 2011. Seoul: Circuits and Systems (MWSCAS), 2011 IEEE 54th International Midwest Symposium on; 2011: IEEE.
25. Sayah B, Tighiouart B. Brain tumour segmenta-tion in MRI: knowledge-based system and region
growing approach. Int J Biomed Eng Technol. 2014;14:71-89.
26. Simonetti AW, Melssen WJ, Szabo de Edelenyi F, van Asten JJ, Heerschap A, Buydens LM. Combina-tion of feature-reduced MR spectroscopic and MR imaging data for improved brain tumor classifica-tion. NMR Biomed. 2005;18:34-43. doi: 10.1002/ nbm.919. PubMed PMID: 15657908.
27. Zacharaki EI, Wang S, Chawla S, Soo Yoo D, Wolf R, Melhem ER, et al. Classification of brain tumor type and grade using MRI texture and shape in a machine learning scheme. Magn Reson Med. 2009;62:1609-18. doi: 10.1002/mrm.22147. PubMed PMID: 19859947; PubMed Central PM-CID: PMC2863141.
28. Jafari M, Shafaghi R. A hybrid approach for au-tomatic tumor detection of brain MRI using sup-port vector machine and genetic algorithm. Global Journal of Science, Engineering and Technology. 2012;3:1-8.
29. Singh D, Kaur K. Classification of abnormalities in brain MRI images using GLCM, PCA and SVM. Int J Eng Adv Technol. 2012;1:2249-8958.
30. Al-Badarneh A, Najadat H, Alraziqi AM, editors. A classifier to detect tumor disease in MRI brain images. 26-29 August 2012. Washington: Pro-ceedings of the 2012 International Conference on Advances in Social Networks Analysis and Mining (ASONAM 2012); 2012: IEEE Computer Society. 31. Sharma M, Mukharjee S. Brain tumor
segmenta-tion using hybrid genetic algorithm and artificial neural network fuzzy inference system (anfis). International Journal of Fuzzy Logic Systems. 2012;2:31-42.
32. Lakshmi A, Arivoli T. Computer aided diagnosis system for brain tumor detection and segmenta-tion. J Theor Appl Inf Technol. 2014;6:561-74. 33. El-Dahshan E, Salem A-BM, Younis TH. A hybrid
technique for automatic MRI brain images clas-sification. Studia Univ Babes-Bolyai, Informatica. 2009;54:55-67.
34. Chaplot S, Patnaik L, Jagannathan N. Classifica-tion of magnetic resonance brain images using wavelets as input to support vector machine and neural network. Biomed Signal Process Control. 2006;1:86-92.
35. Abdullah N, Chuen LW, Ngah UK, Ahmad KA, editors. Improvement of MRI brain classification using principal component analysis. 25-27 Nov. 2011. Penang: Control System, Computing and Engineering (ICCSCE), 2011 IEEE International Conference on; 2011: IEEE.