Community and Regional Planning Program:
Student Projects and Theses Community and Regional Planning Program Fall 12-5-2019
The Relationship between Separated Bicycle Lanes and Bicycle
The Relationship between Separated Bicycle Lanes and Bicycle
Crashes In Denver, Colorado.
Crashes In Denver, Colorado.
Wonsun ChangUniversity of Nebraska - Lincoln, wonsun02@gmail.com
Follow this and additional works at: https://digitalcommons.unl.edu/arch_crp_theses
Part of the Environmental Design Commons, Urban, Community and Regional Planning Commons, and the Urban Studies and Planning Commons
Chang, Wonsun, "The Relationship between Separated Bicycle Lanes and Bicycle Crashes In Denver, Colorado." (2019). Community and Regional Planning Program: Student Projects and Theses. 57. https://digitalcommons.unl.edu/arch_crp_theses/57
This Article is brought to you for free and open access by the Community and Regional Planning Program at DigitalCommons@University of Nebraska - Lincoln. It has been accepted for inclusion in Community and Regional Planning Program: Student Projects and Theses by an authorized administrator of DigitalCommons@University of Nebraska - Lincoln.
crashes in Denver, Colorado.
by
Wonsun Chang
A THESIS
Presented to the Faculty of
The Graduate College at the University of Nebraska In Partial Fulfillment of Requirements
For the Degree of Master of Community and Regional Planning
Major: Community and Regional Planning
Under the Supervision of Professor Yunwoo Nam
Lincoln, Nebraska
BICYCLE CRASHES IN DENVER, COLORADO.
Wonsun Chang, MCRP University of Nebraska, 2019 Advisor: Yunwoo Nam
Cyclists feel more comfortable when they ride in a bike facility separated from traffic. Therefore, cyclists tend to prefer separated bicycle lanes over other lanes. It follows that cities are increasing the installation of separated bicycle lanes for bicycle utilization and bicycle safety. However, previous research has proven that separated bicycle lanes cause more crashes. Through empirical study, this paper examined the impact of both separated bicycle facilities and shared roads on bicycle crashes and which is safer or dangerous among methods of the separation. This study deals with bicycle accidents in Denver from 2013 to 2019.This research creates bicycle crash data by extracting only bicycles involved in the crash from the traffic accident dataset. And then, using the ArcGIS tool, the bicycle crash spatial is joined to each bicycle facility segment. Therefore, this study generated dataset of a bicycle crashes based on bike facilities. In the next step, a Poisson Rate Regression analysis was conducted in this study (run in SAS 9.4). The result is that a separated bike lane is estimated to increase the average number of crashes by 117% compared to a shared road. The second result showed that a cycle track facility is estimated to increase the average number of crashes 401% compared to a bike lane facility. In conclusion, a separated bicycle facility has more crashes than a shared road. Among separated bicycle facilities, a cycle track, where physically separated facilities were installed, was most likely to cause crashes.
I would like to express the deepest appreciation to Professor Dr. Yunwoo Nam, my advisor, whose guidance and insight helped me throughout this project. Advice and comments given by Dr. Nam have been a great help in overall this thesis. This work would not be feasible without his support and encouragement.
I am deeply grateful to my committee members Professor Dr. Rodrigo Cantarero and Professor Gordon Scholz for taking the time to read and give thoughtful advice. Without their guidance, this paper would not have materialized.
I also owe my deepest gratitude to Statistical Cross-disciplinary Collaboration and Consulting Lab (SC3L). Especially, Emily Robinson provided insightful statistical analysis.
The authors would like to thank my friend, Shenyi. Her meticulous proofreading was an enormous help to me.
I would like to express my gratitude to my family: mom and dad and
grandmother. Their support was invaluable. Without their greatest encouragement, my studies would never have been achieved.
Finally, a special thanks to my friends, Fosha. I deeply appreciate her support and encouragement.
Table of contents
List of Tables ……….……...iii
List of Figures……….……...iv
Chapter 1 Introduction ………...1
Chapter 2 Literature Review ………...4
2.1 Promoting safe bicycling environments and bicycle facilities for cyclists………...……….4
2.2 The Impact of The Built Environment and Bicycle Facility Types on Bicycle Safety ………...5
2.3 Definition of Bicycle Facility Types ………..6
Chapter 3 Hypothesis ………...……….13
Chapter 4 Research Objectives ……….15
Chapter 5 Methodology ………....16
5.1 Study Area ………16
5.2 Data & Unit Analysis ……….……..18
5.3 Analytical method ………...………...22
5.4 Descriptive Statistics………….………25
Chapter 6 Results ………..29
6.1 Comparing the impact of Shared bicycle lanes and Separated bicycle lanes on Bicycle Crash ………...……….…29
Chapter 7 Discussion ………..………..36
Chapter 8 Limitation ………...……..44
Chapter 9 Planning Implications ………..47
Chapter 10 Conclusion ……….………48
List of Tables
Table 2.1 Definition of separated bicycle lane by type………...…7
Table 2.2 Definition of shared bicycle lanes by type..………...11
Table 5.1 Categorized Separated bicycle lane and Shared road………19
Table 5.2 Spatial join attribute and spatial relationship of this analysis ………..21
Table 5.3 Example of part of the dataset……….……..24
Table 6.1 Parameter estimates (Separated & Shared )...……….…...29
Table 6.2 Lane_Type Least Squares Means (Separated & Shared).………...…...30
Table 6.3 The percentage change information (Separated vs Shared)………...32
Table 6.4 Parameter estimates (BL, BBL, CT)……...………..33
Table 6.5 T value and Pr >|t| of analysis (BL, BBL, CT)………...………...33
Table 6.6 Facility LSMEANS table (BL, BBL, CT)...…...…...………34
Table 6.7 The percentage change information (BL, BBL, CT)...…...…….…..35
List of Figures
Figure 2.1 Bicycle lane design from FDM……….….…8
Figure 2.2 Buffered bicycle lane design from FDM……….…..9
Figure 2.3 Cycle track design from FDM……….….…10
Figure 2.4 Sharrow design from FDM………..……….……11
Figure 2.5 Shared roadway design from FDM……….……….……12
Figure 5.1 Existing bicycle facilities in Denver map (2019)…....……….17
Figure 5.2 Existing separated bicycle lanes and shared roads in Denver map (2019).…..18
Figure 5.3 Example of street segment of bicycle facilities in Denver (2019)……..….…20
Figure 5.4 Bicycle crashes and bicycle facilities in Denver (2013-2019) ……..…….….21
Figure 5.5 Locations of bicycle crashes in Downtown Denver (2019)...…………..…22
Figure 5.6 Crash count on bicycle facilities in the city of Denver from 2013 to 2019.….25 Figure 5.7 Crash Count on bicycle facility by type in city of Denver from 2013 to 2019...26
Figure 5.8 Percentage of each bicycle facility type in city of Denver in 2019……….….26
Figure 5.9 Crash counts on separated bicycle lanes and shared roads in city of Denver from 2013 to 2019……...27
Figure 5.10 Percent of separated bicycle lanes and shared roads in city of Denver from 2013 to 2019……...…28
Figure 6.1 Plot of LSMEANS (Separated & Shared)………....…31
Figure 6.2 Plot of LSMEANS (BL, BBL, CT) ………...…….…34
Figure 7.1 The specific location of the bicycle crashes in Denver from 2013 to 2019...37
Figure 7.3 Depiction of bend-out design………...………...….39
Figure 7.4 Example of lines marking in Seattle ………...…….…40
Figure 7.5 Example of green colored pavement marking in in Vancouver, Canada….…40 Figure 7.6 Depiction of Bike boxes design ………...………...41
Figure 7.7 Depiction of 2- Stage Turn Queue Boxes design ……….……...42
Figure 8.1 Example of crash point on midblock in city of Denver……….……..… 45
Chapter 1 Introduction
To be well and healthy, physical activity is important to people. There are various means of physical activity; among them, bicycling is one of the most attractive modes. Cycling produces many individual and public health benefits (Teschke et al., 2012). Also, bicycling is a healthy, environmentally friendly alternative to automobile use (Chen et al., 2012). Kelly, et al. (2014) demonstrates that bicycling reduced the risk of all-cause mortality (an indicator of population health that measures the total number of deaths due to any cause), after adjusting for other physical activity. Cycling had the greatest effect on the risk for all-cause mortality among those with the lowest levels of active behaviors as compared with those with some level of physical activity (Kelly, et al., 2014). It is clear that cycling is a healthy and effective physical activity for people. At the same time, cycling and walking are vulnerable modes of transportation relative to driving motorized vehicles (Chen, et al., 2012). Cyclist safety is a significant factor to encouraging bicycling.
To reduce cyclist’s safety concerns, cities have tried to become more bike friendly. People Powered Movement (PPM) (2019) indicated that advocacy groups have been successful in getting cities and towns across the country to adopt the culture of cycling. This article cited Sherwin Arzani, an attorney who handles bicycle accidents in Los Angeles, California. He stated that an increasing number of cities had added safety features such as bike lanes (People Powered Movement, 2019). Bicycle facilities
encourage a cyclist's feeling of security and supports a more active cycling environment. It is also made for the safety of all transportation, including the safety of cyclists and pedestrians. Plus, many urban areas are designing versatile complete streets to
accommodate for the increases in bicycle ridership. (National Complete Streets Coalition, 2010). The development and improvement of bicycle facilities contributes to the increase in the number of cyclists. For this reason, among bicycle facilities, the installation of the separated bike facility (SBF) is increasing.
The installation of SBF is directly correlated to increasing number of cyclists. At the same time, an emerging issue is the actual safety of separated bicycle facilities. It may seem obvious that a separated bicycle facility improves the safety of cyclists; however, this is a controversial argument in the field of transportation (Forester, 2001; Pucher, 2001). Forsyth & Krizek (2010) suggest that the main argument against safety claims for separated bicycle facility is that, on balance, actual crash data fails to support claims that separated bicycle facilities are in fact, safer. In recent years, people in the US have been strongly advocating for separated bike paths (cycle tracks) often in the form of a physical barrier (Heine, 2013). According to the Bureau of Transportation Statistics, though, adding protected bike lanes does not essentially make people more likely to ride. Instead, the lanes simply increase people's perception of safety (Bikemunk, 2018). For example, about 13% of cyclists surveyed said they generally felt threatened or unsafe at some point during their last trip, while a slightly smaller 10% of cyclists riding on bike lanes said they felt threatened while riding (Bikemunk, 2018). However, feeling safe and actually being safe are not the same.
Presently, there is a lack of research on the true the impact of bike facility types on bicycle crashes. Plus, there is an absence of research regarding the separation element on the bicycle facility. Hence, this thesis examines whether separation from motorized vehicles, as present in many bicycle facilities has an impact on decreasing the number of
bicycle crashes in Denver, Colorado. This study only analyzes data on bicycle accidents occurring in Denver from 2013 to 2019.
Chapter 2 Literature review
2.1 Promoting safe bicycling environments and bicycle facilities for cyclists
The improvement of bicycle facilities and safe bicycling environments support peoples’ choice of cycling as a means of transportation. Prior research has thoroughly investigated the most safe types of bicycle routes and which bike facilities they prefer to use. These prior studies suggest that cyclists prefer bicycle infrastructure separated from traffic. Also, cyclists feel more comfortable in a separated bicycle lane.
Caulfield, Brick, & McCarthy (2012) determined bicycle infrastructure
preferences by conducting a survey of 1,941 people employed in businesses participating in “Smarter Travel Workplaces.” Caulfield, Brick, & McCarthy (2012) showed that facilities that were segregated from traffic are the preferred form of cycling
infrastructure, regardless of cycling confidence. The research by Duthie, Brady, Mills, & Machemehl (2010) reviewed variety of bicycle facility types and configurations. They discovered that creating buffer space between the outer edge of the bicycle lane and the driver side of parked cars is the most effective way of ensuring that bicyclists are protected from parked motor vehicle door zones. Cyclists prefer separated bicycle facilities because they provide cyclists with the confidence that there will not be a collision with other traffic, and no accidental door opening of a car. Plus, individuals, especially women, children and the elderly, prefer to bike separately from motor traffic (Lusk et al., 2011). Moreover, there was similar result from Monsere, Mcneil, & Dill (2012). They evaluated different user perception of two types of separate on-road bicycle facilities (e.g. cycle tracks and buffered bike lanes) in Portland, Oregon. They found that
most cyclists believed that the separated facilities improved safety and reduced dooring concerns compared to a regular bike lane.
2.2 The impact of the built environment and bicycle facility types on bicycle safety
Many studies focus on built environment factors that cause bicycle crashes. Prior studies have examined the relationship between bicycle crashes and various built
environment features. Previous research has proven that the features of a built environment are directly related to bicycle safety. For example, Chen & Shen (2016) suggest that improving street lighting can decrease the likelihood of cyclist injuries and posted speed limits are positively correlated with the probability of apparent injury and severe injury or fatality. As such, they suggest lower posted speed limits on streets with both bikes and motor vehicles to promote bicycle safety. They also found that many crashes occur while motorists are turning left and are more likely to result in severe injuries. As for built environment factors, increased employment density is negatively correlated with decreased cyclist injury severity, whereas increased land use mixture is correlated with decreased likelihood of severe injury or fatality. Reynolds et al. (2009) reviewed studies of the impact of transportation infrastructure on bicyclist safety. They
found that infrastructure does influence risk of injury and crashes. However, cycle track with multi-lane roundabouts that are separated from traffic, they actually decrease risk for cyclists. Thus, these papers recommend that environmental treatments and road
developments can significantly affect cyclist safety.
There is additional research that shows that bicycle crashes are influenced in other ways by presence of bicycle facilities. These papers observed the impact of various
route types of bicycle lanes on bicycle crashes. Teschke et al. (2012) studied 14 route types and other route infrastructure features, evaluating them for injury risks. They found 5 types more safe than other types: “1) major streets without parked cars and with no bike infrastructure 2) major streets without parked cars and with bike lanes 3) local streets with no bike infrastructure 4) local streets designated as bike routes 5) cycle track”. They also found that three other infrastructure features were more dangerous: “1) downhill grades 2) streetcar or train tracks 3) construction.” Similarly, Hamann & Peek-Asa (2013) evaluated the influence of bicycle-specific roadway facilities (e.g., signage and bicycle lanes) in reducing bicycle crashes. This research showed that the existence of an on-road bike facility decreases the risk of a crash by as much as 60% on a bicycle lane or shared lane arrow and 38% on a bicycle-specific sign. The above-mentioned studies assess the impact of presence of on-road bicycle facilities on bicycle crashes. Still, on-road bicycle facilities are compared to off-road facilities (or streets without bicycle facility, not-on road bike facility). However, little research has been conducted to show the impacts of separated bicycle infrastructures (protected element) on bicycle crashes as compared to on-road bicycle facilities such as shared roadways.
2.3 Definition of bicycle facility types
This paper evaluates the impact of separated bicycle facilities versus shared roads on bicycle crashes. It is essential to clarify the definitions of these two types of facilities in order to truly understand the impact of different types of separated bicycle facilities, not just separated and shared road. As such, we need to clearly understand the definition of each bike facility and what distinct elements each uses. This research refers
to a case in Denver, Colorado. The City and County of Denver (2011) published Final Denver Moves (FDM) and this study cited key terms.
U.S. Department of Transportation (DOT.US) (2015) described that a separated bicycle lane is commonly defined as an on-road bike facility physically separated from motorized traffic with vertical elements. In this study, there are solid line elements that separated motorized and non-motorized users as well as vertical elements, and this is what is termed as separated bicycle lanes. Several facilities belong under this definition of separated bicycle lanes.
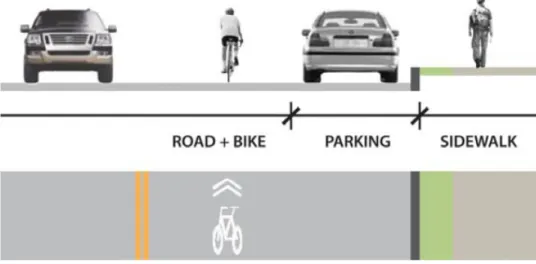
Table 2.1 Definition of separated bicycle lane by type (Final Denver Moves, 2011)
Type Description
Bike lanes (Regular)
“Bicycle lanes are a portion of the roadway designated for preferential use by bicyclists. Bicycle lanes increase the riding comfort for bicyclists as they provide dedicated space from vehicular traffic and reduce stress caused by acceleration and operating speed differentials between bicyclists and motorists.” (FDM, 2011, p. 23)
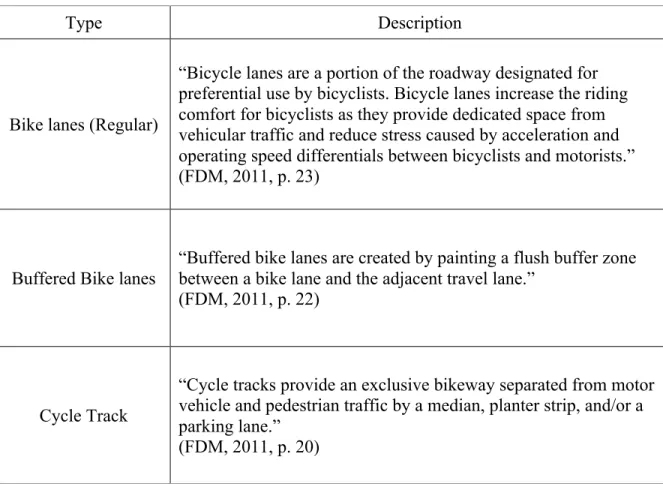
Buffered Bike lanes
“Buffered bike lanes are created by painting a flush buffer zone between a bike lane and the adjacent travel lane.”
(FDM, 2011, p. 22)
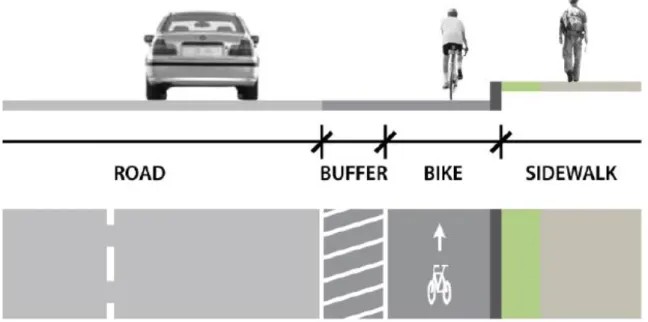
Cycle Track
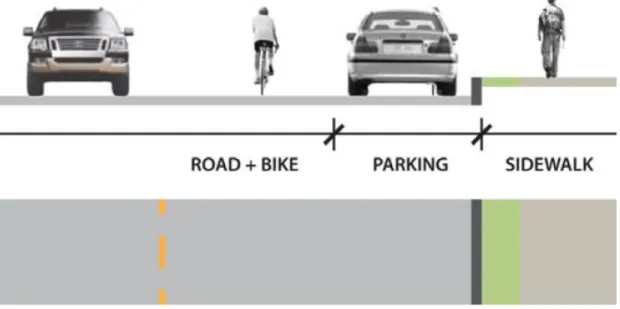
“Cycle tracks provide an exclusive bikeway separated from motor vehicle and pedestrian traffic by a median, planter strip, and/or a parking lane.”
1) Bicycle lane (Bike lane)
Bicycle lanes are a portion of the roadway designated for preferential use by bicyclists. Final Denver Moves (FDM) (2011) describe that bike lanes are one-way facilities that usually in the same direction as the adjacent motor vehicle traffic on the right side of the road. Bicycle lanes increase riding comfort for cyclists as they provide dedicated vehicle traffic space and reduce stress due to acceleration and speed
differentials between cyclists and motorists. It provides the minimum standard for separate on-street bicycle accommodation.
2) Buffered Bicycle lanes
Buffered bike lanes are created by painting a contiguous buffer zone between a bike lane and the adjacent travel lane. It is also possible to provide buffers between bike lanes and parking lanes to demarcate the door zone to discourage bicyclists from riding next to parked vehicles immediately. FDM stated that buffered bike lanes increase riding safety for bicyclists as they improve traffic and parked vehicle separation. They implied that this form of facility can be accompanied by signs that warn drivers when they open their doors to "look for bikes." Buffered bicycle lanes should be considered on steep roads where there may be higher downhill bicycle speeds and more severe door crashes (Final Denver Moves, 2011).
3) Cycle track
Cycle tracks provide an exclusive bikeway separated from motor vehicle and pedestrian traffic by a median, planter strip, and/or a parking lane (Final Denver Moves, 2011). This facility may be suggested to accentuate the distinction of the lane at street level, sidewalk level, or a height between the two. The cyclist's level of comfort in this facility will generally be high as the bicyclists will be isolated from neighboring
motorists and pedestrians in their own space. However, FDM (2011) warns that the level of comfort could be significantly reduced if intersections were not built to minimize potential collisions between cars, pedestrians and bicyclists. For streets that lead to off-street paths, cycling tracks are important, since cyclists using trails also tend to be regularly separated from other traffic.
Figure 2.3 Cycle track design from FDM (Final Denver Moves, 2011)
Table 2.2 Definition of Shared bicycle lanes by type (Final Denver Moves, 2011)
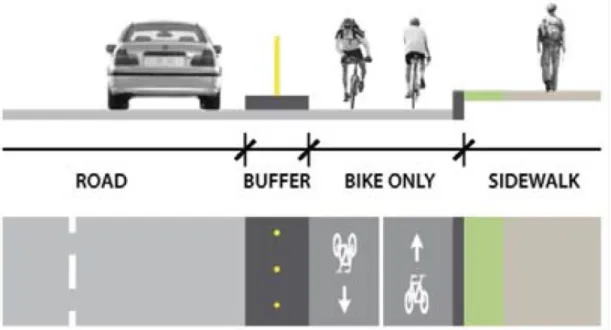
Sharrow
“Shared lane markings or “sharrows” are designed to provide guidance in situations where space is too narrow for a motor vehicle and a bicycle to travel side by side.”
(FDM, 2011, p. 27) Shared roadway
“Cyclists operate with motor vehicles without any selected bicycle facility.”
(FDM, 2011, p. 25) 1) Sharrow
FDM (2011) write that shared lane markings or “Sharrows” are designed to guide in situations where space is too narrow for a motor vehicle and a bicycle to travel side by side in separate lanes. Sharrows promote safe passing activities and reduce the incidence of bicycling in the wrong direction. The bicyclist's comfort level will usually be low as the bicyclists will operate on a shared lane with high volumes of traffic. FDM (2011) also described that relative comfort could vary considerably depending on the shared lane width, and that wide lanes are more comfortable than narrow lanes. Sharrows are often built where there is insufficient space to distribute to a dedicated bicycle facility in the through travel lane.
2) Shared roadway
FDM (2011) identified the shared roads as roads where motor vehicles are operated by cyclists without any bicycle facilities. While bicyclists are considered
automobiles and authorized on all roadways, shared streets are roads designated as part of the bike network. FDM described that while there are no bicycle-specific designs for shared lanes, different design features will make shared lanes more suitable for cycling. Relative comfort can vary significantly depending on the shared lane width, with more complete lanes than narrow lanes (FDM, 2011).
Chapter 3 Hypothesis
This study hypothesizes that separated bicycle facilities are actually more dangerous than the shared road.
Wachtel and Lewiston (1994) claimed that separation of bikes and cars leads to blind conflicts at intersections. It also encourages erroneous travel on both sidewalks and paths, including on both ends of the roadway, which further increases conflict. They also stated that the shared use of the roadway in the same direction of travel leads to fewer conflicts and fewer accidents.
Likewise, Forester (2001) claimed that separate facilities for cycling are risky. He pointed out that the popular argument is ultimately based on the assumption that a bike facility makes cycling much safer, especially for beginners who don't know how to follow road rules for vehicle drivers. However, Forester (2001) suggested that the argument from correlation ignores many other factors that might contribute to the
accident rate. He implied that nobody has been able to determine either of the two critical theories. First, either safer cycling at the same speed or faster cycling at the same
accident rate are results urban side path systems. (Forester, 2001). The second is that painting bicycle lane lines either decreases the accident rate for qualified cyclists or allows cyclists of lower skills to cycle at the same crash rate. Forester (2001) also insisted that motorized traffic in the same direction presents the greatest risk to cyclists. He also emphasized that bicycle facilities separate cyclists from same-direction motorized traffic. Bikeways do not separate cyclists from motor vehicles crossing or turning, and there is some risk from motor traffic in the opposite direction (Forester, 2001).
Similarly, John Franklin has disputed increases in the rate and severity of car-bicycle crashes because of such separation, based on an overview of studies published up to 1999. In the same way, Forsyth & Krizek (2010) suggested that the critical argument against safety claims for separated bicycle facilities is that actual crash data fails to support statements that separated bicycle facilities are safer. This is because most collision between motor vehicles and bicycles occur at intersections or when turning movements occur, not in the same direction (Forsyth & Krizek, 2010).
Heine (2013) raises doubts about cycle track safety. To comprehend bicycle safety, it is important to examine the actual rather than perceived dangers. She insisted that the hazard of being hit by a car coming too close from behind or being "clipped" by it is low. Plus, it reflects fewer than 5% of motor vehicle-bike crashes. Therefore, she implied that the majority of motorcycle and car accidents occur at intersections. Several studies agree with this argument. For example, Jensen (2008) contended that the
construction of bicycle facilities leads to fewer and less severe crashes in rural areas, but to more crashes in urban areas, mainly due to higher intersection crash rates.
Furthermore, Jensen et al. (2007) also has proven that the built cycle tracks caused 9-10% more accidents and injuries on repaired highways. Installation of cycle tracks and lanes have had positive effects in terms of levels of traffic and safety. Cycle tracks have had negative effects on road safety (Jensen et al., 2007). Based on these arguments, this study assumed that a separated bicycle lane would lead to more crashes than any other on-road bicycle facility (such as a shared road). Therefore, this study examined the relationship between the separated bicycle lanes and bicycle crashes comparing the shared road with an empirical approach.
Chapter 4 Research Objective
This study generally aims to examine the impact of the separated bike facility on bicycle safety.
The first objective of this study is to discover the impact of shared bicycle roads and separated bicycle facilities on bicycle crashes. This paper hypothesizes that separated bicycle facilities are more dangerous than the shared road. Forsyth & Krizek (2010) wrote that improving safety is the primary reason for the proposed separated bicycle facility. However, Forsyth & Krizek (2010) also wrote that the argument that separated bicycle facilities improve the safety of cyclists is a controversial one in the field of transportation. This thesis shows how a separated bicycle lane, which is designed for the safety and comfort of the cyclist, actually increases the probability of bicycle accidents.
The second objective of this study is to determine which type, within separated bicycle facilities, is the safest. Each separated bicycle facility has a different separation method. Separation is achieved by a variety of means, including bollards, medians, elevated pavement with curbs and parked cars (Forsyth & Krizek, 2010). Likewise, there is a variety of types of protected (separated) bicycle lanes. Therefore, this study will determine which separation method is safest for cyclists.
Chapter 5 Methodology
5.1 Study areaThis study focuses on the city of Denver in Colorado. There are two reasons for focusing on Denver as the study area. First, Denver is nationally recognized as a bike-friendly city. Bicycling Magazine ranks Denver as the 12th most bike-bike-friendly city in the U.S. Denver has more than 100 miles of trails with multiple uses and 120 miles of bike lanes. Approximately, 10,000 residents of Denver ride their bikes to work daily. With its 88 stations, Denver B-Cycle is the city's leading bike-share alternative. Downtown Denver, in particular, has a significant amount of bicycle traffic. Roughly six to seven percent of downtown employees indicated that they commute on a bike (Worthington & Douglas 2017). The percentage of downtown Denver commuters who bike to work increased 25 percent in 2017 compared to the previous year (Sachs, Short, Greenfield, & Bosselman 2018).
Second, Denver is very interested and well developed in bicycle facilities planning. FDM (2011) stated that Denver Moves would add 270 miles of bicycle facility types to the existing 172 miles of multi-use and bicycle facilities. High or medium ease bicycle facilities are a significant part (80%) of the final Denver Moves network plan (Final Denver Moves, 2011). Hernandez (2019) cited that the city will be installing 16.9 new bikeway miles along nine city streets this year, according to the Public Works Department. Their target is to get everyone in Denver within a quarter mile of a “high comfort bike facility,” which is defined as a protected bike lane with some vertical elements separating cyclists from vehicle traffic and neighborhood bikeways with streets
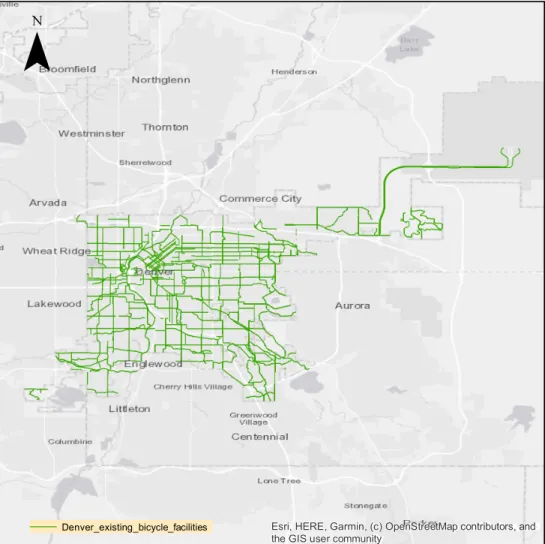
designed to encourage bike travel (Hernandez, 2019). Figure 5.1 shows the existing bicycle facilities in Denver.
Figure 5.1 Existing bicycle facilities in Denver map (2019) (Data source: the Denver open data portal)
Esri, HERE, Garmin, (c) OpenStreetMap contributors, and the GIS user community
¯
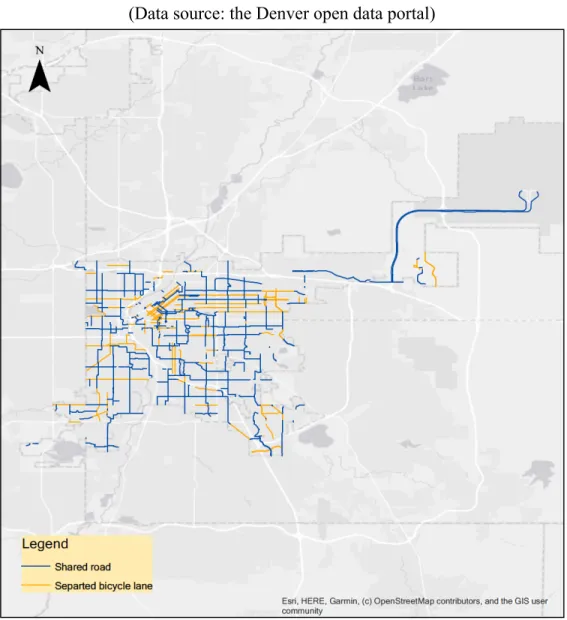
Figure 5.2 indicates the distribution of separated bicycle lanes and shared roads. The blue line is a shared road, and the yellow line illustrates a separated bicycle lane.
Figure 5.2 Existing separated bicycle lanes and shared road in Denver (2019) (Data source: the Denver open data portal)
5.2 Data & Unit Analysis
Data was derived from the Denver open data portal
(https://www.denvergov.org/opendata), which includes traffic accidents and bicycle facility datasets. First, this study created bicycle crash data by extracting only
bicycle-involved crashes from the traffic accident dataset and used information on bicycle
crashes, fatalities, and severe injuries. This dataset was organized into a shapefile for Arc GIS and displayed point features. Using this information, this study created bicycle crash data, identifying incidents of collision between motorized vehicles and bicycles.
Second, the Denver bicycle facility dataset contains the existing and proposed bicycle facilities in the city and county of Denver. This data presents the facility type and address of each bike facility. It categorized existing facility types as Bike Lane, Buffered Bike Lane, Climbing Lane, Cycle Track, Bus/Bike Lane, Paved shoulder, Bike
Boulevard, Minor Trail, Neighborhood Trail, Gateway Trail, Shared Parking Bike Lane, Regional Trail, Sharrow, Shared Roadway, Off-Street Connector and Sidewalk/Bikes Permitted (aka bikes permitted on sidewalk). This thesis divided these facilities as on and off-street bicycle facilities and only deals with only on-road facilities. The next step is that this study defined and categorized each on road bicycle facility as separated or shared road facilities. Table 5.1 shows the classification of shared road and separated bicycle facilities.
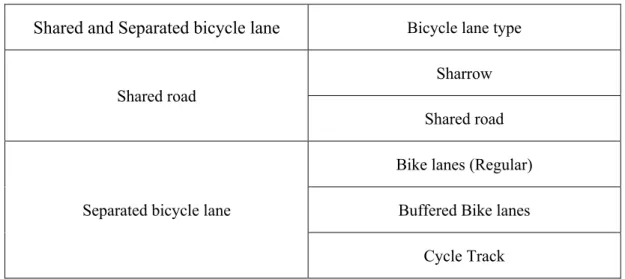
Table 5.1 Categorized Separated bicycle lane and Shared road
Shared and Separated bicycle lane Bicycle lane type
Shared road
Sharrow Shared road
Separated bicycle lane
Bike lanes (Regular) Buffered Bike lanes
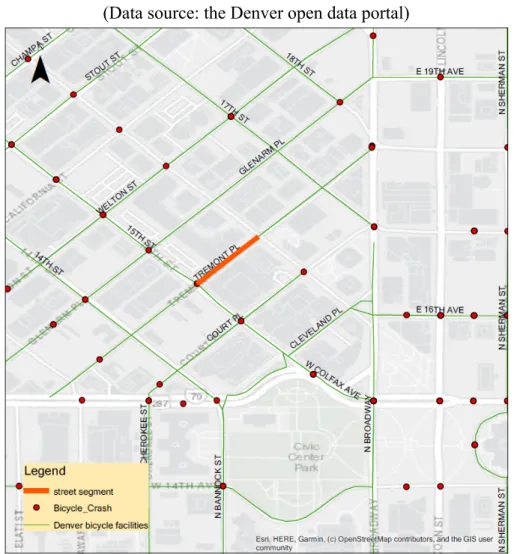
In addition, Denver bicycle data offered a shapefile for GIS and displayed line features. Bicycle facility data identifies the street segment as minimum unit. Street segment in this study is the minimum unit for bicycle facility. Figure 5.3 shows what is the street
segment, with the orange line representing the street segment.
Figure 5.3 Example of street segment of bicycle facilities in Denver (2019) (Data source: the Denver open data portal)
This paper uses the GIS (Spatial join) tool. Spatial join is that joins attributes from one feature to another based on the spatial relationship. A spatial join involves matching rows from the join layer to the target layer based on a spatial relationship and writing to an
output feature class. In this case, table 5.2 shows that the target feature is a bicycle facility segment, and the join feature is a bicycle crash. Likewise, the bicycle crash point feature joins to each bicycle facility segment spatially. Each segment has the number of incidents that have occurred precisely position. Therefore, this study generated a bicycle crash on the bike facility dataset.
Table 5.2 Spatial join attribute and spatial relationship of this analysis
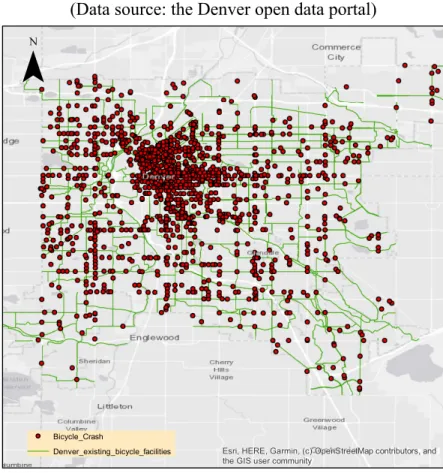
Figure 5.4 Bicycle crashes and bicycle facilities in Denver (2013-2019) (Data source: the Denver open data portal)
Esri, HERE, Garmin, (c) OpenStreetMap contributors, and the GIS user community
¯
Bicycle_Crash
Denver_existing_bicycle_facilities
Target feature Join feature The spatial relationship : Intersect
Line (Bicycle facility
segment)
Point (Bicycle crash)
A join crash point is matched to a target bicycle facility line that contains it.
Figure 5.5 Locations of bicycle crashes in Downtown Denver (2019) (Data source: the Denver open data portal)
5.3 Analytical method
Because the data are count data, a Poisson distribution was assumed. There have been several papers on predicting traffic accident counts and how other variables affect traffic crash counts. Then they used Poisson rate regression as an analytical tool (Ma, Kockelman, & Damien, 2008; Miaou, 1994; Li, Wang, Liu, Bigham, & Ragland, 2013). In the bicycle safety studies, they also used Poisson rate regression (Hels & Orozova-Bekkevold, 2007; Oh et al. 2008). This paper investigates the impact of separated bicycle lanes and shared road on bicycle safety and which among the separation elements are safer.
The model would be written as
Let 𝑐"# denote the proportion of crashes for the 𝑗%& segment and 𝑖%& bike lane, 𝑖 =
1 (𝑠𝑒𝑝𝑎𝑟𝑎𝑡𝑒𝑑), 2 (𝑠ℎ𝑎𝑟𝑒𝑑_𝑟𝑜𝑎𝑑) . Then
𝑐"#~𝑃𝑜𝑖𝑠𝑠𝑜𝑛(𝜇"#)
with 𝑙𝑜𝑔 ?@AB
C D = 𝜂 + 𝜏"
where
𝜂 = overall mean on the model scale
𝜏" = effect of the 𝑖%& bike_lane type (separated or shared roadway)
s = offset due to the segment length (in miles)
(Source: Report from Statistical Cross-disciplinary Collaboration and Consulting Lab (SC3L), 2019)
Because a longer segment length will likely have more crashes than a shorter segment length, the segment length in miles was used to adjust for these differences
(𝑐𝑟𝑎𝑠ℎ 𝑐𝑜𝑢𝑛𝑡 ⁄ 𝑠𝑒𝑔𝑚𝑒𝑛𝑡 𝑙𝑒𝑛𝑔𝑡ℎ). Data were analyzed using the GLIMMIX procedure
in SAS. The GLIMMIX procedure converts the data through a link function from the data scale to the model scale for the statistical analysis. Once the analysis is completed, an inverse link (ilink) is performed in order to put the predicted values back to the data scale (predicted means and percentage changes).
Table 5.3 is an example of part of dataset. Table 5.3 includes the type of bicycle facility, the crash count and segment length that occurred at the site of the bicycle facility and indicates whether the site is a separate bicycle lane or shared road (Lane_type). This study will illustrate the definition of these variables in table 5.3. ID indicated the identity
(number) of each segment. Crash_Count is a crash count on the bicycle facility segment. Facility indicated the type of bicycle facility segment; there are SRd (Shared road), SH (Sharrows), BL (Bike lane), BufBL (Buffered bike lane), CT (Cycle track). Lane_Type indicated whether each bicycle facility segment belongs to a shared roadway or a
separated bicycle lane. Segment _length_(Miles) indicated each bicycle facility segment length (Units is Miles).
Table 5.3 Example of part of the dataset
ID Crash_Count Facility Lane_Type Segment_Length _(Miles) 1 2 SRd Shared 0.12339728 2 1 SRd Shared 0.03201017 3 0 SRd Shared 0.0872396 4 1 SRd Shared 0.08627019 5 0 SRd Shared 0.08705386 6 1 SRd Shared 0.06515223 7 0 SRd Shared 0.12793783 8 0 SRd Shared 0.06319549 9 0 SRd Shared 0.0606304 10 1 SRd Shared 0.06434666
5.4 Descriptive Statistics
This section presents the descriptive statistics of collected data. This study utilizes bicycle crash data and bicycle facility data from Denver open data
(https://www.denvergov.org/opendata). Using this information, this thesis created crash data on each bicycle facility segment. Figure 5.6 indicates crash count on bicycle facilities. Total number of crashes is 2,220. Crash count on bicycle facility is 897.
Figure 5.6 Crash count on bicycle facilities in the city of Denver from 2013 to 2019
Figure 5.7 shows the crash count for each bicycle facility used in the analysis. In terms of number of crashes, there are 324 crash counts on bike lanes. Bike lanes had the highest number of crashes among all bicycle facilities. Next, there are 226 crashes on shared roadways, where the second highest crash numbers occurred. Buffered bike lanes had the least number of crash occurrences with 49 bicycle crashes. Accidents occurring in cycle tracks and roads with sharrows, were 91 and 119, respectively.
2220 897
0 500 1000 1500 2000 2500
Total On bicycle facility
Figure 5.7 Crash Count on bicycle facility by type in city of Denver from 2013 to 2019
Figure 5.8 indicates the percentage of each bicycle facility site located in Denver. This study dealt with five bicycle facility types: bike lane, buffered bike lane, cycle track, shared roadway, and sharrow. The total number of all bicycle facilities is 3,771. The largest number of bicycle facilities included in this study are shared roadways. It is 58% of the total. Next, bike lanes are 30% of total. Buffered bike lanes and cycle tracks accounted for 3% and 2%, respectively.
Figure 5.8 Percentage of each existing bicycle facility type in city of Denver in 2019 (Data source: the Denver open data portal)
324 49 91 226 119 0 50 100 150 200 250 300 350
Bike Lane Buffered bike
lane Cycle track Shared Sharrow
30% 3% 2% 58% 7% Bike lane
Buffered bike lane Cycle Track Shared Roadway Sharrow
This paper classified bicycle facilities into two categories: separated bicycle lanes and shared roadways. Separated bicycle lanes include bike lanes, buffered bike lane and cycle tracks. Shared roadways include shared roadways and sharrows. Figure 5.9 below depicts crash counts on separated bicycle lanes and shared roadways. There were 444 accidents on separated bicycle lanes, which was 65 more than on the shared
roadways.
Figure 5.9 Crash counts on separated bicycle lanes and shared roads in city of Denver from 2013 to 2019
Figure 5.10 shows the percentage distribution between separated bicycle lanes and shared roads. There are 1,316 separated bicycle lanes, accounting for 35% of the total and 2455 shared roads, accounting for 65% of the total. There are about twice as many
444 379 1 51 101 151 201 251 301 351 401 451 501
shared roads as separated bicycle lanes.
Figure 5.10 Percent of separated bicycle lanes and shared roads in city of Denver from 2013 to 2019
35%
65%
Separated bicycle lane Shared road
Chapter 6 Results
This study deduces p-value is less than 0.05 is statistically significant. Likewise, there is a strong significant of that variable. Plus, the p-values could be showed as Pr >|t|.
6.1 Comparing the impact of shared bicycle lanes and separated bicycle lanes on bicycle crashes
The first research objective was to determine the impact of shared bicycle lanes and separated bicycle lanes on bicycle crashes. There were a total of 2,083 bicycle lanes used in this analysis. A Poisson rate regression model (page. 23) was run in SAS 9.4 to compare separated bicycle lanes and shared roads. Overall, there was a significant effect of lane type. Table 6.1 shows parameter estimates. They indicated that the groups are different or same. Large t-value tells you that the groups are different. Table 6.1 also indicated that two variables are different on this analysis. Plus, there is a statistically significant (t value is 15.9, DF = 3769, p value < 0.0001**).
The estimated model: logO𝑐̅ 𝑠Q R = −1.22 + 0.77 × 𝐿𝑎𝑛𝑒𝑇𝑦𝑝𝑒
where
Lane_Type [1: if separated bicycle lane 0: if shared road
Table 6.1 Parameter estimates (Separated & Shared)
Effect Lane_Type Estimate Standard Error
DF t Value Pr > |t|
Intercept -1.2190 0.03553 3769 -34.31 <.0001
Lane_Type Separated 0.7727 0.04860 3769 15.90 <.0001
Table 6.2 shows the least square means. The above mentioned that the response of this study is non-normal data. Therefore, this study used the model scale with the natural log function ( 𝜂"# = 𝑙𝑜𝑔 ?@AB
C D ) and converted to data scale. For this reason, least
square means we calculated on the model scale using the estimated equation above on the model scale and back transformed using jC= 𝑒k.
This study interprets a mean that is calculated at a bicycle segment length of 1 mile. Each bicycle facility had different segment lengths. Table 6.2 shows that the estimated average number of crashes in a separated bicycle lane is 0.64 (Standard error mean = 0.021) for 1 mile. The estimated average number of crashes in a shared is 0.3 (Standard error mean = 0.0105) crashes for 1 mile. This study inferred that there are more crashes in a separated bicycle lane than on a shared road.
Table 6.2 Lane_Type Least Squares Means (Separated & Shared)
Lane_Type Mean Standard Error
Mean 95% Confidence Interval of the Difference Lower Mean Upper Mean Separated 0.6400 0.02122 0.5997 0.6830 Shared 0.2955 0.01050 0.2756 0.3168
Figure 6.1 Plot of LSMEANS (Separated & Shared)
Table 6.3 shows the percentage change in the information discussed above. This study also interprets the percentage change. This study had mean of number of crashes for separated bicycle lane and shared but their value is decimal point instead of integer. Hence, to make the comparison readily, this study developed percentage change
information. This study interprets percentage change as the way that “A” is estimated to increase the average number of responses by 100 * (Exponentiated estimate – 1) % compared to “B” (Source: Report from SC3L, 2019). In this case, “A” is separated bicycle lanes and “B” is shared roadways. Then the number of responses reflect the crash count in this study. Table 6.3 identifies that a separated bike lane is estimated to increase the average number of crashes by 117% compared to a shared road.
0 0.1 0.2 0.3 0.4 0.5 0.6 0.7 0.8 Separated Shared
Table 6.3 The percentage change information (Separated & Shared)
6.2 Comparing between each separated bicycle lane
The second research objective was comparing the impact of each type of separated bicycle lane (e.g. bicycle lane, buffered bike lane, cycle track) on bicycle crashes. Bicycle lanes, buffered bike lanes, and cycle tracks each have different separated or protected elements. The separating element of a bicycle lane is a white solid line. Buffered bike lanes are formed by painting a flush buffer zone. The separating elements of a cycle track are a median, planter strip, or a parking lane. A cycle track has physically protected elements. In this analysis, this study uses the same analysis method used above. This study compared percentage change each separated bicycle facility; 1) Cycle Track (CT) VS Bike Lane (BL), 2) Cycle track VS Buffered Bike Lane (BBL), and 3) Buffered bike lane VS Bike lane. There are 1,316 segments of separated bicycle lanes. Thus, this analysis used 1,316 separated bicycle lane segments. Overall, there was a significant effect of facility (F value = 181.06, num df = 2, den df = 1313, p – value < 0.0001*).
The estimated model: logO𝑐̅ 𝑠Q R = 0.9669 − 1.6115BL − 1.3587BufBL where
BL [1 : if facility = Bicycle lane 0: Otherwise
BufBL [1: if facility = Buffered bike lane 0: Otherwise
Label t Value Pr > |t| Percentage Change
Exponentiated Estimate Separated vs Shared 15.90 <.0001 117% 2.1657
Table 6.4 Parameter estimates (BL, BBL, CT)
Effect Facility Estimate Standard Error DF t Value Pr > |t| Intercept 0.9669 0.07495 1313 12.90 <.0001 Facility BL -1.6115 0.08478 1313 -19.01 <.0001 Facility BufBL -1.3587 0.1271 1313 -10.69 <.0001 Facility CT 0 . . . .
There are three different categories, this study defined two dummy variables. In this case, they are bike lane and buffered bike lane. Pairwise t-tests with DF = 1313 were used to compare facilities within separated bike lanes. Table 6.5 shows that the p-value of cycle tract vs bike lane and cycle tract vs buffered bike lane is less than 0.0001. Then, p-value of buffered bike lane vs bike lane is 0.0217, this value is less than 0.05. This study conclude that this is statistically significant. The above-mentioned that large t-score deduce the groups are different. Table 6.5 also indicated that cycle tract and bike lane are most different groups than other groups.
Table 6.5 T value and Pr >|t| of analysis (BL, BBL, CT)
Label t Value Pr > |t|
Cycle Tract vs Bike Lane 19.01 <.0001
Cycle Tract vs Buffered Bike Lane 10.69 <.0001
Buffered Bike Lane vs Bike Lane 2.30 0.0217
Table 6.6 indicated the least square means for bike lane, buffered bike lane and cycle tract. This study evaluates that the estimated mean of crash count for each separated bicycle lane for 1 mile. Table 6.6 displays that the estimated average number of crashes in a bike lane is 0.52. Next, the estimated average number of crashes in a buffered bike lane is 0.68. It is slightly higher than the bike lane. Lastly, the estimated average number
of crashes in a cycle track is 2.63. It is noticeably higher than the other two separated bicycle facilities. In other words, it is much more likely for there to be a crash in the cycle track than the other two facilities.
Table 6.6 Facility LSMEANS table (BL, BBL, CT)
Facility Mean Standard Error Mean 95% Confidence Interval of the Difference Lower Mean Upper Mean BL 0.5249 0.02080 0.4856 0.5673 BufBL 0.6758 0.06934 0.5526 0.8265 CT 2.6297 0.1971 2.2701 3.0462
The plot (Figure 6.2) is a visual depiction of the LSMEANS table above.
Figure 6.2 Plot of LSMEANS (BL, BBL, CT)
0 0.5 1 1.5 2 2.5 3 3.5 BL BufBL CT
Table 6.7 shows the percentage change information discussed above. A cycle track facility is estimated to increase the average number of crashes by 401% compared to bike lane facility. Then, with 95% confidence, a cycle track facility increases the true average number of crashes by anywhere between 324% to 492% compared to a bike lane facility. Next is a cycle track versus buffered bike lane. A cycle track facility is estimated to increase the average number of responses by 289% compared to buffered bike lane facility. The third one is buffered bike lane versus bike lane. A buffered bike lane is estimated to increase the average number of responses by 29% compared to bike lane facility. Overwhelming, the data shows that crashes occur more often in the, the cycle track compared to the other facilities. It can also be seen that the more physical the protected method is, the more accidents seem to occur.
Table 6.7 The percentage change information (BL, BBL, CT)
Label Percentage Change (Exponentiated Estimate) Exponentiated Estimate
95% Confidence Interval of the Difference
Percentage Change (Exponentiated Lower) Exponentiated Lower Percentage Change (Exponentiated Upper) Exponentiated Upper Cycle Tract vs Bike Lane 401% 5.0102 324% 4.2425 492% 5.9168 Cycle Tract vs Buffered Bike Lane 289% 3.8910 203% 3.0326 399% 4.9925 Buffered Bike Lane vs Bike Lane 29% 1.2876 4% 1.0377 60% 1.5977
Chapter 7 Discussion
This study used a Poisson Rate Regression analysis method, incorporating crash data with current bicycle facilities, to observe the impact of separated bicycle facilities in Denver, Colorado. The first objective of this study aimed to find the impact of shared bicycle roads and separated bicycle facilities on bicycle crashes. The second goal of this study was to identify which of the various types of separate bike facilities is safest. The findings of this study suggested that a separated bike lane is estimated to increase the average number of crashes by 117% compared to shared road. This study also found that cycle track facilities are estimated to have increased the average number of collisions by 401% compared to the bicycle lane. Compared to the buffer bike lane facility, the cycle track facility is estimated to have increased the average number of collisions by 289%. Plus, a buffered bike lane leads to an estimated 29% increase in the mean number of crashes when compared to a bike lane. This result shows that there are more bicycle crashes in the separated bike lane than in shared roads. Among separated bicycle facilities, the cycle track, where physically separated facilities were installed, was most likely to cause bicycle crashes.
The findings of this study are statistically significant; all consequences were in the hypothesized direction of this thesis. Previous research indicated that the ultimate goal of the separate bicycle facility (SBF) is to separate the motor vehicles, bicycles, and pedestrians. There are two main reasons why SBFs are typically proposed: improving safety and increasing bicycle use (Forsyth & Krizek, 2010). In addition, this facility can be seen to increase bicycle volume and speed. However, Forsyth & Krizek (2010) indicated that the findings on separated bicycle facilities are mixed; empirically, they are
not safer, in part because intersections are one of the most problematic locations for cyclists, and they make intersections more complex.
Through the investigation of the actual case in Denver, actual data supports this statement. Figure 7.1 describes the specific location of the crash with intersections, alleys, driveways, highway interchanges, and parking lots in Denver from 2013 to 2019. This graph shows that the number of crashes at the intersection is 1,350. The number of crashes at the intersection and number of crashes intersection related is 1,520. The total crash count is 2,221. Hence, intersection accidents (including the intersection related) are well over half of the total number of accidents.
Figure 7.1 The specific location of the bicycle crashes in Denver from 2013 to 2019
Table 7.1 shows the analysis of the bicycle crash at the intersection. The intersection crash count of separated bicycle facilities is 332, and it is bigger than the shared roads. However, separated bicycle facilities and shared roads have a different number of intersections. To normalize the data, this study divided intersection crash count and
1350 170 357 105 167 40 15 4 0 200 400 600 800 1000 1200 1400 1600 At intersection Intersection related Non intersection Alley related Driveway access related Parking lot Highway interchange Roundabout
number of intersections. The value of separated bicycle facilities is twice as large as the value of the shared road.
Table 7.1 Bicycle crash at intersection analysis
This study suggests the solution for improving the safety of the separated bicycle facility. Previous research recommended improving the separated bicycle lane at intersection design. Because, riding on a separate bicycle lane will allow the cyclist to feel safe and conscious of it, but at the same time, be aware that it is dangerous at intersections and that more accidents may occur than on shared roads. The following section presents several potential recommendations to improve the design of intersection of separated bicycle facilities. U.S. Department of Transportation (DOT.US) (2015) published a separated bike lane planning and design guide and they recommend several separated bicycle facility intersection designs.
First is bend-in and bend-out design. The developer may choose to either "bend-in" or "bend-out" the separate bicycle facility at the intersection to reduce the likelihood of conflict with right-turning vehicles when the separate bicycle facility reaches an intersection with right-turning vehicles already positioned to the left of the separate bike lane (DOT.US, 2015). Figure 7.2 shows an example of bend-in intersection design. The dark grey car is a parked car, and the dark green car is a driving car. This design allows
Separated bicycle
facility Shared road
Total crash count 444 379
Intersection crash count 332 285
Number of Intersection 1197 2173
Intersection crash count /
motorists on a side street to see bicycles and vehicles in a similar field of vision (DOT.US, 2015).
Figure 7.2 Depiction of bend-in design (Source: DOT.US)
Another good option, the bend-out model, takes downstream bicyclists off the intersection on the side street, allowing vehicles to complete turning motions before engaging with bicyclists. Figure 7.3 shows a depiction of bend-out design.
Figure 7.3 Depiction of bend-out design (Source: DOT.US)
Another design recommendation is intersection markings. There are two types of intersection markings; 1) line markings and, 2) Green colored pavement. Figure 7.4
shows an example of line intersection markings. DOT.US (2015) suggested that white dashed lines can be used through intersections or other areas of traffic conflict to mark extensions of the separate bike facility. These dotted lines are proposed to increase visual awareness of the location of bicyclists (DOT.US, 2015). Figure 7.5 displays an example of green colored pavement marking.
Figure 7.4 Example of lines marking in Seattle (Source: Steve Ringman / The Seattle Time)
Figure 7.5 Example of green colored pavement marking in Vancouver, Canada. (Source: Madi Carlson)
The next design recommendation is bicycle turning movements. DOT.US (2015) indicated that to allow bicyclists to comfortably navigate intersections, where these
movements are allowed, intersection design must account for right-turning and left-turning movements. There are two types of movements of the bicycle; 1) Bike boxes and early exit, and 2) 2- Stage turn queue boxes. Bike boxes (Figure 7.6) are allocated spaces at signalized intersections that allow bicyclists to wait at red lights in line before motor vehicles. It allows cyclists to start and reach the intersection in front of motor vehicles when the signal is green (DOT.US, 2015).
Figure 7.6 Depiction of Bike boxes design (Source: DOT.US)
Next is the 2- Stage Turn Queue Boxes (Figure 7.7). This requires cyclists to turn left from a separate bike facility on the right or turn right from a separate bike facility on the
left. (DOT.US, 2015). Bicyclists who reach the intersection on a green light pull out into the two-stage queue box away from moving bikes and cross-street traffic.
Figure 7.7 Depiction of 2- Stage Turn Queue Boxes design (Source: DOT.US)
This study recognizes that there are other influential and determinant factors in bicycle crashes besides the type of bicycle facilities. Several studies agree that lighting conditions and higher speed limits have a significant effect on bicycle crash severity (Bahrololoom et al, 2016, Chen and Shen, 2016). Also, heavier traffic contributes significantly to bicycle crashes (Romanow, et al. 2012). Moreover, retail establishments and path
presence of a retail establishment increased the likelihood of severe injury. In addition, good road conditions also have a positive effect on serious injuries (Romanow, et al, 2012). Another influential factor in bicycle crash is road signals. Areas with more road signals and street parking signs are more likely to have bicycle crashes (Chen, 2015)
Chapter 8 Limitation
As with all studies, this study also had limitations. First, the dependent variable was not perfect. This thesis applied the crash count as the dependent variable. It is difficult to assess the crash rate only by the number of accidents that occurred in a particular segment. This study divided the length of the road by the crash count in order to normalize, but this crash rate is still inaccurate. Fournier, Christofa, & Knodler (2019) mentioned that the purpose of calculating crash rates is to normalize crash data to offset for exposure to different traffic volumes. To improve the accuracy of the crash rate, we needed the average volume of bicycles per day and data such as average volume of vehicles per day for each segment. Bicycle and motorized vehicles volume affected bicycle crash frequency (Fournier, Christofa, & Knodler, 2019). However, this thesis could not obtain auto-mobile traffic volume and bicycle volume data that corresponded with the crash data that was used.
Second, this study covers data that combines the number of crashes between 2013 and 2019. Usually, separate bike lanes are built on high-volume and/or speed with streets. (FDM, 2011) Therefore, a separated bicycle lane may have been installed where there was a high probability of an accident. For a more accurate investigation, it should be examined to compare the crash trend before and after the installation of the separated bicycle lanes. If possible, future research needs to assess the time series method.
Third, the study calculated by overestimated by accounting for the crash on all street segments touching the intersection when a collision at the intersection occurred. For example, crash occur in the midblock, one crash point intersects with one bicycle facility segment line. In this case, it is not problematic (See figure 8.1).
Figure 8.1 Example of crash point on midblock in city of Denver
However, when both segments are in contact with the intersection, and accidents that occur at the intersection are calculated for each segment that is in contact. Figure 8.2 shows an example of this situation. There are 1,2,3,4 segments. They are touching each other and share the same intersection. And there are crashes in that intersection. That crash count applies equally across all adjacent segments (1,2,3,4 segments). This can occur because the address of the accident in the intersection is only the intersection address and there is no information about the direction of the vehicle or the more adjacent segments. Instead, in descriptive statistics and the specific location of the bicycle crashes analysis (see page 25, 37), the overestimated crash count at an intersection does not happen because the crash count is not calculated by each bicycle facility segment but by the overall bicycle facilities.
If there is information about the exact location of the accident on intersection, that is, the direction of vehicles or where the adjoining segment of crash is located, it can be more accurately aggregate the individual intersection crash counts into the bicycle facility segment.
Figure 8.2 Example of crash on intersection in city of Denver
Fournier, Christofa, & Knodler (2019) mentioned that the analysis about bicycle safety is regularly evaluated operating one volume, failing to compensate for an important
normalizer. Plus, they are implemented using excessively accumulated regional data (Fournier, Christofa, & Knodler, 2019). Hence, future research should take this into consideration when conducting bicycle safety studies.
Chapter 9 Planning Implications
As the number of cyclists grow in Denver and the flow of cycling into transportation increases, city planners need to pay more attention to bicycle safety in urban areas. Cushing et al. (2016) argued that bicycle infrastructure could help improve cycling safety and increase cycling. The literature consistently indicates that the lack of cycling infrastructure is the main detriment to increased cycling. Hence, many planners, policymakers, politicians, and activists consider that cycling infrastructure is an essential factor in bicycle safety. The amount of urban planning interventions for cycling
environments and infrastructure has increased. Separated bicycle facilities are also significant aspects of bicycle planning these days. Separated bicycle facilities can be improving traffic safety for all street users, particularly when implemented as part of a “road diet” or other transportation calming projects (the U.S. Department of
Transportation, 2015). City planners recognize the importance of separated bicycle facilities and have gradually increased the number of separated bicycle facilities throughout the country. Interest in separated bicycle lanes continues to grow in the United States, and the list of separated facilities planned and implemented nationwide is increasing rapidly (the U.S. Department of Transportation, 2015).
This study found that separate bicycle lanes have more crashes over time than shared roads, but the results of this study would also support to bicycle crash
countermeasures and the identification of the most applicable solutions for bicycle crash issues in separated bicycle lanes. Plus, city planners can use these results to improve bike safety and it could be useful for politicians and legislators to pay attention to how they use and enforce physical separation in practice.
Chapter 10 Conclusion
To become a bike-friendly city, cities are increasing the installation of separated bicycle lanes. Separated bicycle lanes increase a cyclist’s feeling of security and can encourage a more active lifestyle. However, an emerging issue is whether a separate bicycle lane is actually safer for a cyclist as actual traffic accident data has failed to determine if separated bicycle facilities are indeed safer.
This paper evaluated the impact of separated bicycle facilities on bicycle crashes by a Poisson Rate Regression analysis method, incorporating crash data with current bicycle facilities in the city of Denver, CO. The results largely confirmed the significant effects of separated bicycle lanes on a bicycle crash. The findings in this study were statistically significant, and all consequences affirmed the hypothesis of the thesis: separated bicycle facilities are more dangerous than the shared roads. The results of this study deduce that there are more bicycle injuries in the separated bike lanes than in shared roads. Of the various types of separated bicycle lanes, the cycle track was most likely to have bicycle crashes that occur on them. This indication provides evidence for urban and traffic planners as to whether a separate bicycle lane is the safer alternative to ride a bicycle in and if, on the other hand, it poses a real risk.
Finally, this study suggested that future studies should create and compare more accurate crash rates using bicycle and traffic volume data. Also, to examine the crash rate before and after the installation of a separated bicycle lane on a specific street, the future investigation will need to incorporate the time-series study
Bibliography
Bahrololoom, S., Moridpour, S., & Tay, R. (2016, November). Factors affecting bicycle fatal and serious injury crashes in Victoria, Australia. In Paper Presented at the The 38th Australasian Transport Research Forum.
Bikemunk (2018, June 29). 25 Biking Statistics That Won't Surprise You At All (if you love cycling). Retrieved from https://www.bikemunk.com/biking-statistics/. Caulfield, B., Brick, E., & McCarthy, O. T. (2012). Determining bicycle infrastructure
preferences–A case study of Dublin. Transportation research part D: transport and environment, 17(5), 413-417.
Chen, L., Chen, C., Srinivasan, R., McKnight, C. E., Ewing, R., & Roe, M. (2012). Evaluating the safety effects of bicycle lanes in New York City. American journal of public health, 102(6), 1120-1127.
Chen, P. (2015). Built environment factors in explaining the automobile-involved bicycle crash frequencies: A spatial statistic approach. Safety science, 79, 336-343.
Chen, P., & Shen, Q. (2016). Built environment effects on cyclist injury severity in automobile-involved bicycle crashes. Accident Analysis & Prevention, 86, 239-246.
City and County of Denver, Denver Police Department. (n.d) Retrieved from
https://www.denvergov.org/opendata/dataset/city-and-county-of-denver-traffic-accidents
Cushing, M., Hooshmand, J., Pomares, B., & Hotz, G. (2016). Vision Zero in the United States versus Sweden: infrastructure improvement for cycling safety. American journal of public health, 106(12), 2178-2180
Denver Moves: Making Bicycle and Multi-Use Connections. (2011). Retrieved from https://www.denvergov.org/content/dam/denvergov/Portals/708/documents/FINA L_Denver_Moves.pdf.
Duthie, J., Brady, J. F., Mills, A. F., & Machemehl, R. B. (2010). Effects of on-street bicycle facility configuration on bicyclist and motorist behavior. Transportation Research Record, 2190(1), 37-44.
Forester, J. (2001). The bicycle transportation controversy. Transportation Quarterly,
55(2).
Forsyth, A., & Krizek, K. J. (2010). Promoting walking and bicycling: assessing the evidence to assist planners. Built Environment, 36(4), 429-446.
Fournier, N., Christofa, E., & Knodler Jr, M. A. (2017). A mixed methods investigation of bicycle exposure in crash rates. Accident Analysis & Prevention.
Franklin, J. (1999). Two decades of the redway cycle paths in Milton Keynes. Traffic engineering & control, 40(7/8).
Franklin, John (2001). "Cycling in the wrong direction". Traffic Engineering & Control.
Franklin, John (2002). Achieving Cycle-Friendly Infrastructure. Cycle-Friendly Infrastructure Conference. University of Nottingham.
Groover, H. (2019, July 22). Seattle could be next to try Dutch-style bike-friendly intersection design. Retrieved from https://www.seattletimes.com/seattle- news/transportation/seattle-could-be-next-to-try-dutch-style-bike-friendly-intersection-design/.
Hamann, C., & Peek-Asa, C. (2013). On-road bicycle facilities and bicycle crashes in Iowa, 2007–2010. Accident Analysis & Prevention, 56, 103-109.
Heine, J. (2013, November 15). Bike to Work 3: Separate or Equal? Retrieved from
https://janheine.wordpress.com/2013/05/15/bike-to-work-3-separate-or-equal/. Hels, T., & Orozova-Bekkevold, I. (2007). The effect of roundabout design features on
cyclist accident rate. Accident Analysis & Prevention, 39(2), 300-307.
Hernandez, E. L. (2019, May 29). CU Denver study: Cities with protected bike lanes are safer for cyclists and drivers. Retrieved from https://denverite.com/2019/05/29/cu-denver-study-cities-with-protected-bike-lanes-are-safer-for-cyclists-and-drivers/.
IDRE Stats. (n.d.). Retrieved from https://stats.idre.ucla.edu/spss/output/t-test/.
Jensen, S. U., Rosenkilde, C., & Jensen, N. (2007). Road safety and perceived risk of cycle facilities in Copenhagen. Presentation to AGM of European Cyclists Federation.
Jensen, S. U. (2008, January). Bicycle tracks and lanes: A before-after study. In Transportation Research Board 87th Annual Meeting (pp. 1-13).
Kelly, P., Kahlmeier, S., Götschi, T., Orsini, N., Richards, J., Roberts, N., ... & Foster, C. (2014). Systematic review and meta-analysis of reduction in all-cause mortality from walking and cycling and shape of dose response relationship. International journal of behavioral nutrition and physical activity, 11(1), 132.
Li, Z., Wang, W., Liu, P., Bigham, J. M., & Ragland, D. R. (2013). Using Geographically Weighted Poisson Regression for county-level crash modeling in
California. Safety Science, 58, 89–97. doi: 10.1016/j.ssci.2013.04.005va Lott, D. F., & Lott, D. Y. (1976). Differential effect of bicycle lanes on ten classes of