Benchmarking the Intel®Xeon®Platinum 8160 Processor
Document Revision 1.0 August 10, 2017
Antonio Gómez-Iglesias, Feng Chen, Lei Huang, Hang Liu, Si Liu, Carlos Rosales
{agomez, chenk, huang, hliu, sliu, carlos}@tacc.utexas.edu
Texas Advanced Computing Center
The University of Texas at Austin
www.tacc.utexas.edu
Copyright 2017 The University of Texas at Austin.
Permission to copy this report is granted for electronic viewing and single-copy printing. Permissible uses are research and browsing. Specifically prohibited are sales of any copy, whether electronic or hardcopy, for any purpose. Also prohibited is copying, excerpting or extensive quoting of any report in another work without the written permission of one of the report’s authors.
The University of Texas at Austin and the Texas Advanced Computing Center make no warranty, express or implied, nor assume any legal liability or responsibility for the accuracy, completeness, or usefulness of any information, apparatus, product, or process disclosed.
Contents
1 Introduction 3
1.1 Hardware Characteristics . . . 3
1.2 Software Stack. . . 4
2 Memory Bandwidth 6 3 Floating Point Performance 8 4 OpenMP 10 5 MPI 13 5.1 Internode Latency . . . 13 5.2 Intranode Bandwidth. . . 13 5.3 Internode Bandwidth. . . 14 6 Applications 16 6.1 WRF. . . 18 6.2 FLASH . . . 20 6.3 NAMD . . . 22 6.4 GROMACS . . . 24 6.5 Python . . . 26 6.6 tblastx. . . 27 TR-17-01 1
List of Figures
1 Dual socket SKX. Turbo frequency. . . 4
2 Hardware description for compute node from HWLOC. . . 5
3 Dual socket SKX node. STREAM Triad . . . 7
4 Dual socket SKX node. STREAM Triad. Local Memory. . . 7
5 Dual socket SKX node. TFLOPS for different matrix sizes. . . 8
6 Dual socket SKX node. TFLOPS for different threads. . . 9
7 Dual socket SKX node. OpenMP synchronization overhead (spread). . . 10
8 Dual socket SKX node. OpenMP synchronization overhead (compact). . . 11
9 Dual socket SKX node. OpenMP constructs overhead (spread). . . 11
10 Dual socket SKX node. OpenMP constructs overhead (compact).. . . 12
11 Effective inter-node latency for a single pair of MPI tasks. . . 13
12 Effective intra-node bandwidth for a single pair of MPI tasks . . . 14
13 Effective inter-node bandwidth for a single pair of MPI tasks . . . 15
14 Internode bandwidth. . . 15
15 WRF: Speedup Relative to SNB . . . 18
16 WRF: ISA impact . . . 19
17 FLASH: Speedup Relative to SNB . . . 20
18 FLASH: ISA impact . . . 21
19 NAMD: Speedup Relative to SNB . . . 22
20 NAMD: ISA impact . . . 23
21 GROMACS: Speedup Relative to SNB . . . 24
22 GROMACS: ISA impact. . . 25
23 Julia: Speedup Relative to SNB . . . 26
24 Pairwise: Speedup Relative to SNB . . . 26
1
I
NTRODUCTION
This report presents a set of results for different microbenchmarks and applications on the Intel Xeon Platinum 8160 Processor, formerly known as Skylake. For simplicity, we will use both Skylake and SKX to refer to this processor. We use the Skylake nodes that will be available in Stampede2. This system will provide Intel Knights Landing and Skylake chips interconnected by a 100 Gb/sec Intel Omni-Path (OPA) network with a fat tree topology. The peak performance of the system will be 18 PF.
1.1 Hardware Characteristics
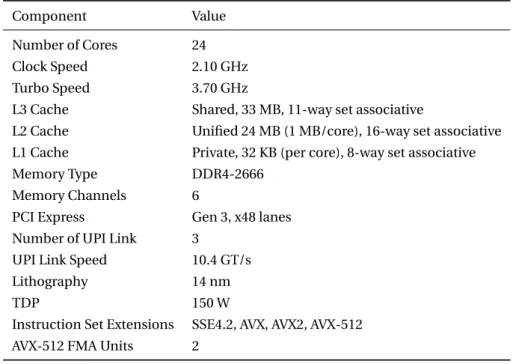
Table1shows the main characteristics of the processor.
Component Value
Number of Cores 24
Clock Speed 2.10 GHz
Turbo Speed 3.70 GHz
L3 Cache Shared, 33 MB, 11-way set associative
L2 Cache Unified 24 MB (1 MB/core), 16-way set associative
L1 Cache Private, 32 KB (per core), 8-way set associative
Memory Type DDR4-2666
Memory Channels 6
PCI Express Gen 3, x48 lanes
Number of UPI Link 3
UPI Link Speed 10.4 GT/s
Lithography 14 nm
TDP 150 W
Instruction Set Extensions SSE4.2, AVX, AVX2, AVX-512
AVX-512 FMA Units 2
Table 1:Intel Xeon Platinum 8160 Characteristics
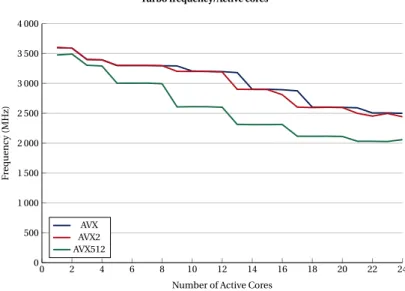
Effective CPU frequency depends on the instructions that are executed and the number of active cores on the chip. The most effective instruction set for a given code will depend on implemen-tation details. Fig.1shows the CPU turbo frequency depending on the instruction set and the number of active cores on the chip.
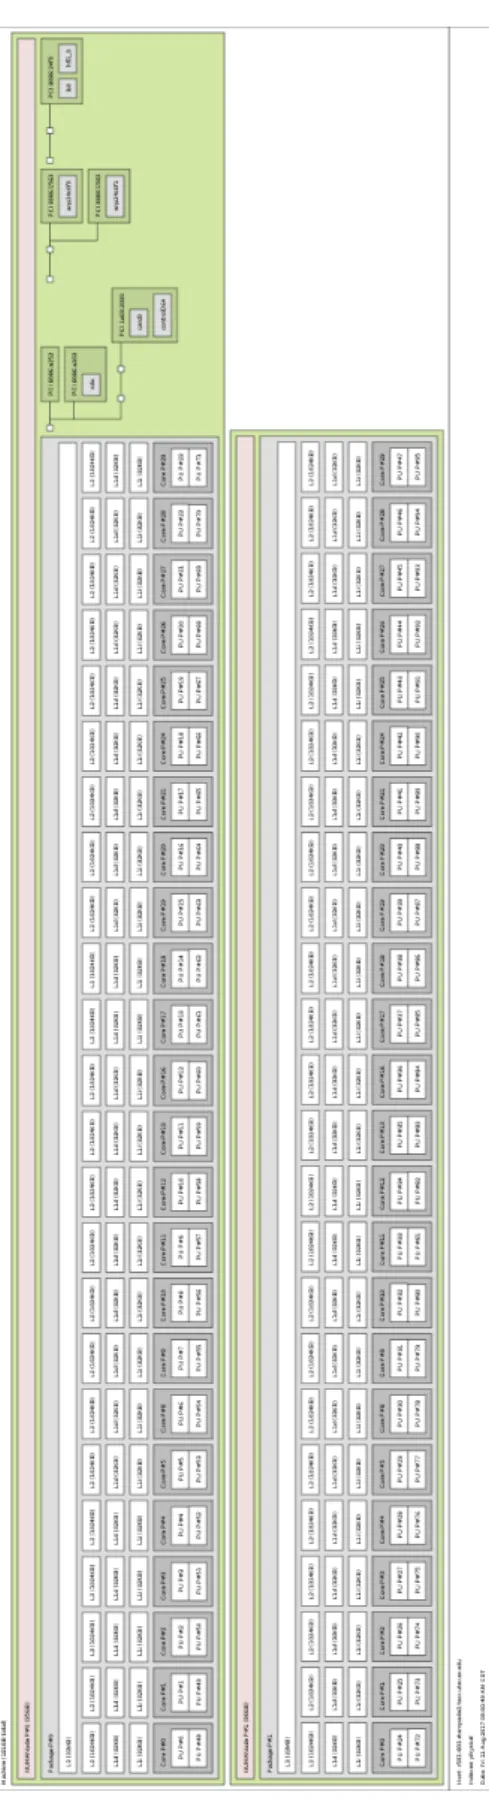
In the system used, each compute node consists of two sockets of Xeon Platinum 8160 and 192
GB of main memory. As shown in Figure2the local disk (sda), the Omni-Path link, and the
management GE network interfaces are connected to socket 0.
0 2 4 6 8 10 12 14 16 18 20 22 24 0 500 1 000 1 500 2 000 2 500 3 000 3 500 4 000
Number of Active Cores
F re quency (MH z) AVX AVX2 AVX512
Turbo frequency/Active cores
Figure 1:Dual socket SKX. Turbo frequency.
1.2 Software Stack
At the time our running our tests, the software stack was as shown in Table2.
Element Version
Kernel 3.10.0-514.26.2.el7.x86_64
Compiler Intel version 17.0.4
BLAS Intel MKL 2017 update 3
MPI Intel MPI version 17.0.3
Omni-Path 10.4.1.0
Figure 2:Hardware description for compute node from HWLOC
2
M
EMORY
B
ANDWIDTH
Memory bandwidth is critical for many scientific codes. While floating point processing power has increased tremendously over the years, memory bandwidth has grown at a much slower rate. As a consequence of this disparity in growth, modern systems tend to be fairly imbalanced when comparing the number of words that can be retrieved from memory per cycle with the number of floating point operations that can be executed per cycle. While certain codes make excellent use of the cache hierarchy (reusing cached data, ensuring contiguous memory access, etc, ...) other can’t because of algorithmic limitations or because they have been written in a manner that does not use the memory subsystem optimally. Thus, having a measure of the sustained memory bandwidth of a system is an important step in the process to understand the performance one may expect for a broad range of applications.
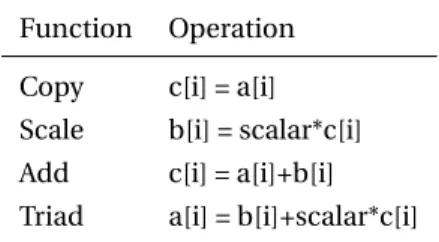
The system memory bandwidth was measured using the STREAM benchmark revision 5.10 [9].
This benchmark is the industry standard for measuring sustained memory bandwidth. It consists of four tests, described in Table3. For our results, we consider the output of theTriadtest.
Function Operation
Copy c[i] = a[i]
Scale b[i] = scalar*c[i]
Add c[i] = a[i]+b[i]
Triad a[i] = b[i]+scalar*c[i]
Table 3:STREAM benchmark operation definitions
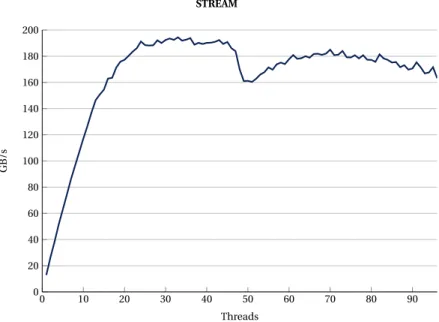
We used the OpenMP implementation of STREAM. We increased the number of threads from 1 to 96 to explore the memory bandwidth on a single socket, on two sockets, and with hyperthreading.
The results can be seen in Fig. 3. Once the number of threads reached 33, the bandwidth was
saturated and did not improve. The peak in this case was 194 GB/s. Once the number of threads exceeded the number of physical cores available, the achieved bandwidth decreased.
0 10 20 30 40 50 60 70 80 90 0 20 40 60 80 100 120 140 160 180 200 Threads GB /s STREAM
Figure 3:Dual socket SKX node. STREAM Triad
0 5 10 15 20 25 30 35 40 45 0 20 40 60 80 100 120 Threads GB /s Local Memory Remote Memory STREAM
Figure 4:Dual socket SKX node. STREAM Triad. Local Memory.
3
F
LOATING
P
OINT
P
ERFORMANCE
Floating point performance is the traditional measure of machine performance for High Per-formance Computing systems, and represents the overall system capability for performing mathematical operations. Typical benchmarks for overall floating point capability are the Linpack benchmark (HPL, used for the TOP500 list, see references [5] and [1]) and matrix matrix multiplication tests. These algebraic tests have highly optimized implementation with high data reuse and fairly limited memory bandwidth requirements, which are capable of achieving floating point performances very close to the theoretical peak performance of the hardware. Floating point performance is critical for scientific workloads, since they very often rely on solving an algebraic system of equations. Even if a scientific workload is not directly solving a system of linear equations it is likely that it will make extensive use of the floating point capability of the system during tasks like post-processing and data analysis. This makes the determination of the floating point capability of a compute system another essential element in an overall understanding of the system performance.
The tests performed in this section are limited to single node executions, since the purpose is to evaluate the processor floating point performance in isolation form network communication and
other factors present in distributed execution. The DGEMM benchmark developed by NERSC1
was used to measure the multithreaded performance of the BLAS call DGEMM. The code was compiled to directly call Intel MKL at runtime.
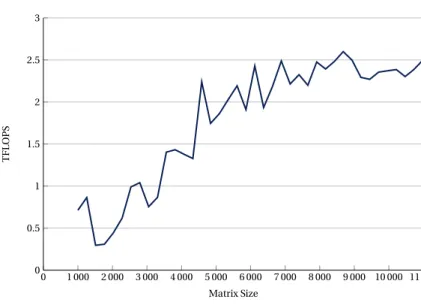
Fig.5shows the TFLOPS achieved by a dual socket SKX node for different matrix sizes. The
com-mand used for these results wasMKL_ENABLE_INSTRUCTIONS=AVX512 OMP_NUM_THREADS=48
./mt-dgemm $size, where $si zeis the x-axis value in the figure.
0 1 000 2 000 3 000 4 000 5 000 6 000 7 000 8 000 9 000 10 000 11 000 0 0.5 1 1.5 2 2.5 3 Matrix Size TFL OPS DGEMM
Figure 5:Dual socket SKX node. TFLOPS for different matrix sizes.
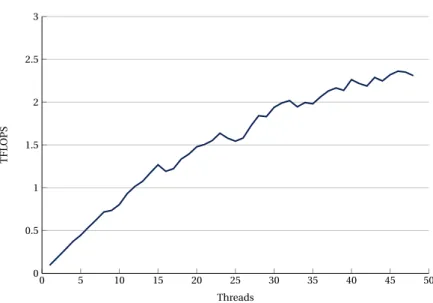
Fig.6shows the TFLOPS achieved by a dual socket SKX node when using a fixed matrix size of 10000 and increasing the number of threads from 1 to 48 (total number of cores in the the node). We did not use hyperthreading since it did not help in our preliminary tests.
0 5 10 15 20 25 30 35 40 45 50 0 0.5 1 1.5 2 2.5 3 Threads TFL OPS DGEMM
Figure 6:Dual socket SKX node. TFLOPS for different threads.
4
O
PEN
MP
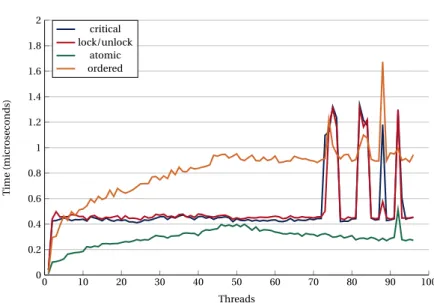
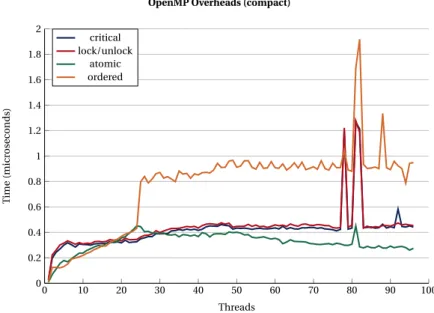
OpenMP is one of the most commonly used shared memory parallel programming models. The continuous trend of increasing core count per socket to improve system performance makes threading performance critical for many codes, both shared memory and hybrid. In this section we investigate the synchronization overhead of a wide variety of OpenMP (OMP) language constructs.
OpenMP overhead was measured using the EPCC OpenMP benchmark v3.1. For implementation details see [4]. The benchmark was executed using two different affinity settings: scatter, using
OMP_PROC_BIND=spreadand compact, usingOMP_PROC_BIND=close.
Fig.7and8show the overhead of the most common synchronization constructs in OpenMP when
using scatter and compact affinity.
0 10 20 30 40 50 60 70 80 90 100 0 0.2 0.4 0.6 0.8 1 1.2 1.4 1.6 1.8 2 Threads T ime (micr osec o n ds) critical lock/unlock atomic ordered
OpenMP Overheads (spread)
Figure 7:Dual socket SKX node. OpenMP synchronization overhead (spread).
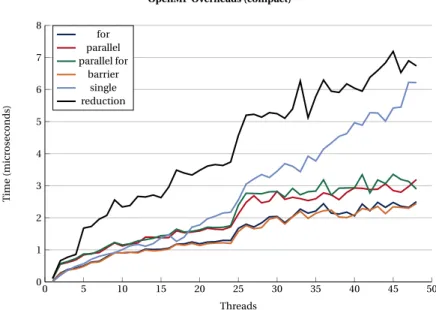
Fig. 9and10depict the overheads of the most typical OpenMP constructs for the two affinity settings studied.
0 10 20 30 40 50 60 70 80 90 100 0 0.2 0.4 0.6 0.8 1 1.2 1.4 1.6 1.8 2 Threads T ime (micr osec o n ds) critical lock/unlock atomic ordered
OpenMP Overheads (compact)
Figure 8:Dual socket SKX node. OpenMP synchronization overhead (compact).
0 5 10 15 20 25 30 35 40 45 50 0 1 2 3 4 5 6 7 8 Threads T ime (micr osec o n ds) for parallel parallel for barrier single reduction
OpenMP Overheads (spread)
Figure 9:Dual socket SKX node. OpenMP constructs overhead (spread).
0 5 10 15 20 25 30 35 40 45 50 0 1 2 3 4 5 6 7 8 Threads T ime (micr osec o n ds) for parallel parallel for barrier single reduction
OpenMP Overheads (compact)
5
MPI
5.1 Internode Latency
MPI latency is of importance to codes that exchange small messages, where latency plays a more significant role than bandwidth. Codes with irregular communication patters typically benefit from short latencies. When looking a latency values off node the limiting factors will be the network interconnect and adapter, while on node the limiting factor will be the memory subsystem, including the socket to socket communication pathways.
Fig. 11shows the latency between 2 nodes on the same rack. On both nodes, the MPI task is
pinned to core 0. The latency in this case is 1.06 usec. For the case of socket 1 to socket 1 (pinning to core 24 on each node), the latency is 1.19 usec.
100 101 102 103 104 105 106 0 50 100 150 200 250 300 350
Message Size (Bytes)
Laten
cy
(us)
MPI Latency
Figure 11:Effective inter-node latency for a single pair of MPI tasks
5.2 Intranode Bandwidth
On node exchanges do not go through the Omni-Path network and thus are not limited by its characteristics. The effective bandwidth achieved within a node is limited, instead, by the memory subsystem properties for the node and the memory contention when multiple tasks exchange data simultaneously.
Fig.12shows the effective bandwidth for a single pair of MPI tasks. Three cases are presented. In the first case the two tasks are bound to the first socket, to cores 0 and 1. In the second case the tasks are bound one to each socket and, in particular, to cores 0 and 24. In the last case the tasks
are bound to the second socket, to cores 24 and 25. The achieved bandwidth is very similar in all three cases. For these experiments, to allocate memory on the closest NUMA node to the core where the MPI task is running.
100 101 102 103 104 105 106 0 2 000 4 000 6 000 8 000 10 000
Message Size (Bytes)
B an dwi d th (MB/ s) 0+1 0+24 24+25
MPI Intranode Bandwidth
Figure 12:Effective intra-node bandwidth for a single pair of MPI tasks
5.3 Internode Bandwidth
Many scientific codes require some type of distributed memory model because of their scale and complexity. The Message Passing Interface (MPI) framework allows for communication in distributed systems, and is the de facto standard for codes working in distributed memory systems. Codes that have large messages to exchange depend heavily on the MPI bandwidth supported by the system for their performance, especially if they execute mainly blocking calls or collective operations. Understanding the achievable MPI bandwidth in a system is critical for estimating scalability of distributed codes.
Figure13shows the inter-node bandwidth achievable for different message size. For these tests one MPI task was bound to the first socket on each node.
Fig.14shows the internode bandwidth achieved running OSU benchmark 5.3.2. For these results, one MPI task is pinned to a specific core on one node and the other process is pinned to another core on the other node. A double for loop allows to explore all the combinations of sender and receiver for all the cores in both nodes.
100 101 102 103 104 105 106 0 2 000 4 000 6 000 8 000 10 000 12 000
Message Size (Bytes)
B an dwi d th (MB/ s) MPI Bandwidth
Figure 13:Effective inter-node bandwidth for a single pair of MPI tasks
Figure 14:Internode bandwidth
6
A
PPLICATIONS
We chose a set of representative HPC applications. Several of these codes are among the ten most used applications in Stampede, while other are good representations of common workloads. For these results, SKX is a dual socket node where each socket presents the characteristics described on Table1. SNB is a dual socket Sandy Bridge node as shown in Table4. HSW is dual socket Intel Haswell node that follows the specifications in Table5. Finally, KNL is an Intel Knights Landing chip as shown in Table6.
Component Value
CPU Sockets 2×Intel Xeon E5-2680 (Sandy Bridge EP)
Memory 32 GB DDR3-1600 RAM (8x4 GB, 4 channel on-chip)
Total Number of Cores 16
Clock Speed 2.7 GHz
Turbo Speed 3.5 GHz
L3 Cache Shared, 20 MB
L2 Cache Unified 256 KB
L1 Cache Private, 32 KB (per core)
Memory Type DDR3
Memory Channels 4
PCI Express Gen 3, x40 lanes
Number of QPI Link 2
QPI Link Speed 8 GT/s
Lithography 32 nm
TDP (socket) 130 W
Instruction Set Extensions SSE4.2, AVX
Component Value
CPU Sockets 2×Intel Xeon E5-2690 v3 (Haswell EP)
Memory 64 GB DDR4-2133 RAM (8 x 8GB dual rank x8 DIMMS)
Total Number of Cores 24
Clock Speed 2.6 GHz
Turbo Speed 3.5 GHz
L3 Cache Shared, 30 MB
L2 Cache Unified 256 KB
L1 Cache Private, 32 KB (per core)
Memory Type DDR4
Memory Channels 4
PCI Express Gen 3, x40 lanes
Number of QPI Link 2
UPI Link Speed 9.6 GT/s
Lithography 22 nm
TDP (socket) 135 W
Instruction Set Extensions SSE4.2, AVX, AVX2
Table 5:Intel Xeon Haswell Node Characteristics
Component Value
CPU Sockets 1
Memory 16 GB MCDRAM, 92 GB DDR4-2400
Total Number of Cores 68
Clock Speed 1.4 GHz
Turbo Speed 1.6 GHz
L2 Cache Unified 1 MB
L1 Cache Private, 32 KB (per core) Data and Instruction caches
Memory Channels 6
PCI Express Gen 3, x36 lanes
Lithography 14 nm
TDP 215 W
Instruction Set Extensions SSE4.2, AVX, AVX2, AVX-512
Table 6:Intel Knights Landing 7250 Node Characteristics
6.1 WRF
TheWeather Research and Forecasting(WRF) Model [6] is a widely used numerical weather prediction system used for both research and operational forecasts. WRF is primarily a Fortran code implemented using MPI and OpenMP for distributed computing. The problem space on each process is divided into tiles that are processed by OpenMP threads. Ideally, the best performance is achieved when the size of the tile fits into the smallest cache. Having multiple application tiles allows WRF to obtain high levels of memory bandwidth utilization. For this investigation we use the Continental US (CONUS) 12km input benchmark.
Fig.15shows the performance relative to Sandy Bridge for all the chips previously introduced. The results used for this figure are achieved by the best configuration for each chip in terms of processes and threads.
0 0.5 1 1.5 2 2.5 3 SNB HSW KNL SKX Processor R elativ e S peedu p WRF (MPI)
Figure 15:WRF: Speedup Relative to SNB
We also studied the impact of the different ISA (Instruction Set Architecture) in the performance of the code. The results can be seen in Fig.16. In the figure, higher is better. It can be seen how the
best performance is achieved by using the-no-vec -xCORE-AVX512compilation flags, with the
0 10 20 30 40 50 60 CORE-AVX5 12 CORE-A VX5 12no vec AVX2 AVX2 novec SS E4 SSE4 novec st eps/sec o n d WRF
Figure 16:WRF: ISA impact
6.2 FLASH
FLASH[11] is a multi-physics framework often used for the simulation of turbulent fluid flow and transport in plasmas, including exploding stars, laser energy deposition, and nuclear burning. The
benchmark case computes a driven turbulence simulation on a fixed, 643-point mesh per node.
Version 4.2.2 of the code was used in the tests with minor modifications to improve threading and vectorization added to a single file in theStirsubdirectory.
As for the WRF case, we compared the performance of the different chips. The results are depicted in Fig.17. The difference in performance is not as large as in the WRF case, even though SKX offers a much better performance than all the other chips.
0 0.5 1 1.5 2 2.5 SNB HSW KNL SKX Processor R elativ e S peedu p
FLASH 4.2.2 StirTurb 643, no-IO, hybrid, 28 steps
Figure 17:FLASH: Speedup Relative to SNB
Fig.18shows the different compilation flags used and how they affect the performance of the code.
The best result was achieved when using-O3 -no-vec -xCORE-AVX512. It is worth noticing the
difference between using or not using-no-vecin this case and, also, how when not-no-vecis
0 2 4 6 8 -O3 -no-v ec -O3 -xC ORE-AVX5 12 -O3 -xC ORE-AVX2 -O3 -no-v ec-xC ORE-AVX2 -O3 -no-v ec-xC ORE-AVX5 12 st e p s/sec o n d
FLASH 4.2.2 StirTurb 643, no-IO, hybrid, 28 steps
Figure 18:FLASH: ISA impact
6.3 NAMD
NAMD[10] is a parallel molecular dynamics code for high-performance simulation of large molec-ular systems used by many research teams around the world and the 2002 Gordon Bell Prize winner. NAMD is also the most used application on Stampede. This study uses the APOA1 and STMV20 NAMD benchmarks with modified input for the single and multi node studies respectively. The APOA1 benchmark is a 92-thousand atom molecular dynamics simulation of Apolipoprotein A-1 which is the primary component of the high-density lipoprotein cholesterol molecule. The STMV20 benchmarks is a 20 million atom simulation of the satellite tobacco mosaic virus, which is a small icosahedral plant virus which worsens the symptoms of infection by tobacco mosaic virus (TMV). A multicore version of NAMD CVS 2016-11-01 was built for the single node test, and a hybrid memory-optimized version was built for the large STMV20 case.
Fig.19shows the speedup relative to Sandy Bridge. For Sandy Bridge, 16 MPI tasks were used on a single node. In the case of KNL, we used 4 MPI tasks and 32 threads per MPI task (options+ppn 32 +pemap 0-63+68 +commap 64-67). For Skylake, we used 2 MPI tasks per node (options+ppn 23 +pemap 0-45+48 +commap 46-47). Overall, Skylake is 3.25 times faster than Sandy Bridge for
this case. 0 1 2 3 4 5 SNB KNL SKX Processor R elativ e S peedu p NAMD
Figure 19:NAMD: Speedup Relative to SNB
Fig.20shows the impact of the different compilation flags in the performance. In this case, the
0 2 4 6 8 10 12 14 16 18 -O3 -no-v ec -O3 -xC ORE-AVX5 12 -O3 -xC ORE-AVX5 12-n o-v ec -O3 -xC ORE-AVX2 -O3 -xC ORE-AVX2 -no-v ec n s/day
NAMD ISA Sensitivity
Figure 20:NAMD: ISA impact
6.4 GROMACS
GROMACSis a versatile package to perform molecular dynamics, i.e. simulate the Newtonian equations of motion for systems with hundreds to millions of particles [3]. It is primarily designed for biochemical molecules like proteins, lipids and nucleic acids that have a lot of complicated bonded interactions. In this study, Hen egg white lysozyme (PDB code 1AKI) and water (SPC model) solutions were simulated using version 2016.3. The simulated systems consist a total of 140124 atoms for the single node test, and 1.8 million atoms for the scalability tests. All simulations were performed in the isothermal isobaric (NpT) ensemble at 300 K and 1 atm.
Fig.21shows the relative performance of GROMACS on a dual socket SKX node, a dual socket
Sandy Bridge node, and a KNL. Overall, Skylake is 2.68 times faster than Sandy Bridge.
0 0.5 1 1.5 2 2.5 3 SNB KNL SKX Processor R elativ e S peedu p GROMACS
Figure 21:GROMACS: Speedup Relative to SNB
Fig.22depicts the performance of GROMACS for different compilation flags and ISA. It is worth noticing that GROMACS uses intrinsics for vectorization and that, at the time of running these tests, there was not an SKX optimized version of the code.
0 5 10 15 20 25 30
-O3 -xCORE-AVX512 -O3 -xAVX2 -O3 -no-vec
T
ime
(s)
GROMACS ISA Sensitivity
Figure 22:GROMACS: ISA impact
6.5 Python
We evaluated the performance of Python following the existing benchmarks at TACC [7] that can be found at [8]. These tests are sequential codes representative of the type of applications that many users of HPC systems run. Fig.23and24show the results of the Julia and Pairwise benchmarks with their different implementations in the Sandy Bridge, KNL and Skylake nodes. Since these are sequential codes, KNL provides the worst results. And even though the CPU frequency of a SKX core is lower than Sandy Bridge, the optimizations introduced in the hardware by Intel allow the codes to run faster than on SNB.
0 1 2 SNB KNL SKX Processor R elativ e S peedu p Python NumPy Julia
Figure 23:Julia: Speedup Relative to SNB
0 1 2 SNB KNL SKX Processor R elativ e S peedu p Python NumPy bcast dot Pairwise
6.6 tblastx
One of the most popular tools for sequence similarity searches is the Basic Local Alignment Search Tool (BLAST) by NCBI [2]. We consider a threaded implementation of NCBI BLAST since the MPI version has not been actively maintained in several years. The results reported only consider the
tblastxtool. Fig. 25shows the relative performance to Sandy Bridge on the chips of interest. Because of the characteristics of the code, KNL performs poorly. And, at the same time, SKX runs 2.8 times faster than SNB.
0 0.5 1 1.5 2 2.5 3 SNB HSW KNL SKX Processor R elativ e S peedu p tblastx
Figure 25:tblastx: Speedup Relative to SNB
R
EFERENCES
[1] TOP500 list.www.top500.org, 2017.
[2] Stephen F. Altschul, Warren Gish, Webb Miller, Eugene W. Myers, and David J. Lipman. Basic local alignment search tool.Journal of Molecular Biology, 215(3):403 – 410, 1990.
[3] H.J.C. Berendsen, D. van der Spoel, and R. van Drunen. GROMACS: A message-passing
parallel molecular dynamics implementation.Computer Physics Communications, 91(1):43 –
56, 1995.
[4] J. Mark Bull and Darragh O’Neill. A microbenchmark suite for openmp 2.0.SIGARCH Comput.
Archit. News, 29(5):41–48, December 2001.
[5] J. J. Dongarra. The linpack benchmark: An explanation. InProceedings of the 1st International
Conference on Supercomputing, pages 456–474, New York, NY, USA, 1988. Springer-Verlag
New York, Inc.
[6] W. C. Skamarock et al. A description of the advanced research WRF version 3. Technical report, National Center for Atmospheric Research, 2008.
[7] Todd Evans, Antonio Gómez-Iglesias, and Cyrus Proctor. PyTACC: HPC Python at the Texas
Advanced Computing Center. InProceedings of the 5th Workshop on Python for
High-Performance and Scientific Computing, PyHPC 2015, Austin, Texas, USA, November 15, 2015,
pages 4:1–4:7. ACM, 2015.
[8] Antonio Gómez-Iglesias. Python benchmarks. https://bitbucket.org/agomezig/
python-benchmarks, June 2015.
[9] John D. McCalpin. STREAM: Sustainable memory bandwidth in high performance computers. Technical report, University of Virginia, 1991-2017. A continually updated technical report http://www.cs.virginia.edu/stream/.
[10] James C. Phillips, Rosemary Braun, Wei Wang, James Gumbart, Emad Tajkhorshid, Elizabeth Villa, Christophe Chipot, Robert D. Skeel, Laxmikant Kalé, and Klaus Schulten. Scalable
molecular dynamics with NAMD.Journal of Computational Chemistry, 26(16):1781–1802,
2005.
[11] David Radice, Sean M. Couch, and Christian D. Ott. Implicit large eddy simulations of anisotropic weakly compressible turbulence with application to core-collapse supernovae.