ScienceDirect
Rice Science, 2015, 22(3): 108í115
Quantitative Trait Locus Analysis for Rice Yield Traits under
Two Nitrogen Levels
F
ENGYue
1, Z
HAIRong-rong
2, L
INZe-chuan
1, C
AOLi-yong
1, W
EIXing-hua
1, C
HENGShi-hua
1(1Chinese National Center for Rice Improvement / State Key Laboratory of Rice Biology, China National Rice Research Institute, Hangzhou
310006, China; 2Institute of Crop and Nuclear Technology Utilization, Zhejiang Academy of Agricultural Sciences, Hangzhou 310021, China)
Abstract: A recombinant inbred line population derived from a super hybrid rice Xieyou 9308 (Xieqingzao B/Zhonghui 9308) and its genetic linkage map were used to detect quantitative trait loci (QTLs) for rice yield traits under the low and normal nitrogen (N) levels. A total of 52 QTLs for yield traits distributed in 27 regions on 9 chromosomes were detected, with each QTL explaining 4.93%–26.73% of the phenotypic variation. Eleven QTLs were simultaneously detected under the two levels, and 30 different QTLs were detected under the two N levels, thereby suggesting that the genetic bases controlling rice growth under the low and normal N levels were different. QTLs for number of panicles per plant, number of spikelets per panicle, number of filled grains per panicle, and grain density per panicle under the two N levels were detected in the RM135–RM168 interval on chromosome 3. QTLs for number of spikelets per panicle and number of filled grains per panicle under the two N levels, as well as number of panicles per plant and grain density per panicle, under the low N level, were detected in the RM5556–RM310 interval on chromosome 8. The above described QTLs shared similar regions with previously reported QTLs for rice N recycling. Key words: nitrogen; quantitative trait locus; rice; yield trait
Rice (Oryza sativa L.) is the major food and heat source for more than half of the world’s population. Fertilizer, especially nitrogen (N), plays a crucial role in rice production. However, nitrogen use efficiency (NUE) evidently declines with increasing application of N fertilizer. At present, NUE for rice is only about 30% in China (Peng et al, 2002). With improper use of N fertilizer and low NUE, most of the N is lost through volatilization and run-off, thereby causing serious environmental pollution that indirectly affects human health (Senaratne and Ratnasinghe, 1995; Xing and Zhu, 2000; Peng et al, 2006). Genetic improvement of rice for NUE would reduce N inputs and maintain high yield, which would be an effective way to reduce the environmental pollution and the cost of rice production (Shan et al, 2005; Cho et al, 2007).
As increasing the yield per unit area remains the
key factor in increasing total rice production, numerous scholars have identified and cloned the functional genes associated with high yield, and combined molecular breeding technologies to cultivate high-yielding rice varieties (Cheng et al, 2004; Zhang, 2007). At present, 29 genes for rice yield and yield- related traits have been cloned by map-based cloning strategy (Jiang et al, 2012; Zhan et al, 2014). Wei et al (2012) used a set of recombinant inbred lines (RILs), derived from a cross of Zhenshan 97 and Minghui 63, to identify quantitative trait loci (QTLs) for rice NUE and N-deficiency tolerance traits. Cho et al (2007) reported QTLs associated with physiological NUE in rice. Feng et al (2011) identified QTLs for plant height and heading date in rice under the low N and normal N levels. Wei et al (2011b) also detected QTLs for rice NUE and grain yield traits, and studied the genetic
Received: 27 October 2014; Accepted: 13 January 2015 Corresponding author: CHENG Shi-hua ([email protected])
Copyright © 2015, China National Rice Research Institute. Hosting by Elsevier B.V. All rights reserved. Peer review under responsibility of China National Rice Research Institute.
http://dx.doi.org/10.1016/S1672-6308(14)60288-2 http://dx.doi.org/10.1016/j.rsci.2015.05.014
http://dx.doi.org/10.1016/j.rsci.2015.05.014
Copyright © 2015, China National Rice Research Institute. Hosting by Elsevier B.V. This is an open access article under the CC BY-NC-ND license (http://creativecommons.org/licenses/by-nc-nd/4.0/).
relationship between the two traits. Tong et al (2011) identified 57 main-effect QTLs, and 33 digenic interactions for grain yield and its components under three N levels. Wei et al (2011a) also detected 68 QTLs for grain yield and its components under the low and normal N applications. Given that rice yield traits showed significant genetic variability under different N levels, studying the genetic characteristics of rice yield traits under different N levels is important in breeding N-efficient rice varieties. In this study, we used a RIL population, derived from a super hybrid rice Xieyou 9308, a cross of Xieqingzao B and Zhonghui 9308, to detect QTLs for number of panicles per plant, panicle length, number of spikelets per panicle, number of filled grains per panicle, seed-setting rate, grain density per panicle, 1000-grain weight, and grain yield per plant under two different N levels, and analyzed the inherited characteristics of these traits. This study aimed to provide reference for molecular-assisted selection of N-efficient rice varieties.
MATERIALS AND METHODS
Rice materials
The population used in this study was consisted of 138 F14 RILs, which were screened by N-deficiency tolerance
test from 238 lines (Feng et al, 2010b), derived by the single-seed descent from a cross of a restorer line Zhonghui 9308 and a maintainer line Xieqingzao B, which were the parents of Xieyou 9308, a super hybrid rice in China.
Field experiment design
The experiment was carried out in 2009 at China National Rice Research Institute, Hangzhou, Zhejiang Province, China. Basic nutrition in the soil (0–20 cm depth) was as follows: 51.9 g/kg organic matter, 3.16 g/kg total N, 331.9 mg/kg alkali-hydrolyzable N, 1.13 g/kg total phosphorus (P), 17.5 mg/kg Olsen-P, 24.20 g/kg total potassium (K), and 69.0 mg/kg available K. Field planting followed a randomized complete block design under two fertilization levels (N+, normal N; N-, low N) with two replications. Under the N+ level, N (in the form of urea), P (CaH2PO4) and K (KCl)
fertilizers were applied at 150, 375 and 225 kg/hm2, respectively. Total P, 60% N and 50% K were applied at 1 d before transplanting, whereas 40% N and 50% K were topdressed at the tillering stage. Under the N- level, all fertilizers except N were applied as under the N+ level. All rice materials were sown on 14 May, and
transplanted on 10 June. Each line was transplanted in five rows with nine hills per row, single plant per hill with a planting space of 20 cm × 20 cm. Field management was implemented in accordance with conventional cultivation requirement. Number of panicles per plant, panicle length, number of spikelets per panicle, number of filled grains per panicle, seed-setting rate, grain density per panicle, 1000-grain weight, and grain yield per plant were measured from the third to the seventh plants (total five plants) of the middle three lines in each plot. The average of two replications values was used as the trait for QTL analysis.
Molecular linkage construction and QTL mapping
Based on the molecular genetic map constructed previously (Shen et al, 2008), molecular markers were further complemented. The genetic map used for QTL analysis was consisted of 198 simple sequence repeat markers, and spanned a total of 1 814.5 cM in length, with an average spacing of 9.2 cM between adjacent marker. The partial separation and genome coverage of the map were similar to those of other international rice mapping populations, and were suitable for QTL mapping. The linkage map was constructed by MapMaker/EXP 3.0 software.
To identify QTLs for eight yield traits, composite interval mapping was used by WinQTLCart 2.5 (http://statgen.ncsu.edu/qrtcart/WQTLCart.htm). The LOD value of 2.5 was selected as the minimum to declare the presence of a QTL in a given genomic region, and the percentage of variance explained by individual QTL and allelic effects were estimated at the maximum-likelihood QTL position. QTL nomenclature was followed by McCouch et al (2008).
RESULTS
Phenotypic analysis for yield traits
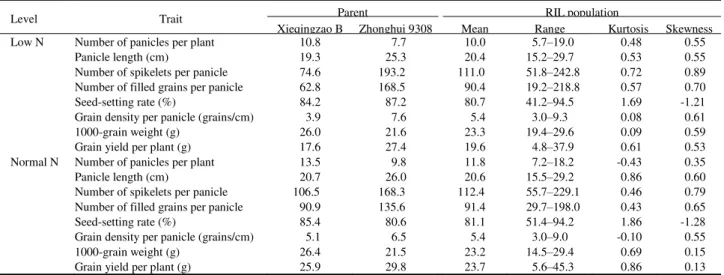
The phenotypic distributions of yield traits of the two parents and the RIL population are shown in Table 1. Number of panicles per plant, panicle length, and grain yield per plant of the two parents under the N- level were smaller than those under the N+ level. However, trait differences in Zhonghui 9308 were less than those in Xieqingzao B under the two N levels. Compared with those under the N+ level, number of spikelets per panicle, number of filled grains per panicle, seed-setting rate, grain density per panicle, and 1000-grain weight of Xieqingzao B were decreased under the N- level. However, these five traits of
Zhonghui 9308 were higher under the N- level than those under the N+ level, thereby suggesting that Zhonghui 9308 showed a smaller response to N deficiency than Xieqingzao B. Table 1 shows that the kurtosis and skewness for all traits, except for seed-setting rate, were less than 1. Moreover, these traits showed genetic characteristics of quantitative traits, and presented significant transgressive segregation. The results fulfill the requirement of QTL mapping. The phenotypic values of seed-setting rate with non- normal distribution were converted to appropriate values, which were used for QTL mapping.
QTL analysis for yield traits under N- and N+ levels
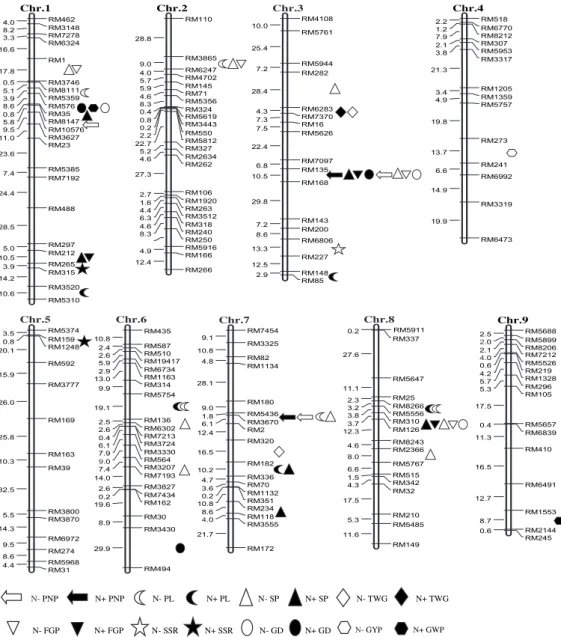
A total of 52 additive QTLs were detected for rice yield traits under the two N levels, and each QTL explained 4.93%–26.73% of the phenotypic variations. Among those, 28 QTLs distributed in 17 regions on 7 chromosomes were detected under the N- level (Table 2), whereas 24 QTLs also distributed in 17 regions on 7 chromosomes were detected under the N+ level (Table 3). Eleven consistent QTLs for yield traits were located in seven regions on chromosomes 1, 3, 6, 7 and 8 under the two N levels, and 30 differentially expressed QTLs for yield traits were located in 23 regions on 9 chromosomes under the two N levels (Fig. 1).
Number of panicles per plant
Six QTLs for number of panicles per plant were located on chromosomes 1, 3, 7 and 8 under the two N levels, including four and two QTLs under the N- and N+ levels, respectively (Tables 2 and 3). One major QTL was simultaneously located at the RM135–RM168 interval on chromosome 3 under the N- and N+ levels,
and explained 13.62% and 22.06% of the phenotypic variations, respectively. The positive allele was from Xieqingzao B.
Panicle length
Ten QTLs for panicle length were located on chromosomes 1, 2, 3, 6, 7 and 8 under the two N levels, including five QTLs under each level, respectively (Tables 2 and 3). Phenotypic variations explained by individual QTL ranged from 5.00% to 15.58%. The positive allele of QTL located on chromosome 2 was from Xieqingzao B, and the other nine QTLs were all from Zhonghui 9308.
Number of spikelets per panicle
Fourteen QTLs for number of spikelets per panicle were located on chromosomes 1, 2, 3, 6, 7 and 8 under the two N levels, including eight and six QTLs under the N- and N+ levels, respectively (Tables 2 and 3). One major QTL was found to be simultaneously located at the RM135–RM168 interval on chromosome 3 under the N- and N+ levels, and each QTL explained 18.75% and 15.82% of the phenotypic variations, respectively. The positive allele of the QTL was from Zhonghui 9308.
Number of filled grains per panicle
Seven QTLs for number of filled grains per panicle were located on chromosomes 1, 2, 3 and 8 under the two N levels, including four and three QTLs under the N- and N+ levels, respectively (Tables 2 and 3). One major QTL was simultaneously detected in the RM135RM168 interval on chromosome 3 under the N- and N+ levels, and each QTL explained 14.43% and 17.73% of the phenotypic variations, respectively. The positive allele of the QTL was from Zhonghui 9308.
Table 1. Phenotypic analysis of recombinant inbred line (RIL) population and the parents under low N and normal N levels.
Level Trait Parent RIL population
Xieqingzao B Zhonghui 9308 Mean Range Kurtosis Skewness
Low N Number of panicles per plant 10.8 7.7 10.0 5.7–19.0 0.48 0.55
Panicle length (cm) 19.3 25.3 20.4 15.2–29.7 0.53 0.55
Number of spikelets per panicle 74.6 193.2 111.0 51.8–242.8 0.72 0.89
Number of filled grains per panicle 62.8 168.5 90.4 19.2–218.8 0.57 0.70
Seed-setting rate (%) 84.2 87.2 80.7 41.2–94.5 1.69 -1.21
Grain density per panicle (grains/cm) 3.9 7.6 5.4 3.0–9.3 0.08 0.61
1000-grain weight (g) 26.0 21.6 23.3 19.4–29.6 0.09 0.59
Grain yield per plant (g) 17.6 27.4 19.6 4.8–37.9 0.61 0.53
Normal N Number of panicles per plant 13.5 9.8 11.8 7.2–18.2 -0.43 0.35
Panicle length (cm) 20.7 26.0 20.6 15.5–29.2 0.86 0.60
Number of spikelets per panicle 106.5 168.3 112.4 55.7–229.1 0.46 0.79
Number of filled grains per panicle 90.9 135.6 91.4 29.7–198.0 0.43 0.65
Seed-setting rate (%) 85.4 80.6 81.1 51.4–94.2 1.86 -1.28
Grain density per panicle (grains/cm) 5.1 6.5 5.4 3.0–9.0 -0.10 0.55
1000-grain weight (g) 26.4 21.5 23.2 14.5–29.4 0.69 0.15
Table 2. QTL mapping of the traits of recombinant inbred line (RIL) population under low N level.
Trait QTL Chromosome Marker interval LOD value Additive effect a Variation (%)
PNP qPNP-1 1 RM8147–RM10576 2.56 -0.54 5.20 qPNP-3a 3 RM135–RM168 3.86 -0.88 13.62 qPNP-7a 7 RM5436–RM3670 2.50 -0.61 6.09 qPNP-8 8 RM5556–RM310 3.29 -0.68 8.11 PL (cm) qPL-1a 1 RM8111–RM5359 2.62 0.65 5.03 qPL-2 2 RM3865–RM6247 2.54 -0.64 5.00 qPL-6a 6 RM5754–RM136 5.40 1.11 15.58 qPL-7a 7 RM5436–RM3670 4.93 1.01 11.75 qPL-8a 8 RM8266–RM5556 3.38 0.76 7.06 SP qSP-1a 1 RM1–RM3746 4.82 13.70 12.78 qSP-2 2 RM3865–RM6247 3.26 -9.79 6.58 qSP-3a 3 RM282–RM6283 2.71 11.35 8.31 qSP-3b 3 RM135–RM168 7.62 17.07 18.75 qSP-6a 6 RM136–RM6302 3.55 10.45 6.40 qSP-6b 6 RM3207–RM7193 3.22 9.87 6.10 qSP-7a 7 RM5436–RM3670 2.99 8.99 5.42 qSP-8a 8 RM5556–RM310 4.70 12.83 11.60 FGP qFGP-1a 1 RM1–RM3746 3.47 12.20 11.21 qFGP-2 2 RM3865–RM6247 2.53 -8.72 5.74 qFGP-3a 3 RM135–RM168 4.98 14.23 14.43 qFGP-8a 8 RM5556–RM310 4.63 12.38 11.16 SSR (%) qSSR-3 3 RM6806–RM227 2.52 -2.96 8.81 GD (grains/cm) qGD-1a 1 RM576–RM35 3.26 0.37 7.19 qGD-3a 3 RM135–RM168 6.95 0.61 18.36 qGD-8 8 RM5556–RM310 3.98 0.41 8.93 TWG (g) qTWG-3a 3 RM6283–RM7370 10.97 -1.27 26.73 qTWG-7 7 RM320–RM182 2.51 0.49 4.93 GYP (g) qGYP-4 4 RM273–RM241 2.54 0.62 5.73
PNP, Number of panicles per plant; PL, Panicle length; SP, Number of spikelets per panicle; FGP, Number of filled grains per panicle; SSR, Seed-setting rate; GD, Grain density per panicle; TWG, 1000-grain weight; GYP, Grain yield per plant.
a
Negative values mean the allele from Xieqingzao B, while the positive values mean the allele from Zhonghui 9308.
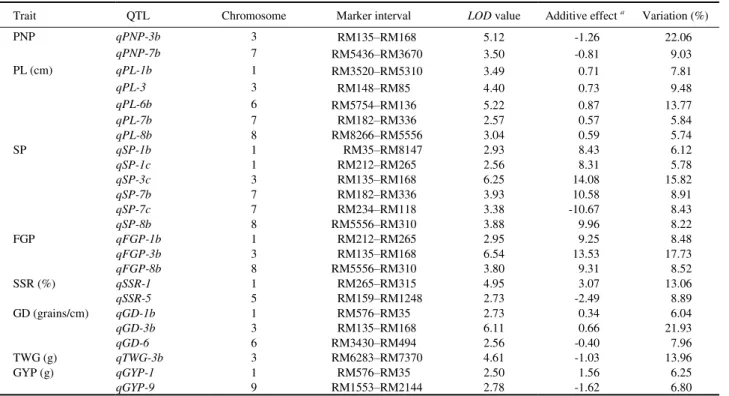
Table 3. QTL mapping of the traits for recombinant inbred line (RIL) population under normal N level.
Trait QTL Chromosome Marker interval LOD value Additive effect a Variation (%)
PNP qPNP-3b 3 RM135–RM168 5.12 -1.26 22.06 qPNP-7b 7 RM5436–RM3670 3.50 -0.81 9.03 PL (cm) qPL-1b 1 RM3520–RM5310 3.49 0.71 7.81 qPL-3 3 RM148–RM85 4.40 0.73 9.48 qPL-6b 6 RM5754–RM136 5.22 0.87 13.77 qPL-7b 7 RM182–RM336 2.57 0.57 5.84 qPL-8b 8 RM8266–RM5556 3.04 0.59 5.74 SP qSP-1b 1 RM35–RM8147 2.93 8.43 6.12 qSP-1c 1 RM212–RM265 2.56 8.31 5.78 qSP-3c 3 RM135–RM168 6.25 14.08 15.82 qSP-7b 7 RM182–RM336 3.93 10.58 8.91 qSP-7c 7 RM234–RM118 3.38 -10.67 8.43 qSP-8b 8 RM5556–RM310 3.88 9.96 8.22 FGP qFGP-1b 1 RM212–RM265 2.95 9.25 8.48 qFGP-3b 3 RM135–RM168 6.54 13.53 17.73 qFGP-8b 8 RM5556–RM310 3.80 9.31 8.52 SSR (%) qSSR-1 1 RM265–RM315 4.95 3.07 13.06 qSSR-5 5 RM159–RM1248 2.73 -2.49 8.89 GD (grains/cm) qGD-1b 1 RM576–RM35 2.73 0.34 6.04 qGD-3b 3 RM135–RM168 6.11 0.66 21.93 qGD-6 6 RM3430–RM494 2.56 -0.40 7.96 TWG (g) qTWG-3b 3 RM6283–RM7370 4.61 -1.03 13.96 GYP (g) qGYP-1 1 RM576–RM35 2.50 1.56 6.25 qGYP-9 9 RM1553–RM2144 2.78 -1.62 6.80
PNP, Number of panicles per plant; PL, Panicle length; SP, Number of spikelets per panicle; FGP, Number of filled grains per panicle; SSR, Seed-setting rate; GD, Grain density per panicle; TWG, 1000-grain weight; GYP, Grain yield per plant.
Seed-setting rate
Three QTLs for seed-setting rate were detected under the two N levels, including one and two QTLs under the N- and N+ level, respectively (Tables 2 and 3). These three QTLs were located on chromosomes 1, 3 and 5, and phenotypic variations explained by each QTL ranged from 8.81% to 13.06%. The positive allele of the QTL located on chromosome 1 under the N+ level was from Zhonghui 9308, and Xieqingzao B carried alleles of the other two QTLs.
Grain density per panicle
Six QTLs for grain density per panicle were detected
under the two N levels, including three QTLs under the N- and N+ levels, respectively (Tables 2 and 3). These six QTLs were located on chromosomes 1, 3, 6 and 8, and each explained 6.04%–21.93% of the phenotypic variations. One major QTL was simultaneously located in the RM135–RM168 interval on chromosome 3 under the N- and N+ levels, and each QTL explained 18.36% and 21.93% of the phenotypic variations, respectively. The positive allele of the QTL was from Zhonghui 9308.
1000-grain weight
Three QTLs for 1000-grain weight were detected under the two N levels, including two and one QTLs
Fig. 1. Location of QTLs for rice yield component traits under low (N-) and normal (N+) N levels.
PNP, Number of panicles per plant; PL, Panicle length; SP, Number of spikelets per panicle; FGP, Number of filled grains per panicle; SSR, Seed-setting rate; GD, Grain density per panicle; TWG, 1000-grain weight; GYP, Grain yield per plant.
Chr.1 RM462 RM3148 4.0 RM7278 8.2 RM6324 3.3 RM1 16.6 RM3746 17.8 RM8111 0.5 RM5359 5.1 RM576 3.9 RM35 8.6 RM8147 0.8 RM10576 5.8 RM3627 9.5 RM23 11.0 RM5385 23.6 RM7192 7.4 RM488 24.4 RM297 28.5 RM212 5.0 RM265 10.5 RM315 3.9 RM3520 14.2 RM5310 10.6 RM110 RM3865 28.8 RM6247 9.0 RM4702 4.0 RM145 5.7 RM71 5.9 RM5356 4.6 RM324 8.3 RM5619 0.4 RM3443 0.8 RM550 0.2 RM5812 2.2 RM327 22.7 RM2634 5.2 RM262 4.6 RM106 27.3 RM1920 2.7 RM263 1.6 RM3512 4.4 RM318 6.3 RM240 4.6 RM250 8.3 RM5916 RM166 4.9 RM266 12.4 Chr.2 RM4108 RM5761 10.0 RM5944 25.4 RM282 7.2 RM6283 28.4 RM7370 4.3 RM16 7.3 RM5626 7.5 RM7097 22.4 RM135 6.8 RM168 10.5 RM143 29.8 RM200 7.2 RM6806 8.6 RM227 13.3 RM148 12.5 RM85 2.9 Chr.3 RM518 RM6770 2.2 RM8212 1.2 RM307 7.9 RM5953 2.1 RM3317 3.8 RM1205 21.3 RM1359 3.4 RM5757 4.9 RM273 19.8 RM241 13.7 RM6992 6.6 RM3319 14.9 RM6473 19.9 Chr.4 RM5374 RM159 3.5 RM1248 0.8 RM592 20.1 RM3777 15.9 RM169 26.0 RM163 25.8 RM39 10.3 RM3800 32.5 RM3870 5.5 RM6972 14.3 RM274 9.5 RM5968 8.6 RM31 4.4 Chr.5 RM435 RM587 10.8 RM510 2.4 RM19417 2.6 RM6734 5.9 RM1163 2.9 RM314 13.0 RM5754 9.9 RM136 19.1 RM6302 2.5 RM7213 2.6 RM3724 0.4 RM3330 6.1 RM564 7.9 RM3207 9.0 RM7193 7.4 RM3827 14.0 RM7434 2.6 RM162 0.2 RM30 19.6 RM3430 8.9 RM494 29.9 Chr.6 RM7454 RM3325 9.1 RM82 10.8 RM1134 4.8 RM180 28.1 RM5436 9.0 RM3670 1.8 RM2 6.1 RM320 12.4 RM182 16.5 RM336 10.2 RM70 4.7 RM1132 3.6 RM351 0.2 RM234 10.8 RM118 8.6 RM3555 4.0 RM172 21.7 Chr.7 RM5911 RM337 0.2 RM5647 27.6 RM25 11.1 RM8266 2.3 RM5556 3.2 RM310 3.8 RM126 3.7 RM8243 12.3 RM2366 4.6 RM5767 8.0 RM515 6.6 RM342 1.5 RM32 4.3 RM210 17.5 RM5485 5.3 RM149 11.6 Chr.8 RM5688 RM5899 2.5 RM8206 2.0 RM7212 2.1 RM5526 4.0 RM219 0.6 RM1328 4.2 RM296 5.7 RM105 5.3 RM5657 17.5 RM6839 0.4 RM410 11.3 RM6491 16.5 RM1553 12.7 RM2144 8.7 RM245 0.6 Chr.9 N-PNP N+ PNP N- PL N+ PL N- SP N+ SP N- TWG N+ TWG N- FGP N+ FGP N- SSR N+ SSR N- GD N+ GD N- GWP N+ GWPN- GYP N+ GWP
under the N- and N+ levels, respectively (Tables 2 and 3). These three QTLs were located on chromosomes 3 and 7, and phenotypic variations explained by each QTL ranged from 4.93% to 26.73%. One major QTL was simultaneously located at the RM6283–RM7370 interval on chromosome 3 under the N- and N+ levels, and a single QTL explained 26.73% and 13.96% of the phenotypic variation, respectively. The positive allele of the QTL was from Xieqingzao B.
Grain yield per plant
Three QTLs for grain yield per plant were detected under the two N levels, including one and two QTLs under the N- and N+ levels, respectively (Tables 2 and 3). These three QTLs were located on chromosomes 1, 4 and 9, and phenotypic variations explained by each QTL ranged from 5.73% to 6.80%. The positive allele of the QTL located on chromosome 9 under the N+ level was from Xieqingzao B, and Zhonghui 9308 carried alleles of the other two QTLs.
DISCUSSION
Nitrogen is one of the necessary elements for crop growth, and it plays a very important role in regulating crop yield. However, the heavy use of N fertilizer may cause decline in rice quality and NUE, environmental pollution, and other problems. Therefore, methods of improving rice NUE have become research foci. Several previous studies showed significant genotypic differences in NUE and N deficiency tolerance in rice (Jiang et al, 2003; Piao et al, 2003; Cao et al, 2006; Cheng et al, 2012; Yin et al, 2013). In this study, seven yield traits under the N- level decreased in smaller degrees in Zhonghui 9308 than in Xieqingzao B, thereby indicating that Zhonghui 9308 presents possess stronger N deficiency tolerance than Xieqingzao B. The results were consistent with previous studies (Feng et al, 2010a).
Genotype × environment interaction is one of the important factors affecting the expression of quantitative traits (Zhuang et al, 1997). Yield traits are quantitative traits controlled by multiple genes and are highly influenced by environmental levels (Cho et al, 2007). Cho et al (2007) found that QTLs detected under the high and low N levels are widely different. However, the study of Tong et al (2006) showed the presences of the same and specially expressed QTLs under the low and high N levels. Tong et al (2011) analyzed the QTLs for rice yield and its components under the high, middle and low N levels, and detected
15, 23 and 19 QTLs at three N levels, respectively, thereby indicating the occurrence of obvious interactions between QTLs for yield traits and N levels. In this study, we detected 11 consistent and 30 differentially expressed QTLs for yield traits under the two N levels. The results were consistent with previous studies, thereby indicating that interactions between QTLs for rice yield traits and N levels existed. Such interactions are reflected on the differential expression of genes at different N environments.
NUE in plants is a complex quantitative trait. At present, a number of QTLs associated with NUE have been identified in plants, and the way by which QTLs can be used for genetic improvement of crop NUE has become a research focus. By integrating the QTLs for NUE in previous studies and excavating QTLs detected in different populations through comparative analysis, the accuracy and reliability of QTL mapping can be improved. In the present study, QTLs for number of panicles per plant, number of spikelets per panicle, number of filled grains per panicle, and grain density per panicle were simultaneously located in the RM135–RM168 interval on chromosome 3 under the two N levels. Senthivel et al (2008) detected several QTLs for yield traits and NUE in the nearby regions, and QTLs for soluble protein content related to rice N recycling were also detected in the similar regions in rice (Ishimaru et al, 2001). In this study, QTLs for number of spikelets per panicle and number of filled grains per panicle under the two N levels and number of panicles per plant, and grain density per panicle under the N- level were detected in the RM5556– RM310 interval on chromosome 8. Cho et al (2007) and Hu et al (2012) detected QTLs for N content and NUE in adjacent regions, respectively. Obara et al (2001) and Yamaya et al (2002) detected genes associated with glutamate synthase content, which is related to N recycling, in the similar regions on chromosome 8. These two chromosome regions may be enriched with the key N metabolism genes. Constructing a secondary mapping population (e.g., chromosome segment substitution lines) for these stable and reliable QTLs is expected to achieve a breakthrough in molecular genetic improvement and map-based cloning of QTLs for NUE in rice.
ACKNOWLEDGEMENTS
This work was supported by the National Natural Science Foundation of China (Grant No. 31200916),
the Zhejiang Provincial Project for Rice Seed Industry of Scientific and Technological Innovation Team (Grant No. 2010R50024-16), and the Academy of Institute Foundation for Basic Scientific Research of China (Grant No. 2012RG002-7).
REFERENCES
Cao G L, Zhang Y Y, Piao Z Z, Han L Z. 2006. Evaluation of tolerance to low N-fertilized level for rice type. J Plant Genet Res, 7(3): 316–320. (in Chinese with English abstract)
Cheng J F, Dai T B, Jiang H Y, Pan X Y, Cao W X. 2012. Characterization of leaf carbon and nitrogen assimilation in different rice genotypes at jointing stage and their relationships with nitrogen utilization efficiency. Chin J Rice Sci, 26(1): 101–108. (in Chinese with English abstract)
Cheng S H, Zhuang J Y, Cao L Y, Chen S G, Peng Y C, Fan Y Y, Zhan X D, Zheng K L. 2004. Molecular breeding for super rice hybrids. Chin J Rice Sci, 18(5): 377–383. (in Chinese with English abstract)
Cho Y G, Kang H J, Lee J S, Lee Y T, Lim S J, Gauch H, Eun M Y, McCouch S R. 2007. Identification of quantitative trait loci in rice for yield, yield components, and agronomic traits across years and locations. Crop Sci, 47: 2403–2417.
Cho Y, Jiang W Z, Chin J H, Piao Z Z, Cho Y G, McCouch S R, Koh H J. 2007. Identification of QTLs associated with physiological nitrogen use efficiency in rice. Mol Cells, 23(1): 72–79.
Feng Y, Cao L Y, Wu W M, Shen X H, Zhan X D, Zhai R R, Chen D B, Cheng S H. 2010a. Comparative analyses of QTLs for N-deficiency tolerance at different seedling stages in rice (Oryza sativa L.). Plant Nutr Fert Sci, 16(4): 880–886. (in Chinese with English abstract)
Feng Y, Cao L Y, Wu W M, Shen X H, Zhan X D, Zhai R R, Wang R C, Chen D B, Cheng S H. 2010b. Mapping QTLs for nitrogen-deficiency tolerance at seedling stage in rice (Oryza sativa L.). Plant Breeding, 129: 652–656.
Feng Y, Zhai R R, Cao L Y, Lin Z C, Wei X H, Cheng S H. 2011. QTLs for plant height and heading date in rice under two nitrogen levels. Acta Agron Sin, 37(9): 1525–1532. (in Chinese with English abstract)
Hu S K, Zeng D L, Su Y, Shi Z Y, Ye W J, Dong G J, Zhu L, Hu J, Qian Q, Guo L B. 2012. QTL analysis of nitrogen content of plant shoot under two nitrogen conditions in rice (Oryza sativa
L.). Aust J Crop Sci, 6(12): 1737–1744.
Ishimaru K, Kobayashi N, Ono K, Yano M, Ohsugi R. 2001. Are contents of rubisco, soluble protein and nitrogen in flag leaves of rice controlled by the same genetics? J Exp Bot, 52(362): 1827–1833.
Jiang L G, Dai T B, Wei S Q, Gan X Q, Xu J Y, Cao W X. 2003. Genotypic differences and valuation in nitrogen uptake and utilization efficiency in rice. Acta Phytoecol Sin, 27(4): 466–471. (in Chinese with English abstract)
Jiang Y H, Cai Z X, Xie W B, Long T, Yu H H, Zhang Q F. 2012. Rice functional genomics research: Progress and implications for crop genetic improvement. Biotechnol Adv, 30: 1059–1070. McCouch S R. 2008. Gene nomenclature system for rice. Rice,
1(1): 72–84.
Obara M, Kajiura M, Fukuta Y, Yano M, Hayashi M, Yamaya T, Sato T. 2001. Mapping of QTLs associated with cytosolic glutamine synthetase and NADH-glutamate synthase in rice (Oryza sativa L.). J Exp Bot, 52(359): 1209–1217.
Peng S B, Huang J L, Zhong X H, Yang J C, Wang G H, Zou Y B, Zhang F S, Zhu Q S, Roland B, Christian W. 2002. Challenge and opportunity in improving fertilizer-nitrogen use efficiency of irrigated rice in China. Sci Agric Sin, 1(7): 776–785.
Peng S B, Buresh R J, Huang J L, Yang J C, Zou Y B, Zhong X H, Wang G H, Zhang F S. 2006. Strategies for overcoming low agronomic nitrogen use efficiency in irrigated rice system in China. Field Crops Res, 96(1): 37–47.
Piao Z Z, Han L Z, Koh H J. 2003. Variations of nitrogen use efficiency by rice genotype. Chin J Rice Sci, 17(3): 233–238. (in Chinese with English abstract)
Senaratne R, Ratnasinghe D S. 1995. Nitrogen fixation and beneficial effects of some grain legumes and green-manure crops on rice. Boil Fert Soils, 19(1): 49–54.
Senthilvel S, Vinod K K, Malarvizhi P, Maheswaran M. 2008. QTL and QTL × environment effects on agronomic and nitrogen acquisition traits in rice. J Inter Plant Biol, 50(9): 1108–1117. Shan Y H, Wang Y L, Pan X B. 2005. Mapping of QTLs for
nitrogen use efficiency and related traits in rice (Oryza sativa L.).
Sci Agric Sin, 4(10): 721–727.
Shen X H, Chen S G, Cao L Y, Zhan X D, Chen D B, Wu W M, Cheng S H. 2008. Construction of genetic linkage map based on a RIL population derived from super hybrid rice, XY9308. Mol Plant Breeding, 6(5): 861–866. (in Chinese with English abstract)
Tong H H, Mei H W, Yu X Q, Xu X Y, Li M S, Zhang S Q, Luo L J. 2006. Identification of related QTLs at late developmental stage in rice (Oryza sativa L.) under two nitrogen levels. Acta Genet Sin, 33(5): 458–467.
Tong H H, Chen L, Li W P, Mei H W, Xiong Y Z, Yu X Q, Xu X Y, Zhang S Q, Luo L J. 2011. Identification and characterization of quantitative trait loci for grain yield and its components under different nitrogen fertilization levels in rice (Oryza sativa L.).
Mol Breeding, 28: 495–509.
Wei D, Cui K H, Pan J F, Wang Q, Wang K, Zhang X M, Xiang J, Nie L X, Huang J L. 2011a. Identification of quantitative trait loci for grain yield and its components in response to low nitrogen application in rice. Aust J Crop Sci, 6(6): 986–994. Wei D, Cui K H, Pan J F, Ye G Y, Xiang J, Nie L X, Huang J L.
2011b. Genetic dissection of grain nitrogen use efficiency and grain yield and their relationship in rice. Field Crops Res, 124: 340–346.
Wei D, Cui K H, Yu G Y, Pan J F, Xiang J, Huang J L, Nie L X. 2012. QTL mapping for nitrogen-use efficiency and nitrogen-deficiency tolerance traits in rice. Plant Soil, 359:
281–295.
Xing G X, Zhu Z L. 2000. An assessment of N loss from agricultural fields to the environment in China. Nutr Cycl Agroecosys, 57(1): 67–73.
Yamaya T, Obara M, Nakajima H, Sasaki S, Hayakawa T, Sato T. 2002. Genetic manipulation and quantitative-trait loci mapping for nitrogen recycling in rice. J Exp Bot, 53(370): 917–925. Yin C Y, Wang S Y, Liu H M, Xue Y Z, Zhang X, Wang H L, Sun J
Q, Hu X M, Li X J. 2013. Effects of nitrogen fertilizer application on grain filling characteristics and rice quality of superior and inferior grains in super japonica rice Xindao 18.
Chin J Rice Sci, 27(5): 503–510. (in Chinese with English
abstract)
Zhan X D, Yu P, Lin Z C, Chen D B, Shen X H, Zhang Y X, Fu J L, Cheng S H, Cao L Y. 2014. QTL mapping of heading date and yield-related traits in rice using a recombination inbred lines (RILs) population derived from BG1/XLJ. Chin J Rice Sci, 28(6): 570–580. (in Chinese with English abstract)
Zhang Q F. 2007. Strategies for developing green super rice. Proc Natl Acad Sci USA, 104(42): 16402–16409.
Zhuang J Y, Lin H X, Lu J, Qian H R, Hittalmani S, Huang N, Zheng K L. 1997. Analysis of QTL × environment interaction for yield components and plant height in rice. Theor Appl Genet, 95: 799–808.