Performance and Cost-effectiveness
Analyses for Cloud Services Based on
Rejected and Impatient Users
Yi-Ju Chiang
1, Student Member, IEEE, Yen-Chieh Ouyang
1*, Member, IEEE, and
Ching-Hsien Hsu
2, Senior Member, IEEE
Abstract—Cloud computing is an innovative service platform to offer diverse resources such as infrastructure, platform and software as services. However, one challenging aspect of such a service is the impatient user threat, which directly leads to numerous negative impacts such as poor throughput, unpredictable workload variation and resources wasted. In this paper, the problems of conducting system controls in a cost-effective way and simultaneously satisfying performance guarantees are first studied. System losses are analyzed according to the related performance factors and waiting buffer sizes. A cost model is developed to address a performances/cost tradeoff issue in which the user balking, reneging, system blocking and resources provisioning are all taken into account. The relationship between system controls and throughput variations in a multi-servers system with a finite buffer is demonstrated. A proposed policy combined with a heuristic algorithm allows cloud providers to control the service rate and buffer size within a system loss guarantee by solving constrained optimization problems. Simulation results show that more cost-saving and system throughput enhancement can be verified as compared to a system without applying our policy.
Index Terms— Cost optimality, loss probability, system blocking, throughput rate
—————————— ——————————
1 INTRODUCTION
LOUD computing is an emerging service paradigm to eliminate the burden of complex infrastructure management for companies/users. This service paradigm is developed as a utility computing to offer the pool of computing resources in a pay-as-you-go manner rather than traditional “own-and-use” patterns [1], [2]. Cloud providers supply service resources based on several fun-damental models, including infrastructure as a service (IaaS), platform as a service (PaaS), and software as a ser-vice (SaaS). For example, Amazon Elastic Compute Cloud (EC2), Amazon S3, Google’s App Engine, Salesforce, etc. are all existing business models to provide computing infrastructure, data-storage, programming platforms, and software applications as services, respectively.
Cloud resources for providing on-demand or reserved instances can be leased through a network for temporary or long-term project needs. However, it is difficult to avoid either over-provisioning or under-provisioning when workloads have unpredictable/seasonal changes. Generally, resource over-provisioning helps to maintain quality of service (QoS), provide scalable resources, and
avoid poor performances. Nevertheless, this approach will lead to many shortcomings as follows. First, it is dif-ficult for a cloud provider to determine the best peak load provisioning. Second, huge energy consumption and sources provisioning cost are required; Third, most re-sources suffer from under-utilization for some days or months during off-seasons. Conversely, resource under-provisioning can conserve operational costs. However, performance degradations such as long waiting time, queuing length, high system loss, etc. are difficult to avoid.
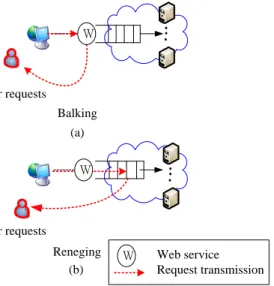
Some impatient users may abandon this services sys-tem immediately after experiencing intolerable latency. Furthermore, “Impatient users” [3], [4] that are commonly found in network services will inevitably occur in a cloud environment for making use of application software [5], [6]. A cloud service system with impatient users/jobs has attracted some research attentions from balancing elec-tricity bill [7], impatient task mapping [8] to pricing mod-el [9]. Here, we focus on the “balking” and “reneging” in a queuing system, as shown in Fig. 1 (a) and Fig. 1 (b), respectively. The balking means that users refuse to join the queue due to long queuing length. Unlike the balking, users who choose not to wait in a queue after facing la-tency would be accused of reneging.
To avoid poor throughput, performance levels should be negotiated according to user’s expectations and system’s abilities in advance. To reach a consensus on service contents, signing a service level agreement (SLA) is an essential process by all interested parties [10]. The
xxxx-xxxx/0x/$xx.00 © 200x IEEE Published by the IEEE Computer Society
C
————————————————
Y. J. Chiang and Y.C. Ouyang are with Dept. of Electrical Engineering, National Chung Hsing University, Taichung, Taiwan. E-mail: {[email protected]}, {[email protected]}
C. H. Hsu is with Dept. of Computer Science and Information Engineering Chung Hua University Hsinchu, Taiwan. E-mail: [email protected]
SLA outlines all aspects of cloud service usages and obli-gations, such as Quality of Service (QoS) guarantees, bill-ing, etc. Therefore, a penalty or compensation is required to pay when any party violates a SLA contract. In short, conducting an accurate performance analysis is required to satisfy performances guarantees in service-oriented systems. W Balking Balking User requests User requests (a) (a) User requests User requests Reneging Reneging (b) (b) W Web service Request transmission W
Fig. 1 Systems with (a) Balking (b) Reneging. In this paper, we discuss the problems: (i) what is the system control effect on operational costs and perfor-mances when facing unpredictable request arrival rates? (ii) How to evaluate the relationship between user balk-ing/reneging and system blocking on final throughput rates? (iii) How to address the optimal resource provi-sioning to achieve the cost optimality within a perfor-mance guarantee?
The optimal resource provisioning problem that we previously dealt with in [11] for profit optimization is further extended by taking into account the service rate control and user reneging impact. The main contributions of this paper can be summarized as follows:
The challenge issues of arrival rate variations and resources wasted for a finite buffer queue with impatient users are studied by taking into account some related performance factors and the possible losses in a service system.
A cost-effective policy combined with a heuristic algorithm is first proposed to address con-strained optimization problems. The relation-ship between important performance indicators and operational costs can be determined in our designed service model.
Simulations are conducted by considering dif-ferent threats of potential balking and reneging factors. Experiment results show that more cost-saving and system throughput enhancement can be verified as compared to a system without ap-plying our policy.
The remainder of this paper is structured as follows:
Section 2 gives a brief overview related to finite-buffer queues, impatient users, cost-effectiveness analyses and latency information. Section 3 describes a multi-servers queuing system with a finite buffer and impatient users. Probabilities of related system loss are calculated. In Sec-tion 4, a cost model is developed and the Cost-Effective policy in an Abandoned system (CEA policy) is presented to solve constrained optimization problems. Simulations and comparison of results are shown in Section 5. The whole work and future research are concluded in Section 6.
2 RELATED WORK
2.1 Queuing Systems with Impatient Users
Researches in diverse systems with impatient users have been a long history; a review of related works is provided as follows. In [12], the performance of a telephone system with patient and impatient users were both studied. Ex-pressions of performance measures, including the aver-age number of patient customers or impatient customers in the system, etc. could be expressed in terms of the joint probabilities. The waiting time probabilities, the average waiting time of a customer in a buffer, and the probability that a customer would be served as a patient customer were also obtained.
In [13], Mandelbaum and Zeltyn were motivated by a phenomenon that had been observed in a telephone call data center: a clear linear relation between an abandoned probability and an average waiting time. The issues that arose in the introduction would be explored within the framework of the M/M/n+G queuing system. System per-formances for a variety of patience distributions were explored over different arrival rates. Under the assump-tion that the arrival rate converged to zero, they comput-ed the asymptotic ratio between the probabilities of aban-doning.
An analytic cost model for M/G/1/N queuing systems was presented in [14]. Doran, Lipsky and Thompson ex-plored the interplay of queue size, customer loss, and mean service time for various service time distributions. It considered the cost of customer loss versus customer delays by varying buffer size and processor speed. In [15], Ghosh and Weerasinghe addressed a rate control problem associated with a single server. An infinite horizon cost minimization problem was considered. They obtained an explicit optimal strategy for the limiting diffusion control problem (the Brownian control problem or BCP) which consisted of a threshold-type optimal rejection process and a feedback-type optimal drift control. This solution was then used to construct an asymptotically optimal control policy.
A service system with impatient customer was an im-portant research issue in cloud resources provisioning, but little mentioned in previous works. In [5], Mehdi et al.
evaluated the proposed model impact on impatient jobs. The proposed algorithm mapped the jobs with inspiration by using Minimum Completion Time scheduling rithm (MCT). However, this work only presented an algo-rithm to evaluate the impact of the proposed model on impatient jobs. Rigorous analyses in performances factors were ignored.
2.2 Cloud Systems with Finite Buffers and Delay Information
Cloud computing has attracted considerable research at-tention, but only a few works done so far haveaddressed finite capacity models. In [16], a cloud center was model as an M/M/m/m queuing system to conduct a preliminary study of the fault recovery impact on a cloud service per-formance. When a user submitted a service request to the cloud, the request would first arrive at the cloud man-agement system (CMS) which maintained a request queue. If the queue was not full, the request would enter the queue; otherwise it would be dropped and the re-quested service failed. Cloud service performance was quantified by a service response time, whose probability density function was derived.
In [17], Khazaei, Misic and Misic described a novel approximate analytical model for performance evaluation of cloud server farms and solved it to obtain estimation of the complete probability distribution of request response time and other important performance indicators. They also pointed out that accommodated heterogeneous ser-vices in a cloud center might impose longer waiting time for its clients than a homogeneous equivalent. However, no buffer size control or no impatient behavior was dis-cussed or mentioned in their work.
On the other hand, for the purpose of enhancing ser-vice quality, information about delays was provided to users in cloud systems. In [18], Cappos et al. showed the Seattle program measures network latency to a list of IP addresses and displayed a webpage for showing the la-tency to each node. For modeling global cloud resources, a Voronoi Diagrams device was combined with near-real-time network latency information in [19]. Shouraboura and Bleher presented a novel Virtual Cloud Model (VCM) supplemented with near-real-time network latency in-formation.
Instances would communicate state information with each other in order to keep the “world” consistent in ap-pearance to all participants. VCM could also be used to share application placement information across different Clouds. In [20], Lim et al. proposed a Cloud Resource Estimation Module based on service latency information. A highly accurate service latency prediction mechanism was derived. Their designed system could provide a framework which facilitated service latency information collection for better cloud service management. It aimed
to use service latency information to provide fast re-sponse for various delay-sensitive cloud services.
2.3 Cost Effective Analyses for Cloud Computing
In additional, some existing researches focus on the issue of cost-benefit analysis in cloud computing. In [21], Selva-rani and Sadhasivam discussed a job grouping algorithm which was used to allocate the task-groups to different available resources. This scheduling algorithm measured both resource cost and computation performance, it also improved the computation/communication ratio by grouping the user tasks according to a particular cloud resource’s processing capability and sent the grouped jobs to the resource.
A cost-based resource scheduling paradigm was pre-sented in [22] by leveraging market theory to schedule compute resources and meet user’s requirement. The set of computing resources with the lowest price were as-signed to the user according to current suppliers’ resource availability and price. An algorithm and protocol were designed for cost-based cloud resource scheduling. The scheduling algorithm and protocol were described in the pure Java based platform, which had three-tiered hierar-chical and extensible architecture.
In [23], a minimum cost maximum flow algorithm was proposed for resources (e.g. virtual machines) placement in clouds. Hadji and Zeghlache focused on the optimal dynamic placement of virtual resources in data centers and cloud infrastructures to serve multiple users and tenants with time varying demands and workloads. Providers could use the minimum cost maximum flow algorithm to opportunistically select the most appropriate physical resources.
In [24], Hwang et al. presented a two-phase algo-rithm for service operators to minimize their service pro-vision cost. In the first phase, a mathematical formula was proposed to compute the optimal amount of long-term reserved resources. In the second phase, the Kalman fil-ter was used to predict resource demand and adaptively change the subscribed on-demand resources such that provision cost could be minimized. They exploited a pre-dictive-based resource management to adaptively config-ure VMs. To the best of our knowledge, the problems of achieving a cost-effective cloud system with finite buffer analyses and impatient job concerns have not been stud-ied.
3 MODEL DESCRIPTION
3.1 A Multi-Servers System with Blocking Control
We consider a cloud server farm with a finite buffer and model it as an M/M/R/K queuing system. The mathematical expressions are stated in detail as follows.
There have R identical servers and at most K user re-quests are allowed in the system. User rere-quests arrive from an infinite source with a mean arrival rate and follow a Poisson distribution [25], while service times have an exponential distribution with parameter μ.
The first-come-first-served (FCFS) queuing discipline is adopted and let the states n (n= 0, 1, 2,..., K) represent the number of user requests in the system. The value of the request arrival rate and the service rate are taken to be
, 0 1, , 1 1, (1) 0, , , , n n n K n n R n K R R n K
The probability of n user requests that are being served in the system is denoted by Pn. In a steady state, the proba-bility functions Pn can be obtained from the birth-and-death formula. According to the value n may happen, two segments are defined by the vector: [Segment 1, Segment 2] = [1 ≤ n ≤ R–1, R ≤ n ≤ K]. With expressions in Eq. (1), the initial state probability functions Pn can be derived as follows: 1 1 ! (2) . ! n o n n n o n R n P n R n P P R n K R R
To obtain Po, Eq. (2) and Eq. (3) are brought into the
nor-malizing equation: 0 n
1 (3)
n KP
, and the steady-state probability of zero service Po can be obtained as follows: 1 0 1
(4)
R n o n n n n n R K KP
P
P
P
1 1 0 [ ] . (5) ! ! n n R o n n n R n n R K P n R R
System utilization is equal to ρ=λ/Rμ, the steady-state solution always exists for all positive value of λ and µ, but when λ > Rµ, the number of user requests will be re-stricted within K in the system since there has no buffer (waiting space).
3.2 A Finite Buffer Queue with Impatient Users
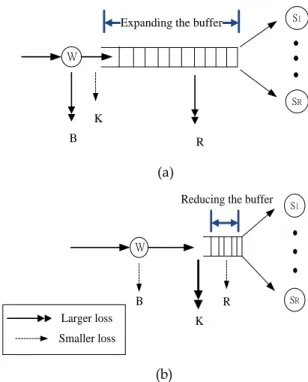
There are various balking and reneging rules dis-cussed in previous works. The queuing length and wait-ing time are usually the main factors to affect user balkwait-ing and reneging behaviors, respectively. As illustrated in Fig. 2 (a), the system blocking loss (denoted by K) can be reduced by expanding the buffer size. However, a larger waiting buffer will lead to a long queue and waiting time during peak load, which directly result in a higher balk-ing rate (denoted by B) and renegbalk-ing rate (denoted by R),
respectively. On the contrary, balking and reneging rates can be lessened by reducing the buffer size; however, it will lead to more system blocking loss, as depicted in Fig. 2 (b).
W
Expanding the buffer S1
SR B K R (a) W
Reducing the buffer S1
SR B K R Larger loss Smaller loss (b)
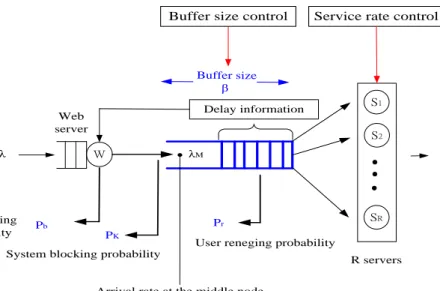
Fig. 2 (a) The effect of expanding the buffer size (b) The effect of reducing the buffer size on system losses. Since a user whose job request is blocked will simply be dropped, a cloud provider should keep system losses as low as possible to satisfy performance guarantees. Fig. 3 shows the proposed cloud service model which is com-prised of R servers with a finite buffer size, denoted by β. Dynamic system controls are used to alleviate system losses and deal with a widely varying load. Due to the fact that a system loss at a front stage directly affects sub-sequent performances, the request arrival rate at the mid-dle node (MN) queue and the final system throughput are evaluated by taking into account resources provisioning, related performance factors and potential user behaviors in the following.
3.3 Balking Probability
For the purpose of delivering quality service [26], [27], the delay information about the predicted queuing length is sent to inform each arrival user [28]. By using Eq. (5), the expected queuing length Lq can be obtained as:
1 1 1 ( ) ( / ) = ( ) . (6) ! q n R n R K n R o n R K L n R P P n R R
PK
Arrival rate λ W Throughput
R servers
Service rate control
λM
User reneging probability S1 S2 SR Buffer size β Web server Pr Pb Delay information
System blocking probability User balking
probability
Buffer size control
Arrival rate at the middle node
Fig. 3 A cloud service model with a finite buffer and impatient users Few arrival users may decide not to join the queue
and leave the system when the queuing length is too long to be accepted. The severity of balking and reneging rates at the end of per planning period will be recorded in this system. The corresponding notations used in this paper are listed in Table 1.
TABLE 1 List of Key Notations Notation Description
Ub Potential balking factor according to historical data.
Ur Potential reneging factor according to historical data.
Pb, Potential balking probability of which would be expressed as a function of Ub and Lq.
Pr Potential reneging probability of which would be expressed as a function of Ur and Wq.
PK Blocking probability when the system capacity is K.
λb Mean balking rate.
λr Mean reneging rate.
λK System blocking rate when the system capacity is K.
λM Arrival rate at the middle node (MN) depended on λb and λr.
λF Final throughput rate.
PL System loss probability.
By taking b divided by the mean queuing length and initial arrival rate, the potential balking factor, denoted by Ubcan be obtained as follow:
. (7) b b q U L
The balking probability can be calculated by multiplying the mean queuing length and its potential balking factor together as below:
. (8)
b q b
P L U
Based on the same service type at a subsequent period [29] with an arrival rate λ, the mean balking rate can be ob-tained as follow.
(9)
b b
P
3.4 System Blocking Probability
The blocking probability means that user requests cannot be retained in the queue due to lack of waiting-space when all servers are busy. That is, user requests are al-lowed to enter and obtain service if the buffer hasn’t been completely occupied. The subsequent request arrival rate
is (λ ‒ λb) after excluding the balking loss. Since the
con-trolled system capacity in the proposed system is K, the blocking probability can be calculated by using Eq. (5) as below: ( ) . (10) ! K b K K R K o P P R R
Then the system blocking rate, denoted by λK can be ob-tained as follow.
b
( ) . (11)
K PK
According to the user balking rate and the system block-ing rate, the request arrival rate at the MN queue, denot-ed by λMcan be given as follow.
b . (12)
M K
3.5 Reneging probability
Based on the rate of λM, the system performances at the MN queue, denoted by P0*, Pn* and the mean queuing length Lq* can be calculated by using Eq.(1)–Eq. (5) .
* * * 1 * 0 * * ( / ) 1 ( ). (13) ! 1 R K R M q P d L R d where * . M R
To find the predicted waiting time Wq* at the MN queue, the well-known Little’s law is applied [25]. It states that the average number of items waiting to receive ser-vice is equal to the average arrival rate multiplied by the mean time. Historically, it has been written as
L=λW (14) Then, the waiting time at the MN queue can be obtained as * * . (15) q q M L W
Dividing the mean recorded reneging rate r by the mean waiting time and the arrival rate at the MN queue, the potential reneging factor can be obtained as follow.
* . (16) r r q M U W
Similarly, the reneging probability can be calculated by multiplying the mean waiting time and the potential re-neging factor together as below:
*
(17)
r q r
P W U
Then, the expected reneging rate in the queue can be ob-tained as follow:
(18)
r r
MP
For the system with finite waiting buffer and impa-tient users, the final throughput rate, denoted by λF, is calculated as below:
. (19)
F b K r
After excluding all system losses, the final system utiliza-tion can be obtained as follow:
. (20) M r F R
Hence, the system loss probability can be estimated as:
4.
Cost analyses and the CEA policy
4.1 A Cost Model
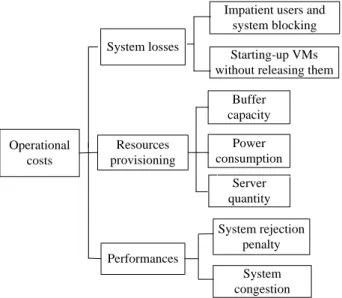
In a cloud system, the major operational costs of re-sources provisioning (incurred by server quantity, power consumption and buffer capacity), system losses (in-curred by impatient users, system blocking and activating
VMs) and performances (incurred by system rejection penalty and system congestion) are all taken into account, as shown in Fig. 4. Operational costs Resources provisioning System losses Performances System congestion System rejection penalty Starting-up VMs without releasing them
Starting-up VMs without releasing them
Impatient users and system blocking Impatient users and
system blocking Server quantity Server quantity Power consumption Power consumption Buffer capacity Buffer capacity
Fig. 4 The major operational costs in a cloud system. In general, virtual machines (VMs) will be activated when a job request has been accepted and forwarded into the buffer. However, some impatient users will renege after entering the queue and abandon the VMs immedi-ately. Therefore, the specific problem of cost overhead for activating VMs but without releasing them is required to be evaluated for a system with impatient users. The de-scriptions of cost notations are summarized as follows. C1≡ Expected server provisioning cost per server per unit
time;
C2≡ Expected power consumption cost per service rate per unit time;
C3≡ Expected cost incurred by preparing per buffer space per unit time;
C4≡ Impatient users and system blocking losses incurred by per request;
C5≡ Starting-up cost incurred by activating per VM;
C6≡ System rejection penalty;
C7≡ Cost incurred by holding jobs in the system per unit time;
C8≡ Cost incurred by jobs waiting in the system per unit time;
Since system performances, loss probability and oper-ational costs strongly depend on the buffer space and the service rate, an expected cost function per unit time is developed in which both the service rate and the buffer size are the main decision variables. Apparently, no users want to be blocked or abandon service due to inadequate buffer space or intolerable system delay, respectively. Hence, there should has a loss probability guarantee in a service system, which is also perceived as one of the most important performance concerns to measure service levels [30]. Here, the SLA constraint is specified by guarantee-ing: loss probability ≤ x%, where x is the maximum threshold value, denoted by SLA (x%). The cost minimi-zation (CM) with a loss probability guarantee can be
rep-. (21) F L P
resented mathematically as Minimize CM Subject to 0 ≤ PL < x Where CM = F (μ, β) = (RC1+μC2) /ρF +βC3+ (λr+λb+λK)C4+λrC5 +PK C6 + LqC7+Wq*C8 (22)
4.2 The Proposed CEA Policy
Here, the designed Cost-Effective policy in an Abandoned system (CEA policy) is presented to address the optimal solution of (μ, β), say (μ*, β*), so as to minimize the opera-tional cost without violating a SLA constraint. It focuses on solving the contradictory problem among reducing system losses and conserving operational cost. However, it is extremely difficult to obtain the analytical result of the optimal solution due to the fact that the cost function is highly nonlinear and complex. Instead, we present the CEA heuristic algorithm to find the minimum total cost by solving nonlinear constrained optimization problems under various incurred costs and user behavior varia-tions.
CAE heuristic algorithm
Input Data:
1. Arrival rate λ.
2. Potential balking and reneging factors [Ub, Ur]. 3. Cost matrix [C1, C2, C3, C4, C5, C6, C7, C8]. 4. The number of servers R.
5. The upper bound of service rate and buffer size in the cloud server farm, denoted by μp and βd.
6. The loss probability guarantees x in the SLA constraint. Output: μ*, β*and F(μ*, β*)
Step1. For i= 1; i = p; i++
Set μi← current service rate;
For j = 1; j = d; j++
Set βj← current buffer size;
Step2. Calculate Lq and λb using Eq. (5) - Eq. (9)
Calculate PK and λK using Eq. (2) and Eq. (10-12)
λM ← λ ‒ λb ‒λK;
Step3. Set λM ←arrival rate at the middle node queue;
Calculate Lq*, Wq*and λr using Eq. (13)-Eq. (19)
λF ←λM ‒λr;
Step4. Set λF ←expected final throughput rate; CalculateρF using Eq. (20)- Eq. (21)
PL ←(λ ‒ λF)/ λ; If PL < x, then
Bring all cost parameters into the developed cost model and begin to calculate F (μi, βj) Else
Return to step 1 and begin to test a next index. End
Step5. If the joint value of (μi, βj) can obtain the minimum cost value in all tests, then,
Output (μi, βj) and F(μi, βj) Else
Return to step 1 and begin to test a next index. End
5 NUMERICAL VALIDATION
5.1 System Performances
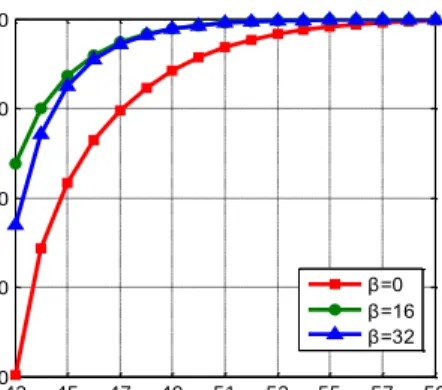
To gain more insight into the designed system behavior, first of all we provide several experiments to observe the effect of resources provisioning on performances. Numer-ical simulations are demonstrated by assuming λ=2500 request/min, Ur= Ub=0.01, R=64 and the buffer size is made variable from 0, 16 to 32 in three steps. All computational programs are developed by using MATLAB.
Fig. 5 Arrival rate at the MN queue under various μ and the given β values.
Fig. 6 Loss probability under various μand the given β values.
Fig. 5 and Fig. 6 demonstrate the variation of the re-quest arrival rate at the MN queue and the loss probabil-ity distribution under different service rates and buffer sizes, respectively. It’s observed that increasing the ser-vice rate can certainly improve the arrival rate at the MN queue. However, increasing the buffer size does not nec-essarily improve the arrival rate at the MN queue. It can be seen that it will cause the highest loss probability if there has no buffer available and it does not contribute to reducing the loss probability through buffer over-provisioning. Both performance gaps between different β values become smaller and converge to nearly equal as
43 45 47 49 51 53 55 57 59 2300 2350 2400 2450 2500 Service rate A rr iv a l ra te a t th e M N q u e u e β=0 β=16 β=32 43 45 47 49 51 53 55 57 59 0 0.01 0.02 0.03 0.04 0.05 0.06 Service rate L o s s p ro b a b ili ty β=0 β=16 β=32
the service rate further increases.
5.2 Experimental Results
The experiments have been conducted to validate that the optimal resources provisioning can be obtained by apply-ing the heuristic algorithm and show that the CEA policy is practical. It’s assumed that λ=5200 request/min, Ur=Ub=0.006, R=100, while the loss probability constraint is 0.5%, denoted by SLA(0.5%). Since a server provision-ing cost is mostly determined by the rent/purchase cost and power consumption cost, the server provisioning cost can be roughly estimated according to different require-ments.
Here, we assume [C1, C2, C3, C4, C5, C6, C7, C8] = [200, 30, 20, 60, 50, 10, 5, 5] in experiments. The effect of varying μ and β values to find the minimum cost is shown in Fig. 7. It’s noted that the minimum cost of 27544.85 can be ob-tained at the optimal solution (μ*, β*) = (62, 12). The loss probability distributions under various μ and β values are demonstrated in Fig. 8. The effect of the service rate on the loss probability variation is larger than the buffer size. As can be seen, reducing the loss probability at beginning
can lower the cost (corresponds to Fig. 7). However, as the loss probability further reduces, it leads to no more cost reduction.
This behavior is due to the fact that, maintaining an extremely low loss probability requires more resources provisioning, which directly results in high cost burden. The corresponding loss probability at the optimal solu-tion is 0.29%. Simulation results have verified that the system can satisfy the SLA constraint and simultaneously obtain the minimum operational cost by applying the CEA policy. In the next experiments, system blocking probabilities under various μand β values are shown in Fig. 9. As can be expected,the system blocking probabili-ties can be reduced by increasing either the service rate or the buffer size. The lower blocking probability of 0.1% can be obtained at the optimal solution. After excluding the balking and the system blocking rate, the remaining arrival rates at the MN queue is shown in Fig. 10. The effect of the buffer size on the arrival rate at the MN queue is larger when the service rate is low; however, it becomes virtually undetectable when the service rate is high.
Fig. 7 Cost distributions under various Fig. 8 Loss probability distributions under
μand β values. various μand β values.
Fig. 9 System blocking probabilities under Fig. 10 Arrival rates at the MN queue under various μand β values. various μand β values.
The higher arrival rates at the MN queue of 5193.72 al-so can be achieved by adopting the CEA policy. The
re-neging rate and the system throughput rate distributions are shown in Fig. 11 and Fig. 12, respectively. It’s noted 2 6 10 14 18 22 26 30 59 60 6162 63 64 65 66 27,500 28,000 28,500 29,000 29,500 Buffer size Service rate C o s t F(62, 12)= 27544.85 2 6 10 14 18 22 26 30 59 60 6162 63 64 65 66 0 0.002 0.004 0.006 0.008 0.01 0.012 Buffer size Service rate L o s s p ro b a b ili ty 0.29% 2 6 10 14 18 22 26 30 59 60 61 620 63 64 65 66 0.2% 0.4% 0.6% 0.8% 1% Buffer size Service rate S y s te m b lo c k in g p ro b a b ili ty 0.1% 2 6 10 14 18 22 26 30 59 60 61 62 63 6465 66 5165 5170 5175 5180 5185 5190 5195 5200 Buffer size Service rate A rr iv a l ra te a t M N q u e u e 5193.72
that the reneging rate can be reduced by increasing the service rate or lessening the buffer size. Besides, the im-pact of the buffer size becomes virtually undetectable when the system operates at a higher service rate. The same tendency can be found in the throughput rate, as shown in Fig. 12.
Fig. 11 Reneging rates under various μand β values
Fig. 12 Throughput rates under various μand β values.
5.3 Comparison of Results
A general approach, which implies that a solution is cal-culated only by considering an absolute performance guarantee is used as a basis for comparison since most of the previous works [31], [32], [33] had adopted this ap-proach to manage cloud resources. For the sake of sim-plicity, here it’s referred to as a non-CEA policy since no system loss evaluations or cost optimization analyses are considered. Next, we try to show that the CEA policy is also applicable for a system with a fixed buffer size. Ex-periments are conducted by assuming that λ=500 re-quest/min, R=20 and both policies need to comply with the same loss probability guarantee of SLA(5%).
Naturally, users react variously to different degrees of latency. In additional, many potential factors such as individual feelings, satisfaction, delay tolerant, etc. cannot
be ignored since it may also influence user's decision. In the designed system, the abandonment information will be recorded at per planning period. For an existing cloud computing service, the balking and reneging potential factors can be obtained from an actual historical statistic. Here both parameters are randomly chosen and three different cases are performed.Both policies are evaluated by assuming potential balking/reneging factors (Ub; Ur) = (0.005; 0.005), (0.005; 0) and (0; 0.005) in order to study and compare the influence of different impatient situa-tions on the operational costs and performances. Besides, different buffers of size 1, 10 and 20 are assigned.
- (Ub; Ur) = (0; 0.005), in order to study the behavior of both policies when a system without balking but has the threat of reneging users.
- (Ub; Ur) = (0.005; 0), in order to study the behavior of both policies when a system without reneg-ing but has the threat of balkreneg-ing users. - (Ub; Ur) = (0.005; 0.005), in order to study the behavior of
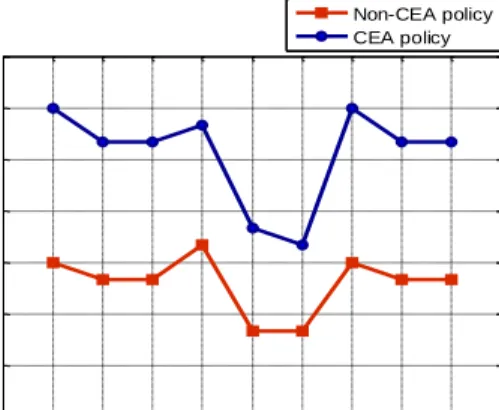
both policies when there have both threats of balking and reneging users in the system. Comparisons of the controlled service rates are shown in Fig. 13. As can be seen, it will result in a higher service rate for reducing system losses when the given buffer size is less. The results show that the service rates determined by the non-CEA policy are lower than the CEA policy since the former tries to reduce resources provisioning cost as more as possible. However, the lower operational cost can be achieved by applying the CEA policy, as shown in Fig. 14. It’s noted that the system will result in higher cost under a larger given buffer size when there has the threat of reneging.
Fig. 13 Comparison of the service rate. 2 6 10 14 18 22 26 30 59 60 61 6263 64 65 66 0 2 4 6 8 10 12 Buffer size Service rate R e n e g in g r a te 2 6 10 14 18 22 26 30 59 60 61 62 63 64 65 66 5,140 5,150 5,160 5,170 5,180 5,190 Buffer size Service rate T h ro u g h p u t ra te 1 10 20 1 10 20 1 10 20 23 26 29 32 35 38 41 44 (0; 0.005) (0.005; 0) (0.005; 0.005) Buffer size and (Ub; Ur)
S e rv ic e ra te Non-CEA policy CEA policy
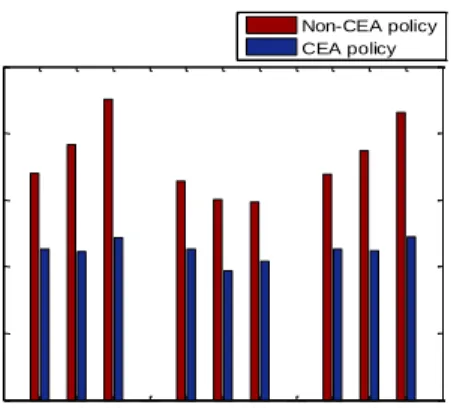
Fig. 14 Comparison of the operational cost. Nevertheless, the costs can be reduced by applying the CEA policy and they also can be maintained relatively stable as compared to the non-CEA policy. Comparisons of the throughput rate are shown in Fig. 15. It’s noted that the throughput rate can be improved significantly by ap-plying the CEA policy.
Fig. 15 Comparison of the throughput rate.
Fig. 16 Cost improvement rate.
Finally, we measure the cost improvement ratio, which calculates the relative value of improvements to the original value instead of the absolute value; the results are shown in Fig 16. The relative improvement rate is up to 46% in terms of cost reduction. The comparison of results has shown that more cost-saving and throughput rate enhancement can be achieved by applying the CEA
poli-cy.
6 CONCLUSION AND FUTURE WORK
Developing a successful service system necessitates tak-ing into account not only system control factors but also user behaviors. However, most existing studies fail to offer an effective system control to capture optimization opportunities when facing impatient users and various incurred costs. To tackle the problem, the effect of re-sources provisioning on system losses and the through-put rate are studied in our work. A cost model is devel-oped to conduct the costs/performances tradeoff accord-ing to the incurred costs, system losses, resources provi-sioning and system performances.
The proposed CEA policy contributes to addressing the optimal service rate and buffer size controls in a sys-tem with a finite buffer and impatient users. Experiment results have shown that realizing cost-effective resources provisioning within a loss probability guarantee can be obtained by applying the CEA policy. As compared to a system without applying our approach, the benefit of reducing cost is up to 46 percent. As for future works, we plan to analyze more challenging issues such as traffic load control mechanisms, finite population concerns, etc. for conducting a comprehensive control strategy.
R
EFERENCES[1] S. Sivathanu, L. Liu, M. Yiduo, and X. Pu, "Storage management in virtualized cloud environment," 2010 IEEE 3rd International Conference on Cloud Computing (CLOUD), pp. 204-211, 2010. [2] R. Zhang, and L. Liu, "Security models and requirements for
healthcare application clouds," IEEE 3rd International Conference on Cloud Computing (CLOUD), pp. 268-275, 2010.
[3] K. Wang, N. Li, and Z. Jiang, “Queueing System with Impatient Customers: A Review,” IEEE International Conferenceon Service Operations and Logistics and Informatics (SOLI), pp. 82-87, 2010. [4] J. Li, T. Dai, J. Huo, and Q. Su, “A Method of Service Quality
Monitoring in Contact Centers with Impatient Customers,” 9th International Conference on Service Systems and Service Management (ICSSSM), pp. 114-117, 2012.
[5] N. Mehdi, A. Mamat, H. Ibrahim and S. Symban, “Virtual ma-chines cooperation for impatient jobs under cloud paradigm,” In-ternational Journal of Information and Communication Engineering, vol. 7, no. 1, pp.13-19, 2011.
[6] C. Cardonha, M. D. Assunção, M. A. Netto, R. L. Cunha, and C. Queiroz, "Patience-aware scheduling for cloud services: Freeing users from the chains of boredom," Springer Berlin Heidelberg In Service-Oriented Computing," pp. 550-557, 2013.
[7] M. Mazzucco and D. Dyachuk, "Balancing electricity bill and performance in server farms with setup costs," Future Generation Computer Systems, vol. 28, no. 2, pp. 415-426, 2012.
[8] N. A. Mehdi, A. Mamat, H. Ibrahim, and S. K. Subramaniam, "Impatient task mapping in elastic cloud using genetic algorithm," Journal of Computer Science, 7(6), 877, 2011.
[9] T. Keskin, and N. Taskin, "A pricing model for cloud computing service," Hawaii International Conference on System Sciences (HICSS), pp. 699-707, 2014.
[10] K. M. Sim, “Agent-Based Cloud Computing,” IEEE Transitions on Services Computing, vol. 5, no. 4, pp. 564-577, 2012.
1 10 20 1 10 20 1 10 20 0 1000 2000 3000 4000 5000 (0; 0.005) (0.005; 0) (0.005; 0.005) Buffer size and (Ub; Ur)
C os t Non-CEA policy CEA policy 1 10 20 1 10 20 1 10 20 450 460 470 480 490 500 (0; 0.005) (0.005; 0) (0.005; 0.005) Buffer size (Ub; Ur)
T h ro u g h p u t ra te Non-CEA policy CEA policy 1 10 20 1 10 20 1 10 20 0 10 20 30 40 50 (0; 0.005) (0.005; 0) (0.005; 0.005) Buffer size and (Ub; Ur)
C o s t im p ro v e m e n t ra te (% )
[11] Y. J. Chiang and Y. C. Ouyang, "Profit Optimization in SLA-Aware Cloud Services with a Finite Capacity Queuing Model."
Mathematical Problems in Engineering, 2014.
[12] Y. Q. Zhao and A. S. Alfa, “Performance analysis of a telephone system with both patient and impatient customers,” Telecom-munication Systems, pp. 201-215, 1995.
[13] A. Mandelbaum and S. Zeltyn, “The impact of customers’ pa-tience on delay and abandonment: some empirically-driven experiments with the M/M/n+G queue,” OR Spectrum, vol. 26, no. 3, pp. 377-411, 2004.
[14] D. Doran, L. Lipsky and S. Thompson, “Cost-based Optimiza-tion of Buffer Size in M/G/1/N Systems Under Different Service-time Distributions,” Proceedings of 9th IEEE Network Computing and Applications (NCA), pp. 28-35, 2010.
[15] A. P. Ghosh, and A. P. Weerasinghe, “Optimal buffer size and dynamic rate control for a queueing system with impatient cus-tomers in heavy traffic,” Stochastic Processes and their Applica-tions, pp. 2103-2141, 2010.
[16] B. Yang, F. Tan, Y. S. Dai, and S. Guo, “Performance Evaluation of Cloud Service Considering Fault Recovery,” Cloud Computing. Springer Berlin Heidelberg, pp. 571-576, 2009.
[17] H. Khazaei, J. Misic, and V. B. Misic, “Performance Analysis of Cloud Computing Centers Using M/G/m/m+r Queuing Sys-tems,” IEEE Transactions on Parallel and Distributed Systems, pp. 936-943, 2012.
[18]J. Cappos, I. Beschastnikh, A. Krishnamurthy, and T. Anderson, "Seattle: a platform for educational cloud computing," ACM SIGCSE Bulletin, vol. 41, no. 1, pp. 111-115. 2009.
[19] C. Shouraboura and P. Bleher, "Placement of applications in computing clouds using Voronoi diagrams,” Journal of Internet Services and Applications, vol. 2, no.3, pp. 229-241, 2011.
[20] B. P. Lim, P. K. Chong, E. K. Karuppiah, Y. M. Yassin, A. Naz-ir,and M. F. N. Batcha, "FARCREST: Euclidean Steiner Tree-based cloud service latency prediction system," Consumer Com-munications and Networking Conference (CCNC), pp. 665-668, 2013. [21] S. Selvarani and G. S. Sadhasivam, “Improved cost-based
algo-rithm for task scheduling in cloud computing,” IEEE Interna-tional Conference on ComputaInterna-tional Intelligence and Computing Re-search (ICCIC), pp.1-5, 2010.
[22] Z. Yang, C. Yin, and Y. Liu, “A Cost-based Resource Scheduling Paradigm in Cloud Computing,” 12th International Conference on Parallel and Distributed Computing, Applications and Technologies, pp. 417- 422, 2011.
[23] M. Hadji and D. Zeghlache, “Minimum Cost Maximum Flow Algorithm for Dynamic Resource Allocation in Clouds,” IEEE Fifth International Conference on Cloud Computing, pp.876-882, 2012.
[24] R. Hwang, C. Lee, Y. Chen, and J. D. Zhang, “Cost Optimization of Elasticity Cloud Resource Subscription Policy,” IEEE Transi-tion on Services Computing,2013.
[25] D. Gross, J. F. Shortle, J. M. Thompson and C. M. Harris. Fun-damentals of Queuing Theory (Fourth edition), A John Wiley & Sons, Inc., New York, 2008.
[26] J. Cao et al., “Social attribute based web service information publication mechanism in Delay Tolerant Network,” IEEE 14th International Conference on Computational Science and Engineering (CSE), pp. 435- 442, 2011.
[27] M. Armony and C. Maglaras, “Contact Centers with a Call-Back Option and Real-Time Delay Information,” Operations Research,
vol. 52, no. 4, pp. 527–545, 2004.
[28] P. Guo and P. Zipkin, “Analysis and Comparison of Queues with Different Levels of Delay Information,” Management Sci-ence, vol. 53, no. 46, pp. 962–970, 2007.
[29] Amazon EC2 On-Demand Instance Prices, http://aws.amazon.com/ec2/pricing/.
[30] M. Y. Luo and C. S. Yang, “Constructi.ng zero-loss Web ser-vices,” IEEE Computer and Communications Societies Confer-ence, pp.1781-1790, 2001.
[31] J. Shao, and Q. Wang, "A performance guarantee approach for cloud applications based on monitoring," IEEE 35th Annual
Com-puter Software and Applications Conference Workshops (COMP-SACW), pp. 25-30, 2011.
[32] R. Nathuji, A. Kansal, and A. Ghaffarkhah, "Q-clouds: managing performance interference effects for qos-aware clouds," ACM Proceedings of the 5th European conference on Computer systems, pp. 237-250, 2010.
[33] R. N. Calheiros, R. Ranjan,and R. Buyya, "Virtual machine pro-visioning based on analytical performance and QoS in cloud computing environments," International Conference on Parallel Processing (ICPP), pp. 295-304, 2011.
Yi-Ju Chiang received her BS and MS degrees from the Department of Elec-trical Engineering (EE) at National Chung-Hsing University of Taiwan in 2011 and 2013, respectively. She is currently working toward the PhD degree in Department of Electrical Engineering (EE) at National Chung-Hsing University. Her research interests include cloud computing, optimal control algorithm, performance eval-uation, queuing theory and green computing system. She is an IEEE student member.
Yen-Chieh Ouyang (S’86–M’92) re-ceived the BSEE degree in 1981 from Feng Chia University, Taiwan, and the MS degree in 1987 and the PhD degree in 1992 from the Department of Elec-trical Engineering, University of Memphis, Memphis, Tennessee. He joined the Faculty of the Department of Electrical Engi-neering at National Chung Hsing University, Taiwan, in August 1992. He currently is a professor and the depart-ment chair in the Departdepart-ment of Electrical Engineering, NCHU. His research interests include cloud computing, hyperspectral image processing, medical imaging, com-munication networks, network security in mobile net-works, multimedia system design, and performance eval-uation. He is a member of the IEEE.
Professor Ching-Hsien (Robert) Hsu is a professor in department of comput-er science and information enginecomput-er- engineer-ing at Chung Hua University, Taiwan; and distinguished chair professor in school of computer and communica-tion engineering at Tianjin University of Technology, China. His research includes high performance computing, cloud computing, parallel and distributed systems. He has published 200 papers in refereed journals, conference proceedings and book chapters in these areas. He has been involved in more than 100 conferences and work-shops as various chairs and more than 200 confer-ences/workshops as a program committee member. He is an IEEE senior member.