Computer Skill Acquisition: The Effects of Computer-aided Self-explanation
on Knowledge Retention and Transfer
Tai-Yin Chi
Claremont Graduate University [email protected]
Lorne Olfman
Claremont Graduate University [email protected]
Dale E. Berger Claremont Graduate University
Abstract
We conducted an experimental study to determine to what extent computer skill learners can benefit from generating self-explanation with the aid of different computer-based visualization technologies. Self-explanation was stimulated with dynamic visualization (Screencast), static visualization (Screenshot), or verbal instructions only, and compared to a control group with no self-explanation instructions. Sixty-two subjects were assigned to these four conditions for learning HTML fundamentals. Two quizzes were used to test learning outcomes. In comparison to the control condition, performance was best with dynamic visualization and static visualization. The self-explanation condition without visualization did not attain statistical significance in comparison to the control condition. Qualitative data collected from a learning experience survey regarding the subjects’ opinions about self-explanation prompts showed that subjects in different treatment groups gave similar responses about how they benefited from self-explanation prompts for learning HTML.
1. Introduction
Self-explanation (SE) is a constructive learning activity in which one explains something to oneself in an attempt to make sense of new information, either presented in a text or in some other medium [1]. Self-explanation is generally accepted as an important, effective, and domain-general means to improve learning. Research has shown evidence that self-explanation benefits learning in many domains (such as programming, mathematics, reading, electrical engineering, and biology) and in different age range groups, from four-year-olds to adults [2][3][4][5][6][7][8][9][10][11]. Although there is a growing body of literature supporting the benefits of self-explanation for learning, it is still unclear to what extent learners can benefit from using computer technologies (e.g., a screenshot application or a screencast application) to help them generate self-explanations.
To learn skills in the programming domain, one needs to acquire both conceptual and procedural knowledge. For example, in the context of web programming, the document object model (DOM)1 is an important concept that a programmer needs to manipulate HTML2 elements, which will be applied to creating the procedure (the sequence of written code) for presenting multiple animation effects. Learners develop their mental models [12] to represent their cognition of web programming during learning. Chi [13] found that the active construction and revision of a learner’s mental model is responsible for the benefit of self-explanation. Multimedia learning research has found that adding visualizations (e.g., pictures, line drawings, videos) to learning materials benefits learners by helping them develop their mental models [14]. In the aforementioned programming case, the visualization process can be helpful for a learner to create a pictorial connection between the programming code and the executed results.
There are software technologies that can aid learners to generate self-explanation. For example, a screencasting application like Screencast-O-Matic3 allows learners to record video and audio as they demonstrate their actions on a computer. This could produce a potential benefit because learners can self-explain what they learned in a more dynamic manner than just using text. Thus a web programmer, with the aid of a screencasting application, can explain how she creates animation effects (dynamic presentations) on a web page. She can explain how the code works and demonstrate the animation on a real web page. This capability of showing dynamic outcomes could help a web programming learner develop a better mental model by self-explaining what she learned. Similarly, a screenshot application like the “Snipping Tool” in the Microsoft Windows 7/8/10 Operating System can
1DOM: Document Object Model--a platform- and language-neutral
interface that will allow programs and scripts to dynamically access and update the content, structure and style of documents (retrieved from http://www.w3.org/DOM last accessed on January 20, 2014).
2HTML: Hyper Text Markup Language.
3http://www.screencast-o-matic.com last accessed on June 20, 2015. Proceedings of the 50th Hawaii International Conference on System Sciences | 2017
capture static computer screenshots to aid learners to generate self-explanation with visualization. A limitation of a screenshot is that it does not have the capability to create a dynamic demonstration (e.g., showing an animation effect on a web page).
Generating self-explanation with the aid of computer technologies is likely to promote learning transfer and retention because it helps the learners to develop or revise their mental models, but it is also likely to demand more cognitive resources for generative processing and the use of computer technology. Thus, there is a need to examine whether it is worthwhile for a learner, when learning a task, to allocate more cognitive resources for generating self-explanations with computer-based visualization. Furthermore, it is necessary to determine whether the self-explanation effect generated by learners with the aid of computer-based visualization is superior to the self-explanation effect generated without the aid of computer-based visualization.
The main purpose of this study was to determine to what extent computer skill learners can benefit from generating self-explanation with the aid of different computer-based visualization technologies. To understand this question, this study tested two common computer-based visualization technologies, screencast and screenshot applications, which have different features as discussed in Section 2. The screencast application has the capability of creating dynamic visualizations and the screenshot application does not have it. Four conditions were compared:
• Learners do not generate self-explanation • Learners generate self-explanation without the
aid of computer-based visualization technologies
• Learners generate self-explanation with the aid of static screenshot visualization
• Learners generate self-explanation with the aid of dynamic screencast visualization.
2. Background
2.1. Self-explanation
For over twenty years, Chi and colleagues have been investigating a phenomenon known as self-explanation. Self-explanation (SE) is a constructive learning activity in which one explains something to oneself in an attempt to make sense of new information [1]. It is necessary to understand that self-explanation is distinct from simply repeating the newly received information. Self-explanation involves the relating of concepts and procedures to examples or other concepts so it can help a learner generate new insight. The
discovery of self-explanation as a learning strategy hinged on the assumption that new knowledge cannot be readily and perfectly assimilated (or encoded) by the learner from direct instruction, either in the form of listening to an instructor’s explanation, or in the form of reading a textbook. Instead, the acquisition of new knowledge requires learners to be actively involved in the construction of their own knowledge. As shown in Figure 1, active construction is a broad term denoting both the external behavioral aspects of learning (e.g., drawing a diagram, answering and asking questions, solving a problem) as well as the internal processes of cognitive reorganization (e.g., the construction and revision of one’s mental models) [15].
Figure 1. The mechanism of self-explanation Self-explanation benefits learning in many domains and in different age range groups, from four-year-olds to adults [2][3][4][5][6][7]. The accumulation of evidence has shown that the self-explanation effect is not confined to only a few domains and has brought the insight that certain strategies or types of self-explanation are more beneficial than others. For example, it was found that successful self-explainers generate more self-explanations [16]. Further research indicated that the benefit of self-explanation is related to both the amount and the quality of self-explanation [13][17][18]. Furthermore, an in-depth analysis of previous studies of self-explanation showed that the benefit of self-explanation is strongly related to the active construction and revision of a learner’s mental model [13]. Ainsworth and Burcham [19] also found that self-explanation was used not only to fill in missing information or knowledge gaps, but also to support knowledge revision and mental model repair.
Subsequent research tested whether the subjects who were trained in self-explanation procedures performed better than those who were not trained. For example, McNamara [20] developed a self-explanation reading training program (SERT) and found that for a group of psychology undergraduate students studying science-based text passages, training significantly
improved text-based comprehension during training compared to reading aloud alone. Following the success of the human one-to-one training program of SERT, a web-based training application called Interactive Strategy Training for Active Reading and Thinking (iSTART) was developed and shown to improve students’ reading comprehension scores when compared to students who did not receive the iSTART training regardless of their level of prior knowledge [21][22]. The research studies demonstrated that self-explanation could be taught and that subjects in the self-explanation groups generated a higher number of self-explanations and performed better on a variety of learning outcomes across multiple domains.
Some studies focused on the optimal conditions under which self-explanation is found to have a beneficial learning impact. The self-explanation effect has been demonstrated as well as for learners who have little to no prior knowledge of the topic [23]. Although there is inconsistency in the findings of several studies with respect to whether self-explaining benefits the low or high prior knowledge learners more, one interpretation of the mixed results is that self-explanation can benefit both low and high prior knowledge learners for different reasons. For learners with high prior knowledge, the act of self-explaining allows them to repair their existing mental models and thus improve learning outcomes, whereas for learners with low prior knowledge, the act of self-explaining allows them to generate inferences to fill gaps of missing knowledge [1].
Other studies examined whether the format of the study material had an impact on learning from self-explanation. For example, Ainsworth and Loizou [2] found that learners presented with diagrams generated significantly more self-explanations and showed greater learning outcomes than learners presented with the materials in a text-only format. Butcher [24] found that simple diagrams led to more inference generation in college students studying the circulatory system when compared with students presented with text-only or complex diagrams.
Researchers have been studying the benefits of self-explanation for learning from different perspectives. However, it is still unclear to what extent learners can benefit from using computer technologies (e.g., word processor, screenshots, and screencasts) to help them generate self-explanations in the forms of different media (e.g., typing texts, typing texts with static images, or creating screencasts). This study aims to understand the effect of self-explanation generated with computer-based visualizations in the learning context of computer skill acquisition.
2.2. Multimedia learning and Self-explanation
Mayer and Moreno [25] define multimedia learning as learning from words and pictures and define multimedia instruction as presenting words and pictures that are intended to foster learning. The words can be printed (e.g., on-screen text) or spoken (e.g., narration), while the pictures can be static (e.g., illustrations, graphs, charts, photos, maps) or dynamic (e.g., animation, video, or interactive illustrations) [25]. Multimedia learning research has centered on the question of whether adding visualizations to words in instructional messages can improve student learning.
Advances in computer-based visualization technology have enabled the incorporation of sophisticated graphics in instruction, including animations, videos, illustrations, and photos. Mayer defines an instructional visualization (or instructional picture or instructional graphic) as a visual-spatial representation intended to promote learning. Instructional visualizations can vary along several dimensions [26]:
• Realism—pictures can vary from high realism (e.g., a photo or video) to low realism (e.g., a line drawing or an animated line drawing);
• Dynamism—pictures can be static (e.g., a drawing or photo) or dynamic (e.g., an animation or video);
• Interactivity—pictures can be interactive (e.g., a series of drawings that can be paced by the learner or an animation that can be stopped and started by the learner) or non-interactive (e.g., a drawing or continuous animation);
• Dimensionality—pictures can be presented in 2D or 3D form;
• Visual-spatial character—pictures can be visual representations (e.g., a drawing or photo of an object) or spatial representations (e.g., a chart or table or map);
• Delivery medium—pictures can be presented on a page or screen.
In a review of multimedia learning research across thirteen experimental comparisons involving lessons on topics such as how brakes, pumps, or lighting works [26], people performed better on transfer tests when they learned from printed text and illustrations than from printed text alone [27][28][29][30] or from narration and animation than from narration alone [31][32][33][34]. The median effect size (d) favoring words and pictures over words alone is 1.35, which is considered a large effect. These results show evidence that people learn better from words and pictures than from words alone.
Multimedia learning research emphasizes that adding visualizations to instructional materials can reduce learners’ cognitive load and help them develop mental models so as to promote learning, whereas explanation research emphasizes that generating self-explanation is an active process of cognitive reorganization which helps learners not only to identify and fill in knowledge gaps, but also to construct and repair their mental models. In other words, multimedia learning focuses on designing the learning materials with the aid of visualizations to deliver new information to a learner, while self-explanation focuses on a learner’s cognitive reorganization/reconstruction of the new information with prior knowledge. Both approaches aim to improve learning, but multimedia learning emphasizes more on constructing a better learning structure (environment) for learners, whereas self-explanation highlights the benefits of learners’ active involvement in the construction of their own knowledge.
The self-explanation technique can be used by a person either overtly (e.g., output as verbal protocols) or covertly (e.g., self-explain in one’s mind). Although in most self-explanation studies learners self-explain overtly because of the pragmatic reason to collect protocol data, one could self-explain and think covertly [1]. The self-explanation technique can also be applied overtly in different forms other than verbal protocols. For example, one could self-explain new information by typing texts, drawing pictures/charts/mind maps or creating videos. Based on the reviews of multimedia learning and self-explanation research, one interesting question is raised: Does adding visualizations when self-explaining a concept/procedure enhance or hinder the effectiveness of self-explanation on promoting learning?
There is a lack of research addressing the above question. An example of learning web programming reveals why the above question is interesting in the learning context. In web programming, a client-side scripting language such as JavaScript is commonly used to deal with user interactions (e.g., alert messages and forms) between a user and a web browser to control the presentation of web contents (e.g., create animation effects). Assuming a student learns a new function of JavaScript to perform an animation effect on an object of a web document (web page), he/she could self-explain covertly how the JavaScript function works by thinking through what the code should be and imagining the result of execution, or he/she could self-explain overtly by adding visualizations (static or dynamic) to create the mental connection between the JavaScript code and the animation effect. This mental connection can be helpful for the learner to encode the
new knowledge to his/her long term memory and produce deep learning.
As explained above, by adding visualizations an observable overt learning activity can be integrated as a part of the explanation process. Generating self-explanations with the aid of computer-aided visualization is likely to promote learning transfer and retention because it helps the learners to develop or revise their mental models, but it is also likely to demand more cognitive resources for generative processing and the use of computer technology [35]. Thus, there is a need to examine whether it is worthwhile for a learner, when learning a task, to allocate more cognitive resources for generating self-explanations with computer-aided visualization. Furthermore, it is important to know whether the self-explanation effect generated by learners with computer-aided visualization is superior to the self-explanation effect generated without computer-aided visualization.
2.3.
Computer-based visualization technologies
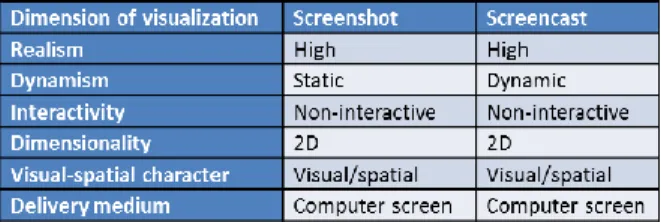
In this research project, we study whether adding visualizations can improve the effect of self-explanation. To minimize the cost of using technology to generate self-explanations (e.g., the demand of cognitive resources used to learn the technology), the selected computer-based visualization technologies in this study need to be easy to learn and use. The study focuses on two common computer-based visualization technologies: screencasts and screenshots. Table 1 shows the dimensions of the selected visualization technologies. The main difference between the two selected technologies is the dimension of dynamism. The features of each computer-based visualization technology and its relationship to self-explanation are described in the following sub-section.
Table 1.The dimensions of the selected visualization technologies
The term “screencast” was coined by Udell [36]. A screencast is a screen capture of the actions on a user’s computer screen with or without real time audio narration. Screencasts are usually produced and outputted in various video formats and can be post-processed to enhance video quality such as trimming unnecessary parts and adding transition effects.
Compared to common video tutorials, screencasts tend to be shorter and are easily produced by a single person on a computer with screencasting software and an audio recording device, if available [37]. Recent products like Screencast-O-Matic and Screenr4 are free web-based screencasting tools by which users can easily record screencasts and download them or share them on Internet sites such as YouTube.com. Proprietary products like Camtasia Studio5 support more compact, cross-platform file formats suitable for web-based delivery such as Adobe Flash6, and have more sophisticated editing features allowing changes in sequence, mouse movement, and audio.
Screencasts have been used in various contexts including information literacy instruction, specialized library database instruction, common reference queries and distance learning. A natural application of this technology is the creation of web-based lectures demonstrating and explaining, step-by-step, the process of using software.
In addition to recognizing individuals’ benefits of consuming (watching) screencasts in different learning domains, this study aims to understand individuals’ benefits of producing screencasts as a part of self-explanation processes in the context of computer skill acquisition. When producing a screencast, the creator needs to organize different pieces of information in mind and output them as dynamic screen motion with verbal descriptions. From a self-explanation standpoint, creating screencasts can be seen as learners’ external behavioral aspects of learning, which is one of the two active processes of knowledge construction [15]. This external learning activity is likely to influence learners’ internal processes of cognitive reorganization (the construction or revision of one’s mental models).
According to Wikipedia, a screenshot (or screen dump, screen capture [or screen-cap], screengrab ([or screen grab], or print screen) is an image taken by the computer user to record visible items displayed on the monitor, television, or another visual output device. Usually this is a digital image using the (host) operating system or software running on the computer, but it can also be a capture made by a camera or a device intercepting the video output of the display (such as a DVR). That latent image converted and saved to an image file such as to JPEG or PNG format is also called a screenshot.
4Http://www.screenr.com last accessed on December 12, 2013. 5Http://www.techsmith.com/camtasia.html last accessed on October
10, 2013.
6Http://www.adobe.com/products/flash.html last accessed on
October 10, 2013.
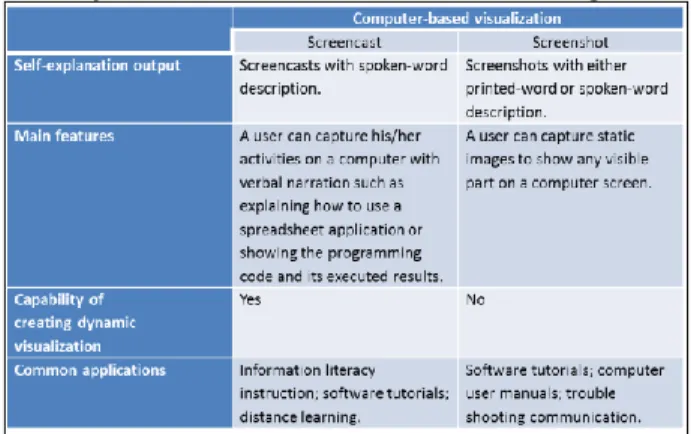
Computer screenshots can be used to demonstrate any visual part on a computer monitor. They are often used for complementing word communication (printed or spoken words). For example, the instructions of using a spreadsheet application may include many screenshots with text descriptions. One can also use screenshots to communicate with other people about a particular software problem that he or she is having on a computer. Compared to screencasts, screenshots are used in similar contexts, but the difference is they do not have the capability of making dynamic presentations. For example, when demonstrating an image slider on a web page, screenshots cannot perfectly show the image-fading effect between the image rotations, while screencasts can capture the dynamic motion of the image slider.
Similar to screencast creation, creating screenshots can be integrated into self-explanation processes. For example, a web programming learner can create some screenshots with text descriptions to self-explain how the code generates the image-fading effect in an image slider on a web page. A simple comparison of the two selected computer-based visualization technologies is shown in Table 2.
Table 2. Comparison of the selected computer-based visualization technologies
3. Method
3.1. Research question and hypotheses
Drawing on issues raised by the review of the literature, this study was conducted to answer the following research question:
“To what extent can learners in the computer skill acquisition context benefit from generating self-explanation (SE) with or without the aid of two common computer-based visualization technologies: screencasts and screenshots?”
Based on the research question, the following hypotheses were developed and tested:
Hypothesis 1 (H1): For learners engaged in acquiring a computer skill, those in a group with any type of self-explanation treatment perform better in the knowledge transfer and retention tests than those in the group without a self-explanation treatment:
H1A: SCSE 7 performs better than NOSE group
H1B: SSSE performs better than NOSE group
H1C: NVSE performs better than NOSE group.
Hypothesis 2 (H2): For learners engaged in acquiring a computer skill, differences in performance (knowledge transfer and retention tests) will exist based upon the approach of generating self-explanation:
H2A: SCSE performs better than NVSE group
H2B: SSSE performs better than NVSE group
H2C: SCSE performs better than SSSE group.
3.2. Research design
In order to observe the effects of computer-aided self-explanation, we conducted an experimental study in which the participants were asked to complete two different types of learning tasks (how and know-what) in order to learn HTML fundamentals. Each participant was randomly assigned to one of four groups in which learners were given either one of the three treatments or no treatment if they were assigned to the control group.
The research subjects were those who had no or limited prior knowledge of HTML. Sixty-two research subjects were recruited from private colleges in the Southwest. To motivate students to participate in the experimental study, a gift card with cash value of $15 was given to participants when they completed the experiment.
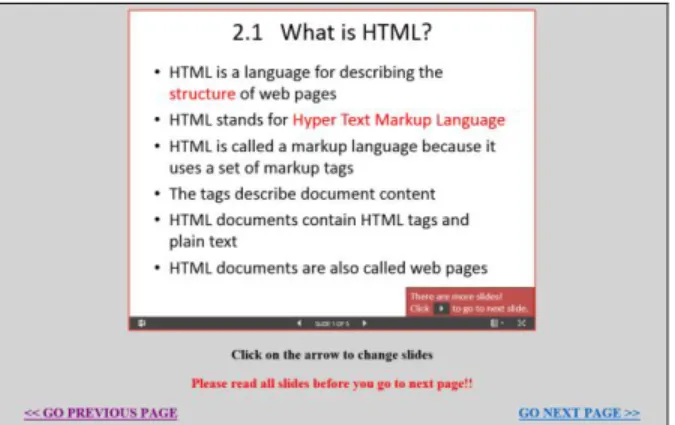
The experiment was conducted in a laboratory. One laptop computer running the Windows 7 operating system and two 19-inch monitors were set up for the experiment. On the left monitor, a virtual web browser and HTML editor were embedded in a web page. This setting allowed a subject to write HTML code and instantly test it to see how the code was displayed on a web page. On the right monitor, the learning materials were presented on web pages with navigation links as shown in Figure 2. The learning materials were created in the format of Microsoft PowerPoint slides that were stored on the cloud service, Microsoft OneDrive, and embedded in the web pages, so an internet connection was required for all experimental sessions. Depending on the experimental groups, all required software
7SCSE = Screencasting aided self-explanation.
SSSE = Screenshot aided self-explanation. NVSE = Non visualization aided self-explanation. NOSE = No self-explanation.
applications such as Screen-O-Matic, Snipping Tool and Notepad were pinned to the task bar for easier access.
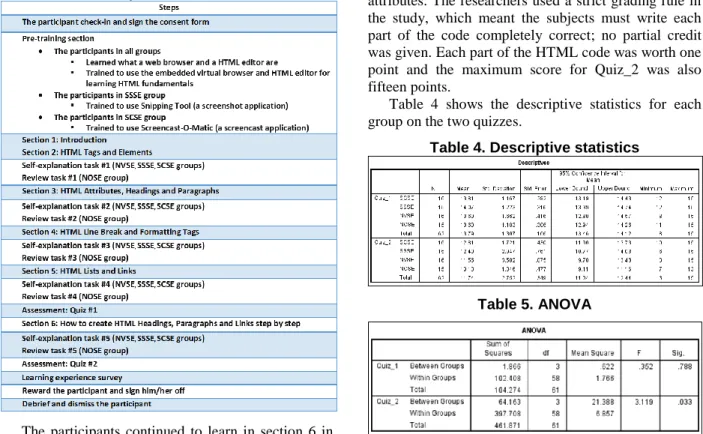
Table 3 summarizes the experimental procedure. The experimenter made an appointment with all participants to confirm the experimental schedule and set up the lab before the appointments. Each participant was scheduled for a two-hour appointment to complete the experiment.
Figure 2. Learning materials on a web page After the participants checked in and signed the consent form, the experimenter explained the experimental procedure and the computer set-up. When the participants were ready to start the experiment, they began with the Welcome page and then proceeded to a pre-training section in which they learned what a web browser and an HTML editor are and how they can be used together to learn HTML fundamentals. In addition to the aforementioned pre-training, the participants in the SSSE and SCSE groups were also trained to use the Snipping Tool (a screenshot application) and Screencast-O-Matic (a screencast application).
After the participants completed the pre-training section, they proceeded to the Introduction section, which briefly introduced all sections in the learning materials and described the learning objectives. The primary training for HTML fundamentals was from section 2 to section 6. Except for the NOSE group, which had five review tasks prompted during the training sections, the other three groups had five self-explanation tasks prompted during the training sections. Each of the three groups performed the self-explanation tasks with the aid of a different computer visualization tool or without the aid of any computer visualization tool. From section 2 to section 5, the subjects learned the Know-what knowledge (declarative knowledge) about HTML such as what HTML Elements, Attributes, and Paragraphs are, while they learned the Know-how knowledge (procedural knowledge) in section 6, which focused on how to create HTML Headings, Paragraphs and Links step by
step. After the participants completed section 5 and self-explanation task #4 (review task #4 for the NOSE group), they proceeded to the first learning assessment (Quiz_1), which consisted of fifteen multiple-choice questions.
Table 3. Experimental Procedure
The participants continued to learn in section 6 in which they were required to follow the instructions and create HTML Headings, Paragraphs and Links step by step. After completing self-explanation task #5 (review task #5 for the NOSE group), the participants were prompted to complete the second learning assessment (Quiz_2), Try It Yourself, in which they were given an HTML code template and asked to write HTML code to display an HTML page shown in the instructions. When completing the second learning assessment, the participants were directed to fill out a learning experience survey. Lastly, the participants were compensated with a $15 gift card and dismissed.
4. Data analysis and results
The dependent variables were the learning outcomes: the test scores of Quiz_1 and Quiz_2. The first quiz consisted of fifteen multiple-choice questions that were used to test the subjects’ retention about the subject matter, HTML fundamentals. Each correct answer was worth one point and the maximum score for Quiz_1 was fifteen points. The second quiz was designed to test how well the subjects apply what they
learned in the learning sessions to create a simple web page (knowledge transfer). The quiz required the subjects to write HTML code to display a web page shown in the instructions and save the code as an HTML file. The HTML code was graded in fifteen parts, each of which consisted of HTML elements or attributes. The researchers used a strict grading rule in the study, which meant the subjects must write each part of the code completely correct; no partial credit was given. Each part of the HTML code was worth one point and the maximum score for Quiz_2 was also fifteen points.
Table 4 shows the descriptive statistics for each group on the two quizzes.
Table 4. Descriptive statistics
Table 5. ANOVA
Two ANOVAs were used as preliminary tests on Quiz_1 and Quiz_2 as shown in Table 5. The ANOVA for Quiz_1 did not attain statistical significance, perhaps because performance was near the maximum possible, limiting the sensitivity of Quiz_1 for this population8. No further statistical tests were performed with Quiz_1. The ANOVA for Quiz_2 did attain statistical significance, F (3, 58) = 3.119, p = .033.
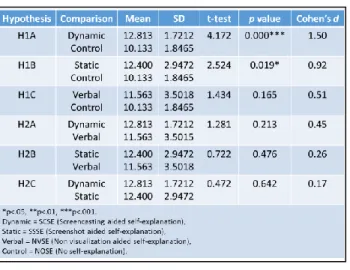
The hypotheses were tested with t-tests on the Quiz_2 scores using appropriate pair-wise comparisons. In comparison to the control condition as shown in Table 6, performance was better with dynamic visualization (d = 1.50, t = 4.17, p < .001) and static visualization (d = .92, t = 2.52, p = .019). The self-explanation condition without visualization (d = .51, t = 1.43, p = .165) did not attain statistical significance in comparison to the control condition. Thus, Hypotheses 1A and 1B were supported, though Hypothesis 1C was not.
8The percentage of the participants scored 14 or 15 on Quiz_1 is
The three self-explanation conditions did not differ significantly from each other with any pairwise comparison, although the order was as predicted. None of the hypotheses in the second set of hypotheses was supported.
While multiple t-tests were used in this study, no prior adjustments were made to the significance levels because such adjustments are quite arbitrary [38].
Table 6. t-tests and Effect Sizes
Table. 7 Subjects’ opinions about self-explanation from learning experience survey
Qualitative data collected from the learning experience surveys showed some interesting findings. Table 7 shows the subjects’ opinions about self-explanation. Responses from SCSE, SSSE and NVSE groups were coded into eighteen categories. Each response was coded into multiple categories if a respondent’s description falls into different categories.
Eighteen subjects from three SE groups described that SE prompts helped them better remember or retain new information (REM). Ten subjects thought the SE prompts helped them better understand what they learned (UND). Eleven subjects explicitly said the SE prompts were helpful for their learning (HFL). Seven subjects mentioned that the SE prompts helped them to catch parts that they did not fully understand (IKG), while seven subjects thought the SE prompts helped them solidify or reinforce their learning. As shown in Table 7, the subjects in different groups gave similar responses about how they benefited from self-explanation prompts for learning HTML, which can help explain why there were no significant differences on the two quizzes among SE groups.
5. Discussion and Limitations
Our results showed that self-explanation with the dynamic screencast and with the static screen shot both improved performance significantly with large effects of d=1.50 and 0.92, respectively. There were no statistically significant differences between the three self-explanation conditions, although performance in the three conditions was in the order predicted.
Perhaps the two quizzes were too simple to detect differences of learning outcomes among the groups. The questions were not weighted based on their levels of difficulty. Participants in this study were recruited from colleges whose students typically were at the top of their high school graduating classes. Although this study was designed for HTML beginners, many subjects answered all questions in Quiz_1 correctly, causing a ceiling effect that limited sensitivity of the test for measuring learning outcomes.
The main difference between screencasts and screenshots is the capability of creating dynamic visualization (see Table 2). The learning material did not include subject matter that allows the participants in the SCSE group to take advantage of generating self-explanations with the aid of dynamic visualization (e.g., creating animation effects on web pages).
According to the t-tests, the three SE groups combined did statistically perform better than the NOSE group. While the SCSE and SSSE group alone also statistically performed better than the NOSE group, the NVSE group did not. It is possible that the review task performed by the NOSE group allowed a learner to navigate to previous web pages and review the slides quietly. This reviewing activity could be a covert form of self-explanation to a certain extent because the subjects may organize their thoughts.
The learning materials for HTML were limited to beginner level, so the length of a learning session could be adequately managed in 90 minutes. The effects of
different self-explanation approaches may be better differentiated in a longer study or with more advanced materials. The sample size was small because of limited resources. Each participant was tested individually, so the study was time-consuming. It was unrealistic to recruit more subjects that would have allowed detection of smaller effects.
6. Conclusion
In this paper, we conducted an experimental study to determine to what extent computer skill learners can benefit from generating self-explanation with the aid of different computer-based visualization technologies. We tested two common computer-based visualization technologies, screencast and screenshot applications, and also self-explanation without visualization. The two computerized visualization technologies show promise for improving instruction with self-explanation, in that performance on a learning task was substantially and significantly better than when self-explanation was not used. The study did not detect statistical differences between the three methods of stimulating self-explanation, although the pattern of results was as predicted.
Qualitative data showed that the subjects believed that SE activities can be integrated into the context of learning computer skills and help them to better retain and understand the new information. The SE activities can also help the learners to identify their knowledge gaps, so they know how to solidify their learning.
7. References
[1] M. T. H. Chi, “Self-explaining expository texts: The dual processes of generating inferences and repairing mental models,” in Advances in Instructional Psychology, vol. 5, R. Glaser, Ed. Lawrence Erlbaum Associates, 2000, pp. 161–238.
[2] S. Ainsworth and A. T. Loizou, “The effects of self-explaining when learning with text or diagrams,” Cogn. Sci., vol. 27, no. 4, pp. 669–681, Aug. 2003. [3] R. J. Calin-Jageman and H. H. Ratner, “The Role of
Encoding in the Self-Explanation Effect,” Cogn. Instr., vol. 23, no. 4, pp. 523–543, 2005.
[4] A. Graesser and D. McNamara, “Self-Regulated Learning in Learning Environments With Pedagogical Agents That Interact in Natural Language,” Educ. Psychol., vol. 45, no. 4, pp. 234–244, Oct. 2010. [5] C. I. Johnson and R. E. Mayer, “Applying the
self-explanation principle to multimedia learning in a computer-based game-like environment,” Comput. Human Behav., vol. 26, no. 6, pp. 1246–1252, Nov. 2010.
[6] B. Rittle-Johnson, M. Saylor, and K. E. Swygert, “Learning from explaining: does it matter if mom is
listening?,” J. Exp. Child Psychol., vol. 100, no. 3, pp. 215–24, Jul. 2008.
[7] P. Pirolli and M. Recker, “Learning strategies and transfer in the domain of programming,” Cogn. Instr., vol. 12, no. 3, pp. 235–275, 1994.
[8] D. P. Larsen, A. C. Butler, and H. L. Roediger, “Comparative effects of test-enhanced learning and self-explanation on long-term retention,” Med. Educ., vol. 47, no. 7, pp. 674–682, 2013.
[9] K. L. McEldoon, K. L. Durkin, and B. Rittle-Johnson, “Is self-explanation worth the time? A comparison to additional practice,” Br. J. Educ. Psychol., vol. 83, no. 4, pp. 615–632, 2013.
[10] K. Welsh, N. Bencomo, P. Sawyer, and J. Whittle, “Self-Explanation in Adaptive Systems Based on Runtime Goal-Based Models,” in Transactions on Computational Collective Intelligence XVI, Springer Berlin Heidelberg, 2014, pp. 122–145.
[11] A. Heijltjes, T. van van Gog, J. Leppink, and F. Paas, “Unraveling the effects of critical thinking instructions, practice, and self-explanation on students’ reasoning performance,” Instr. Sci., vol. 43, no. 4, pp. 487–506, 2015.
[12] P. N. Johnson-Laird, Mental models: towards a cognitive science of language, inference and
consciousness. Cambridge, UK: Cambridge University Press, 1983.
[13] M. T. H. Chi, “Why is Self-Explaining an Effective Domain-General Learning Activity?,” in Advances in Instructional Psychology, 1997.
[14] R. E. Mayer, “Introduction to multimedia learning,” in The Cambridge handbook of multimedia learning, New York: Cambridge University Press, 2005, pp. 1– 16.
[15] P. Cobb, “Where Is the Mind? Constructivist and Sociocultural Perspectives on Mathematical Development,” Educ. Res., vol. 23, no. 7, pp. 13–20, 1994.
[16] M. T. H. Chi, M. Bassok, M. W. Lewis, P. Reimann, and R. Glaser, “Self-Explanations: How Students Study and Use Examples in Learning to Solve Problems,” Cogn. Sci., vol. 13, pp. 145–182, 1989. [17] K. Bielaczyc, P. L. Pirolli, and A. L. Brown, “Training
in Self-Explanation Strategies : Self-Regulation the Effects of Investigating Knowledge Acquisition Activities on Problem Solving,” Cogn. Instr., vol. 13, no. 2, pp. 221–252, 1995.
[18] M. T. H. Chi, N. Leeuw, M.-H. Chiu, and C. Lavancher, “Eliciting Self-Explanations Improves Understanding,” Cogn. Sci., vol. 18, no. 3, pp. 439– 477, Jul. 1994.
[19] S. Ainsworth and S. Burcham, “The impact of text coherence on learning by self-explanation,” Learn. Instr., vol. 17, no. 3, pp. 286–303, Jun. 2007. [20] D. S. McNamara, “SERT: Self-Explanation Reading
Training,” Discourse Process., vol. 38, no. 1, pp. 1–30, 2004.
[21] D. S. McNamara, “iSTART: Interactive strategy training for active reading and thinking,” Behav. Res. Methods, Instruments Comput., vol. 36, no. 2, pp. 222– 233, 2004.
[22] D. S. McNamara, T. P. O’Reilly, R. M. Best, and Y. Ozuru, “Improving adolescent students’ reading comprehension with iSTART,” J. Educ. Comput. Res., vol. 34, no. 2, pp. 147–171, 2006.
[23] A. B. H. de Bruin, R. M. J. P. Rikers, and H. G. Schmidt, “The effect of self-explanation and prediction on the development of principled understanding of chess in novices,” Contemp. Educ. Psychol., vol. 32, no. 2, pp. 188–205, Apr. 2007.
[24] K. R. Butcher, “Learning from text with diagrams: Promoting mental model development and inference generation.,” J. Educ. Psychol., vol. 98, no. 1, pp. 182– 197, 2006.
[25] R. E. Mayer and R. Moreno, “Nine ways to reduce cognitive load in multimedia learning,” Educ. Psychol., vol. 38, no. 1, pp. 43–52, 2003.
[26] R. E. Mayer, “Instruction Based on Visualizations,” in Handbook of research on learning and instruction, R. E. Mayer and P. A. Alexander, Eds. Routledge, 2011, pp. 427–445.
[27] R. E. Mayer and J. K. Gallini, “When is an illustration worth ten thousand words?,” J. Educ. Psychol., vol. 82, pp. 715–726, 1990.
[28] R. E. Mayer, “Systematic thinking fostered by illustrations in scientific text,” J. Educ. Psychol., vol. 81, pp. 240–246, 1989.
[29] R. E. Mayer, W. Bove, A. Bryman, R. Mars, and L. Tapangco, “When less is more: Meaningful learning from visual and verbal summaries of science textbook lessons,” J. Educ. Psychol., vol. 88, pp. 64–73, 1996. [30] R. Moreno and A. Valdez, “Cognitive load and
learning effects of having students organize pictures and words in multimedia environments: The role of student interactivity and feedback,” Educ. Technol. Res. Dev., vol. 53, pp. 35–45, 2005.
[31] R. E. Mayer and R. B. Anderson, “Animations need narrations: An experiment test of a dual-coding hypothesis,” J. Educ. Psychol., vol. 83, pp. 484–490, 1991.
[32] R. E. Mayer and R. B. Anderson, “The instructive animation: Helping students build connections between words and pictures in multimedia learning,” J. Educ. Psychol., vol. 84, pp. 444–452, 1992.
[33] R. Moreno and R. E. Mayer, “Cognitive principles of multimedia leaarning: The role of modality and contiguity,” J. Educ. Psychol., vol. 91, pp. 358–368, 1999.
[34] R. Moreno and R. E. Mayer, “Verbal redundancy in multimedia learning: When reading helps listening,” J. Educ. Psychol., vol. 94, pp. 156–163, 2002.
[35] A. T. Stull and R. E. Mayer, “Learning by doing versus learning by viewing: Three experimental comparisons of learner-generated versus author-provided graphic organizers.,” J. Educ. Psychol., vol. 99, no. 4, pp. 808– 820, 2007.
[36] J. Udell, “What is a screencast?,” 2005. [Online]. Available:
http://www.oreillynet.com/pub/a/oreilly/digitalmedia/2 005/11/16/what-is-screencasting.html?page=1. [37] N. Chen and M. Rabb, “A Patter Language for
Screencasting,” in Proceedings of the 16th Conference
on Pattern Languages of Programs, 2009.
[38] D. J. O’Keefe, “Colloquy: Should Familywise Alpha be Adjusted?,” Hum. Commun. Res., vol. 29, no. 3, pp. 431–447, 2003.
![Figure 1. The mechanism of self-explanation Self-explanation benefits learning in many domains and in different age range groups, from four-year-olds to adults [2][3][4][5][6][7]](https://thumb-us.123doks.com/thumbv2/123dok_us/360609.2539710/2.918.481.813.355.566/figure-mechanism-explanation-explanation-benefits-learning-domains-different.webp)