Using deep maxout neural networks to
improve the accuracy of function prediction
from protein interaction networks
Cen Wan1,2, Domenico Cozzetto1,2, Rui FaID1,2, David T. Jones1,2*
1 Bioinformatics Group, Department of Computer Science, University College London, London, United Kingdom, 2 Biomedical Data Science Laboratory, The Francis Crick Institute, London, United Kingdom
Abstract
Protein-protein interaction network data provides valuable information that infers direct links between genes and their biological roles. This information brings a fundamental hypothesis for protein function prediction that interacting proteins tend to have similar functions. With the help of recently-developed network embedding feature generation methods and deep maxout neural networks, it is possible to extract functional representations that encode direct links between protein-protein interactions information and protein function. Our novel method, STRING2GO, successfully adopts deep maxout neural networks to learn functional representations simultaneously encoding both protein-protein interactions and functional predictive information. The experimental results show that STRING2GO outperforms other protein-protein interaction network-based prediction methods and one benchmark method adopted in a recent large scale protein function prediction competition.
Introduction
The realisation of the complex relationships between genotypes and phenotypes has been fos-tering the collection and analysis of genome-wide datasets of molecular interactions detected from patterns of physical binding, transcript co-expression, mutant phenotypes, etc. Many specialised databases exist to store and integrate such heterogeneous data at different levels of biological complexity. At one end of the scale, the International Molecular Exchange (IMEx) consortium gathers non-redundant protein-protein interactions (PPIs) from peer-reviewed scientific publications, and provides manually curated details about the experimental condi-tions [1]. At the opposite end, several resources extend these primary data with indirect or pre-dicted associations to paint a more complete picture for whole organisms [2–5]. For instance, STRING [5] considers experimentally detected PPIs, conserved mRNA expression, co-mention in abstracts and papers, interactions from curated databases, conserved gene proxim-ity, gene co-occurrence/co-absence and gene fusion events. Interactions in such databases are typically assigned confidence scores, which can be used for integration purposes [2,6,7]. Not only these data provide valuable direct links between genes and their biological roles, but also form the basis for protein function prediction methods that do not rely on traditional
a1111111111 a1111111111 a1111111111 a1111111111 a1111111111 OPEN ACCESS
Citation: Wan C, Cozzetto D, Fa R, Jones DT
(2019) Using deep maxout neural networks to improve the accuracy of function prediction from protein interaction networks. PLoS ONE 14(7): e0209958.https://doi.org/10.1371/journal. pone.0209958
Editor: Alexey Porollo, Cincinnati Children’s
Hospital Medical Center, UNITED STATES
Received: December 13, 2018 Accepted: July 1, 2019
Published: July 23, 2019
Copyright:©2019 Wan et al. This is an open access article distributed under the terms of the
Creative Commons Attribution License, which
permits unrestricted use, distribution, and reproduction in any medium, provided the original author and source are credited.
Data Availability Statement: The data can be
found viahttps://github.com/psipred/STRING2GO.
Funding: C. Wan was supported by BBSRC, BB/
L002817/1; D. Cozzetto was supported by BBSRC, BB/L002817/1 and BB/L020505/1; R. Fa was supported by Elsevier; D. T. Jones was supported by BBSRC, BB/L002817/1, BB/L020505/1 and Elsevier.
Competing interests: The authors have declared
annotation transfers from sequence. Omics data have long offered a suitable opportunity by lending themselves to network representations, where genes or protein products are nodes and edges represent molecular interactions. This modelling approach can be easily exploited using the “guilt-by-association” principle: if the edges reflect biological facts reliably, adjacent nodes have more similar functions than those further away in the network—e.g. because they form a macromolecular complex, or their activities are coordinated in a specific biological process.
The earliest methods therefore transfer annotations from nodes that are either adjacent or within close distance, possibly taking into account the enrichment of the functional labels [8]. Because the network topology is far from uniform and different functions arise from unevenly sized gene sets, using one particular distance or number of neighbours inevitably affects pre-diction accuracy. More sophisticated algorithms therefore try to group the nodes into func-tional modules or communities—each associated with a given function—and then make annotation transfers within them [9–14]. The preliminary identification of functionally coher-ent subgraphs, however, poses additional challenges, which can make module-assisted predic-tors less accurate than those based on neighbour counting [15]. Alternatively, the functional annotations can be transferred via PPI parters’ homologous proteins. For example, Zhang et al. (2018) [16] proposed a method, namely PPI-homolog, to transfer the functional annota-tions of multiple homologs of the target protein’s interaction partners to make the function prediction. More recently, network propagation methods have become increasingly popular to address a wide range of problems [17]. They broadcast annotations from labelled proteins to others by running random walks, which visit the nodes in the network randomly until stop-ping criteria are met [18–20]. If the edges are weighted, this information controls the probabil-ity of traversing them; otherwise equal probabilities are used. Because the propagation is affected by node degree and edge weights, this approach reduces the chance of erroneous pre-dictions from highly multifunctional hub proteins to adjacent nodes, which perform fewer functions. Alternatively, the transition probabilities can be used to encode directly the nodes as multi-dimensional features, and thus to make functional annotations with nearest neigh-bour strategies [21,22]. Cho et al. (2016) [23] and Gligorijevićet al. (2018) [24] have instead used them to embed the STRING networks jointly—that is to map nodes to continuous fea-tures, which best explain the transition probabilities and the graph topology. The usefulness of the resulting features has been demonstrated for the task of protein function prediction.
This study proposed a novel PPI network-based protein function predicting method, STRING2GO. It adopts deep maxout neural networks to learn a novel type of functional bio-logical network feature representations simultaneously encapsulating both node neighbor-hoods and co-occurrence functions information. These higher-level representations are learnt in a supervised way by training deep maxout neural networks to output all the terms in biolog-ical process domain associated with an input protein—an approach that has led to higher predictive accuracy in the past [25,26]. The experimental results show that STRING2GO significantly outperforms other PPI network embedding-based protein function prediction methods.
Materials and methods
Data collection
Firstly, human proteins were retrieved from the UniProtKB/SwissProt release 2017_05 [27], while the corresponding protein-protein interactions information was retrieved from STRING v10.0 [28] that includes seven component networks from heterogeneous data sources and one
integrated network. The mapping between UniProtKB/SwissProt accession numbers and Ensembl protein identifiers adopted in STRING was obtained by using the Biomart tool [29].
Experimentally supported Gene Ontology (GO) term annotations—identified with evi-dence code EXP, IDA, IPI, IMP, IGI or IEP—were collated from the UniProtKB/SwissProt release 2017_05 and UniProt-GOA release 168 [30], and propagated over “is a” relationships in the Gene Ontology database [31]—GO OBO file release 2017-04-28. To assure the feasibility of the following machine-learning experiments, only biological process (BP) annotating at least 100 proteins were initially considered. To guarantee that the predictions are sufficiently specific and informative, this list was subsequently filtered so that only the deepest terms in the ontology were retained—i.e. the terms a and b were kept if and only if there are no “is_a” paths from a to b and from b to a. These steps yielded a vocabulary consisting of 204 BP terms (detailed information is included inS1 Table).
The set of human proteins was split into a large subset for GO term-specific classifier train-ing and a small subset for hold-out evaluation. 10,667 proteins with at least one cellular com-ponent term were initially selected from the whole set. Out of these, 1,000 proteins were randomly selected for hold-out evaluation from the subset of well-annotated entries—i.e. those with at least 28, 5 and 14 experimental or electronic biological process, molecular func-tion and cellular component terms respectively. After removing electronic annotafunc-tions, the hold-out set for BP terms contains 982 proteins, while the large set contains 5,000 proteins. We also create a separated protein-set for a temporal validation by selecting 428 proteins who had no experimental annotation by any 204 BP terms but received at least one after 6 months. The source files were collected from UniProtKB/SwissProt release 2017_11, UniProt-GOA release 174 and GO OBO file 2017-10-30. In order to further evaluate the performance of our methods on predicting homology-independent proteins, we further removed the homologous proteins in the hold-out and temporal validation protein-sets respectively by using BLAST searches against the training protein-set with different E-value thresholds, i.e. 10−5, 10−4, 10−3 and 10−2, leading to different degrees of homolog-removal subsets of the original hold-out and temporal validation protein-sets. The higher value of the E-value threshold denotes the wider definition of protein homology, leading to a more stringent condition on the evaluation of the homology-independent prediction. The hold-out protein-sets with different E-value thresh-olds range from 255 to 192 proteins, while the temporal validation protein-sets with different E-value thresholds range from 198 to 182 proteins. The detailed information is included in the
S2 Table.
Predictive performance evaluation
Predictive performance was evaluated on the ability to annotate both individual labels (GO term-centric) and protein function (protein-centric), following the methodology adopted in [32]. For the GO term-centric evaluation, we calculate the F1, Matthews Correlation
Coeffi-cient (MCC), and Area Under Precision Recall Curve (AUPRC) scores for evaluating the pre-dictive performance of the GO term-specific classifier on the hold-out protein-set. In details, the GO term-centric F1(i.e. F1_GO) score is used for evaluating the performance of methods
when predicting protein annotations for individual GO terms. As shown inEq 1, the F1score
is obtained by calculating the harmonic mean of precision and recall values. The precision value (Eq 2) is calculated by dividing the number of true positive (TP) predictions over the summation of true positive and false positive (FP) predictions, while the recall value (Eq 3) is calculated by dividing the number of true positive (TP) predictions over the summation of true positive and false negative (FN) predictions. The MCC score that is calculated byEq 4
proportion of binary class labels is highly imbalanced. Analogously, the AUPRC score is also a well-known metric for evaluating the performance of prediction methods on imbalanced class prediction tasks. F1 ¼2� Precision�Recall PrecisionþRecall ð1Þ Precision¼ TP TPþFP ð2Þ Recall¼ TP TPþFN ð3Þ MCC¼ ffiffiffiffiffiffiffiffiffiffiffiffiffiffiffiffiffiffiffiffiffiffiffiffiffiffiffiffiffiffiffiffiffiffiffiffiffiffiffiffiffiffiffiffiffiffiffiffiffiffiffiffiffiffiffiffiffiffiffiffiffiffiffiffiffiffiffiffiffiffiffiffiffiffiffiffiffiffiffiffiffiffiffiffiffiffiTP�TN FP�FN ðTPþFPÞðTPþFNÞðTNþFPÞðTNþFNÞ p ð4Þ
For the protein-centric evaluation, we calculate the Fmaxscore by predicting the GO term
annotations for the hold-out and different degrees of homolog-removal hold-out evaluation using the trained GO term-specific classifiers. The Fmaxscore is used by CAFA experiments
[32] for evaluating the performance of methods when predicting GO term annotations for all protein samples. As shown inEq 5, the Fmaxscore is obtained by choosing the maximum
aver-aged F1score over all protein samples’ GO term annotation prediction, according to the varied
decision threshold. The averaged F1score for thresholdτis calculated by the averaged
preci-sionPrecisiont(Eq 6) and recallRecallt(Eq 7) values. ThePrecisiontvalue is calculated by
the total amount of precision values for the GO term annotation predictions of all protein sequencesS, over the number of protein sequencemwith at least one GO term annotation pre-dictive posterior probability being equal or greater than the value of thresholdτ. Analogously,
theRecalltvalue is calculated by the total amount of recall values for the GO term annotation
predictions of all protein sequencesS, over the total number of protein sequencesn. Then the correspondingτto Fmaxscore is used as the prior knowledge to calculate the other type of
protein-centric averaged F1score, i.e. Fτ, for the temporal and different degrees of
homolog-removal temporal validation. Note that we mainly discuss the Fmaxand Fτscores obtained
by the homolog-removal protein-sets generated by applying the E-value threshold of 10−2, whereas the results for all other different degrees of homolog-removal protein-sets are also reported in theS3andS4Tables.
Fmax¼maxtf2� Precisiont�Recallt PrecisiontþRecallt g ð5Þ Precisiont ¼ 1 m X s TPs;t TPs;tþFPs;t ð6Þ Recallt ¼ 1 n X s TPs;t TPs;tþFNs;t ð7Þ
STRING2GO—A novel protein function prediction method based on
learning representations simultaneously encoding the protein-protein
interaction and functional annotation information
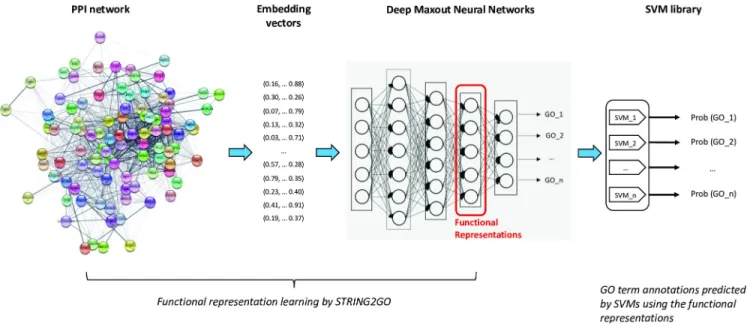
In general, the STRING2GO method is composed of a three-stage machine learning proce-dure. As shown in the flow-chart ofFig 1, at the first stage, it adopts the network embedding representation generation methods (e.g. Mashup and Node2vec discussed in this work) to generate the vector representations for individual proteins based on the protein-protein inter-action network. Then the Deep Maxout Neural Networks (DMNNs) feed-forward those gener-ated representations as the inputs to a set of GO term annotations of individual proteins as the outputs. The new type of functional representations (denoted as STRING2GOEmbedding) that
simultaneously encode the PPI and protein functional annotation information are extracted from the outputs of the 3rdhidden layer of DMNNs after finishing the backward propagation optimisation. Finally, STRING2GO trains a library of Support Vector Machines (SVMs) to predict the posterior probability of annotating individual GO terms to the target proteins. Here, we denote this type of STRING2GO method as STRING2GOEmbedding+SVMfor clarity.
In addition, due to the natural functionality of DMNNs, we also propose another type of STRING2GO method, denoted as STRING2GOEmbedding+Sigmoid, which directly adopts the
sig-moid function in the last layer of DMNNs to make predictions.
In this work, we evaluate the predictive performance of our two types of STRING2GO method on predicting the BP terms located in the deep positions in the GO-DAG, benchmark-ing with the conventional raw network embeddbenchmark-ing representations-based method, i.e. Embed-ding+SVM, that merely adopts the raw network embedding representations to train the SVMs for making predictions.
Network embedding representation generation
In this work, we adopt two types of network embedding representation generation methods, i.e. Mashup [23] and Node2vec [33], to derive representations from STRING networks. Mashup firstly evaluates the diffusion states of nodes in the network by random walks with a
Fig 1. Flow-chart of STRING2GO-based protein function prediction method. https://doi.org/10.1371/journal.pone.0209958.g001
restart approach. Then the truncated singular value decomposition is applied to the diffusion state matrix in order to learn a lower dimensional representation space that optimally approxi-mates the original diffusion states information. The usefulness of the resulting network embedding representations has been demonstrated for a range of functional classification tasks, including function and genetic interaction prediction. As suggested, the best-performing Mashup-derived representations are 800 dimensional and generated by the random-walk sam-pling strategy with the restart probability of 0.5.
Analogously, Node2vec firstly obtains the node neighborhood information by truncated random walks. Then a Skip-gram [34,35] shallow neural network is used to generate a repre-sentation space, where the nodes contain the maximum likelihood of preserving correspond-ing node neighborhood information. In this work, the neighborhood information was sampled through random walks of length ten, which were biased towards close neighbors by setting the parameterqto 2. We also evaluate the performance of representations in differ-ent dimensions, i.e. 32, 64, 128, 256 and 512, generated from all differdiffer-ent STRING networks [21,22].
Deep maxout neural networks training
Deep Maxout Neural Networks (DMNNs) are used for learning the more abstract representa-tions simultaneously encoding the PPI network information and the patterns of term co-occurrence in the biological process functional domain. The network architecture was imple-mented using the Keras package with Theano backend and consisted of three fully connected hidden layers, followed by an output layer with as many neurons as the numbers of terms selected for the biological process functional domain. Each hidden layer had batch-normalized inputs [36], which were combined through maxout units [37], and were subject to dropout [38] in the course of training. A sigmoid function was used to activate the output neurons.
To limit the computational requirements for model optimization, the initial 10-fold cross validation (with random split of instances) experiments were run in order to identify the best combination of optimizer (AdaGrad), number of maxout units (3), learning rate (0.05), batch size (100 elements), and number of epochs (150), keeping fixed the weight initialisation (Glorot uniform method) and the number of units in all hidden layers, by considering the highest F1_GOscores for predicting all 204 BP terms. Subsequent training stages were aimed at
selecting the optimal dimensions of hidden layers that lead to the highest median F1_GOscores
(here rounded to two decimal places), from a limited set of options (300, 500, 700 and 1,000). In addition, we also evaluate the predictive performance when using the same dimensions for both input features and the 3rdhidden layer outputs. Note that, due to the well-known curse of dimensionality issue [39], if more than two different dimensions of the 3rdhidden layer out-puts obtain the same median F1_GOscores, we only choose the lowest ones as the optimal
dimensions.
Support vector machine training
Scikit-learn [40] was used to train a set of GO term-specific Support Vector Machines (SVMs) with a radial basis function (RBF) kernel, the parameters of which were identified through a grid search as those maximising the F1_GOscore across the stratified 10-fold cross validation
experiments. To train each classifier, the set of positive instances consisted of the proteins annotated with the target GO termtor its descendants, while the set of negative instances are all remaining proteins not annotated with the target GO term or its descendants. Finally, the well-known Platt scaling method [41] was used to transform the predictive scores of individual
SVMs into a probability distribution of binary classes. The data and code can be accessed via
https://github.com/psipred/STRING2GO.
Results
We firstly report the experimental results about evaluating the predictive information included in different STRING networks that are used for generating the raw network embedding repre-sentations by two different methods, i.e. Mashup and Node2vec. Then we evaluate the predic-tive performance of the STRING2GO-learnt functional representation (i.e. STRING2GOMashup
and STRING2GONode2vec) by comparing with their corresponding raw network embedding
representations. We also compare the performance of Mashup and Node2vec methods when they are used to generate the raw network embedding representations or be the component methods of STRING2GO to learn the functional representations. Finally, we further compare all prediction methods involved in this work, also comparing with the PPI-homolog [16] and Naïve methods [32].
Predictive power included in different STRING networks
To begin with, we compare the predictive power of different STRING networks by adopting the Mashup or Node2vec-generated network embedding representations as the inputs of DMNNs for predicting protein function (i.e. STRING2GOMashup+Sigmoidand
STRING2-GONode2vec+Sigmoid). Overall, the Combinedscore network-derived embedding
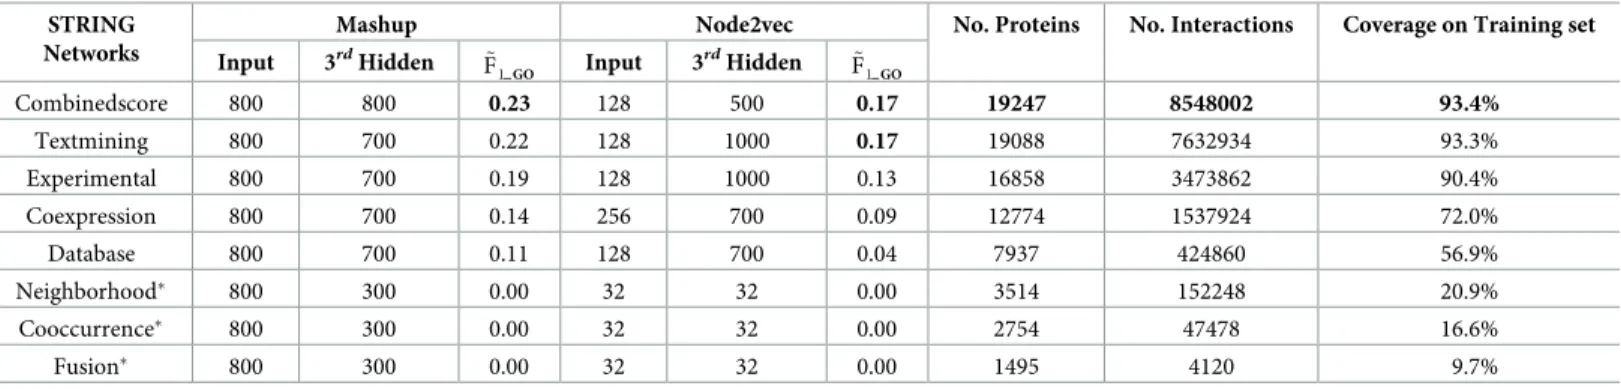
representa-tions show the best predictive performance among all different STRING networks-derived ones when using either Mashup or Node2vec methods, while the Textmining network-derived representations also obtain the competitive predictive accuracy. As shown in the 4th and 7thcolumns ofTable 1, the Combinedscore network-derived representations obtain the highest median F1_GO(hereafter, denoted by~F1GO) scores (0.23 and 0.17) using Mashup
and Node2vec respectively. The Combinedscore network also contains the largest number of proteins, interactions and the highest coverage (as shown in the columns 8-10 ofTable 1), when mapping the STRING network-included proteins to the training protein-set. The Textmining network-derived representations obtain the second highestF~1GOscore (0.22)
using the Mashup method, while also obtain the same highestF~1GOscore (0.17) using the
Node2vec method. Moreover, in terms of the predictive information included in other com-ponent networks, the Experimental network-derived embedding representations show the
Table 1. The optimal dimensions of raw network embedding representations and the corresponding 3rdhidden layer outputs (a.k.a. the STRING2GO-learnt func-tional representations) with their corresponding predictive power for biological process terms prediction, and the main characteristics of different STRING networks.
STRING Networks
Mashup Node2vec No. Proteins No. Interactions Coverage on Training set
Input 3rdHidden ~F 1GO Input 3 rdHidden ~ F1GO Combinedscore 800 800 0.23 128 500 0.17 19247 8548002 93.4% Textmining 800 700 0.22 128 1000 0.17 19088 7632934 93.3% Experimental 800 700 0.19 128 1000 0.13 16858 3473862 90.4% Coexpression 800 700 0.14 256 700 0.09 12774 1537924 72.0% Database 800 700 0.11 128 700 0.04 7937 424860 56.9% Neighborhood� 800 300 0.00 32 32 0.00 3514 152248 20.9% Cooccurrence� 800 300 0.00 32 32 0.00 2754 47478 16.6% Fusion� 800 300 0.00 32 32 0.00 1495 4120 9.7%
�: Note that those STRING networks obtain 0.00 of~F
1GOscores with all different dimensions, only the lowest dimensions are reported.
third highest predictive accuracy, since they obtain sequentially higher~F1 GOscores than
the ones derived by the Database and Coexpression networks respectively. Note that, the embedding representations derived from Neighbourhood, Cooccurrence and Fusion net-works show poor predictive performance, since theirF~1GOscores are all equal to zero, and
the mapping coverages are all lower than 21.0%. Hereafter, we consider learning the func-tional representations by STRING2GO only from those 5 networks including relatively rich PPI information and high coverage.
We then report the optimal dimensions of network embedding representations derived by Mashup and Node2vec methods from those 5 STRING networks. According to the suggestion in [23], we define 800 as the optimal dimensions for the input network embedding tions derived by Mashup. In terms of the Node2vec-derived network embedding representa-tions, as shown in the 5thcolumn ofTable 1, 128 are the overall optimal dimensions, since 4 out of 5 network-derived embedding representations in 128 dimensions obtain the highest ~
F1GOscores for predicting 204 biological process terms. We then report the optimal
dimen-sions of the STRING2GO-learnt functional representations (a.k.a. the 3rdhidden layer outputs of DMNNs) w.r.t. the corresponding optimal dimensions of raw network embedding repre-sentation inputs. Generally, STRING2GO encodes the functional predictive information in a high dimensional representation space (ranging from 500–1000 dimensions), when using either Mashup or Node2vec as the raw network embedding representation generation method. As shown in the 3rdand 6thcolumns ofTable 1, the optimal dimensions of the 3rdhidden layer outputs vary between 500 to 1000. Recall that we also evaluate the cases when the dimensions of the 3rdhidden layer outputs are the same to the dimensions of raw network embedding representation inputs. None of the functional representations based on Node2vec-derived net-work embedding representations obtain higherF~1GOscores when using the same dimensions
of inputs as the dimensions of 3rdhidden layer outputs, e.g. using 128 as the dimensions of both representation inputs and the 3rdhidden layer outputs.
The functional representations learnt by STRING2GO encode higher
predictive power than the corresponding raw network embedding
representations
We evaluate the predictive performance of STRING2GO-learnt functional representations by conducting pairwise comparisons with the corresponding raw network embedding representa-tions respectively. Generally, in terms of GO term and protein-centric metrics, both STRING2-GOMashupand STRING2GONode2vecfunctional representations obtain higher predictive
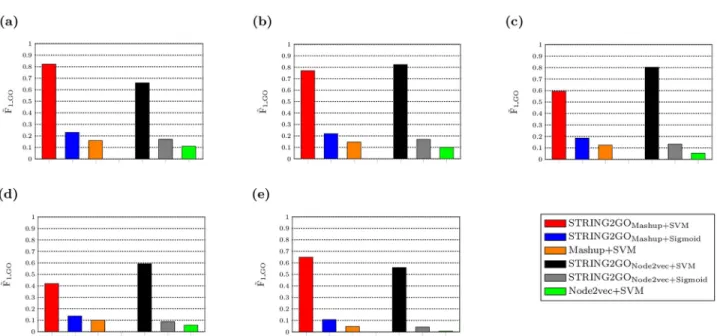
accuracy than Mashup and Node2vec-derived raw network embedding representations. In detail, during the GO term-specific classifier training stage, as shown inFig 2a–2e, both orange and green bars are lower than other ones. This fact indicates better classifier training quality by using STRING2GOMashup+SVM, STRING2GONode2vec+SVM, STRING2GOMashup+Sigmoidand
STRING2GONode2vec+Sigmoidthan the ones obtained by Mashup+SVM and Node2vec+SVM,
when using all five different STRING networks to generate embedding representations. The hold-out evaluation results further confirm that the STRING2GO-learnt functional representations contain higher predictive information. As shown inTable 2, the~F1GOscores
obtained by STRING2GOMashup+SVMand STRING2GONode2vec+SVMreach to 0.270 and 0.182
respectively, whereas theF~1GOscores obtained by Mashup+SVM and Node2vec+SVM are
both equal to 0.000. Analogously, theMCC~ GOscores obtained by STRING2GOMashup+SVM
and STRING2GONode2vec+SVMreach 0.277 and 0.215 respectively. Both of them are higher
consistent when adopting all other types of STRING component networks, except STRING2-GONode2vec+SVMand Node2vec+SVM both obtain zero~F1GOandMCC~ GOscores when using
the Coexpression network to generate the raw embedding representations (as shown in
Table 2). In addition, both STRING2GOMashup+SVMand STRING2GONode2vec+SVMobtained
higherAUPRC~ GOscores than Mashup+SVM and Node2vec+SVM methods based on all five
different STRING networks. STRING2GOMashup+Sigmoidand STRING2GONode2vec+Sigmoid
also respectively obtain higher~F1GO,MCC~ GOandAUPRC~ GOscores than Mashup+SVM and
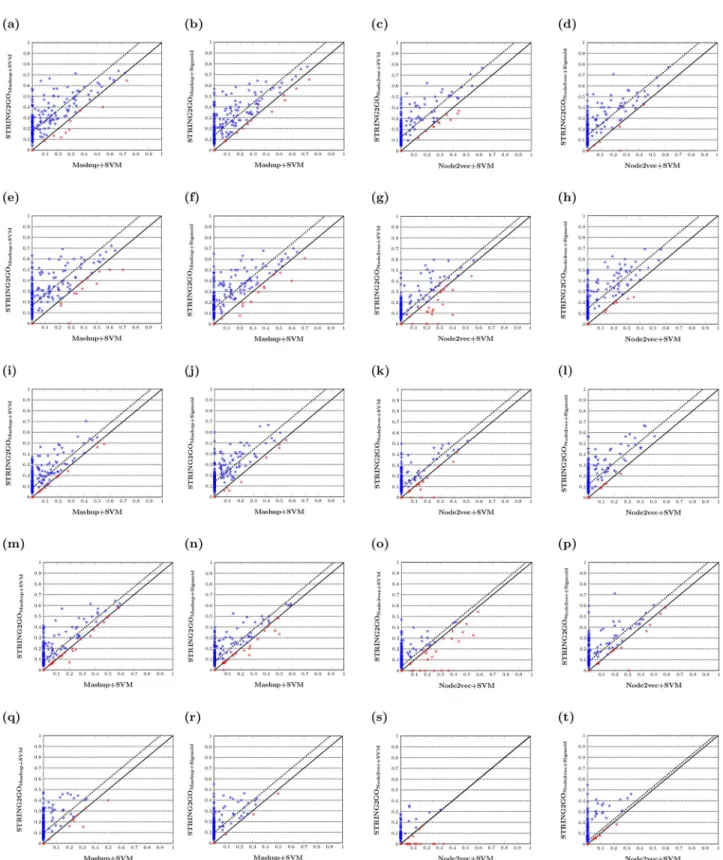
Node2vec+SVM based on all five different STRING networks. The scatter-plots inFig 3show the pairwise comparisons of F1_GOscores obtained by different methods, and the dashed-lines
indicate the median values of difference between pairs of F1_GOscores. In detail,Fig 3a–3d
show that almost all dots (in blue) drop in the area above the diagonal, indicating higher F1_GO
scores for predicting the majority of BP terms by using the functional representations learnt by STRING2GO based on the Combinedscore network by using either SVM or Sigmoid function as the classification algorithm. As shown inFig 3e–3t, this pattern is consistently observed when applying on almost all other four different STRING networks, except the Coexpression network that leads to competitive performance between STRING2GONode2vecand Node2vec,
since the dashed-lines inFig 3s and 3tare almost overlapping on the diagonal. The Wilcoxon signed-rank test results inS5–S7Tables further confirm that the STRING2GO-learnt func-tional representations obtain significantly higher GO term-centric F1_GO, MCCGOand
AUPRCGOscores than the raw network embedding representations.
From the perspective of protein-centric evaluation (i.e. considering the Fmaxand Fτ
metrics), the STRING2GO-learnt functional representations also obtain higher predictive accuracy based on the Combinedscore network. As shown inTable 3, the functional represen-tations STRING2GOMashupand STRING2GONode2vecboth obtain higher Fmaxscores (i.e. 0.497
and 0.458 obtained by using SVM, 0.495 and 0.471 obtained by using Sigmoid function) than the network embedding representations generated by Mashup and Node2vec (i.e. 0.470 and
Fig 2.F~
1GOscores obtained by network embedding representations and the corresponding STRING2GO-learnt functional representations based on (a) Combinedscore, (b) Textmining, (c) Experimental, (d) Database and (e) Coexpression networks by using SVM or Sigmoid function over the 10-fold cross validation during the GO term-specific classifiers training stage.
Table 2. Summary of GO term-centr ic results obtained by different network embeddin g representa tions and correspond ing functional representa tions based on Combineds core, Textmini ng, Experime ntal, Database and Coexpres sion networks working with different classification algorithm s during hold-out evaluation. Prediction Methods Combinedsco re Textminin g Experimen tal Databa se Coexpre ssion ~F1 GO ~ MCC GO ~ AUPRC GO ~F1 GO ~ MCC GO ~ AUPRC GO ~F1 GO ~ MCC GO ~ AUPRC GO ~F1 GO ~ MCC GO ~ AUPRC GO ~F1 GO ~ MCC GO ~ AUPRC GO Mashup-based STRING2GO Mashup+SVM 0.270 0.277 0.226 0.275 0.263 0.210 0.146 0.174 0.157 0.130 0.161 0.127 0.116 0.142 0.106 STRING2GO Mashup+Sigmoid 0.237 0.261 0.232 0.239 0.273 0.235 0.183 0.223 0.199 0.131 0.164 0.153 0.121 0.159 0.116 Mashup+SV M 0.000 0.000 0.200 0.000 0.000 0.206 0.000 0.000 0.153 0.000 0.000 0.121 0.000 0.000 0.093 Node2vec-based STRING2GO Node2ve+SVM 0.182 0.215 0.190 0.115 0.169 0.191 0.124 0.174 0.160 0.087 0.135 0.129 0.000 0.000 0.084 STRING2GO Node2vec+Sigmoid 0.187 0.241 0.229 0.188 0.237 0.228 0.143 0.196 0.182 0.111 0.168 0.151 0.043 0.069 0.099 Node2vec+S VM 0.000 0.000 0.175 0.000 0.000 0.182 0.000 0.000 0.156 0.000 0.000 0.100 0.000 0.000 0.077 https://do i.org/10.1371/j ournal.pone .0209958.t002
Fig 3. F1_GOscores obtained by different network embedding representations and the corresponding STRING2GO-learnt functional
representations based on (a-d) Combinedscore, (e-h) Textmining, (i-l) Experimental, (m-p) Database and (q-t) Coexpression networks by using SVM or Sigmoid function for classification.
Table 3. Summary of protein-centric results obtained by different network embeddin g representatio ns and correspo nding functional representa tions based on Combineds core, Textmini ng, Experimenta l, Database and Coexpres sion networks workin g with different classification algorithm s during hold-out (Full) and homolog-removal (HR) hold-out evaluation , tempora l (Full) and homolog -removal (HR) temporal validation. Prediction Methods Combined score Textm ining Experimen tal Database Coexpress ion Fmax Fτ Fmax Fτ Fmax Fτ Fmax Fτ Fmax Fτ Full HR Full HR Full HR Full HR Full HR Full HR Full HR Full HR Full HR Full HR Mashup-based STRING2GO Mashup+SVM 0.497 0.454 0.309 0.273 0.483 0.425 0.296 0.237 0.450 0.412 0.263 0.199 0.412 0.380 0.225 0.099 0.392 0.334 0.258 0.186 STRING2GO Mashup+Sigmoid 0.495 0.464 0.312 0.271 0.478 0.426 0.290 0.237 0.442 0.410 0.247 0.193 0.427 0.409 0.144 0.146 0.392 0.334 0.247 0.189 Mashup+SV M 0.470 0.427 0.290 0.249 0.463 0.411 0.287 0.231 0.420 0.358 0.229 0.166 0.392 0.373 0.238 0.186 0.371 0.336 0.242 0.199 Node2vec-based STRING2GO Node2ve+SVM 0.458 0.423 0.319 0.280 0.446 0.398 0.290 0.288 0.422 0.370 0.256 0.215 0.353 0.351 0.169 0.194 0.349 0.307 0.236 0.216 STRING2GO Node2vec+Sigmoid 0.471 0.410 0.312 0.284 0.472 0.428 0.314 0.298 0.440 0.397 0.258 0.224 0.408 0.403 0.238 0.193 0.381 0.356 0.246 0.232 Node2vec+S VM 0.444 0.394 0.293 0.284 0.437 0.401 0.278 0.260 0.418 0.382 0.249 0.219 0.386 0.373 0.221 0.184 0.360 0.313 0.219 0.187 Benchmark Na ï ve 0.363 0.342 0.254 0.223 PPI-homo log 0.429 N/A � 0.363 N/A � �N/A: the results for the homolog-free hold-out and temporal validation protein-sets are not applicable since PPI-homolog method uses the homologo us informa tion to make predictions . https://doi. org/10.1371/j ournal.pone .0209958.t003
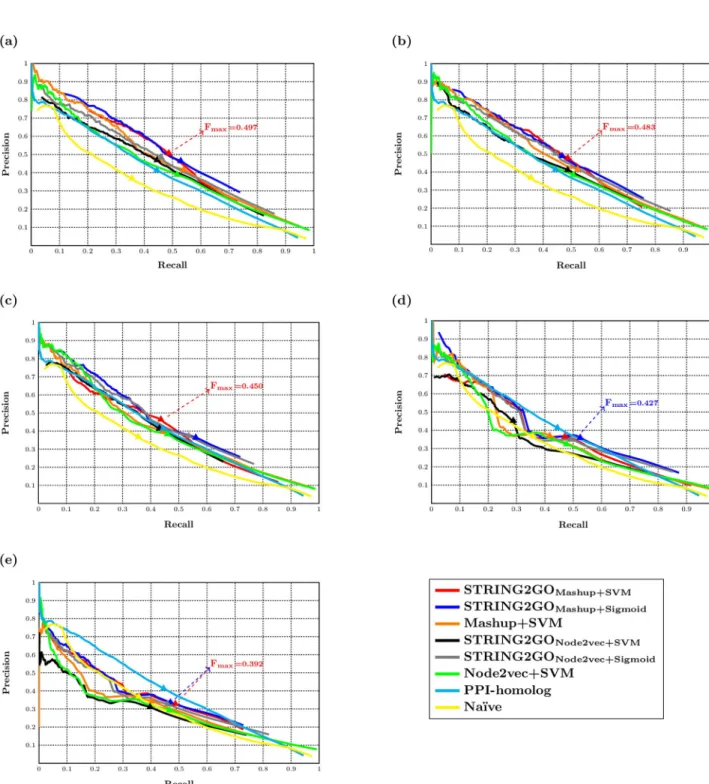
0.444 obtained by using SVM). The precision-recall curves inFig 4aalso show that the STRING2GO-learnt functional representations obtain higher precision and recall values simultaneously, since the middle parts of red and blue curves locate in higher position than the orange one, while the middle parts of grey and black curves also locate in higher position than the green one. As shown inTable 3andFig 4b–4e, this pattern is consistent when adopt-ing the other four types of STRING component networks to generate representations, except
Fig 4. Precision-recall curves of different methods and the Fmaxscores obtained by the best-performing methods based on (a) Combinedscore, (b)
Textmining, (c) Experimental, (d) Database and (e) Coexpression networks. https://doi.org/10.1371/journal.pone.0209958.g004
STRING2GONode2vec+SVMobtaining lower Fmaxscores than Node2vec+SVM based on the
Database and Coexpression networks. In terms of the predictive performance on the homo-log-removal hold-out sets with the E-value threshold of 10−2, STRING2GOMashup+SVMand
STRING2GOMashup+Sigmoidboth obtain higher Fmaxscores than Mashup+SVM over all
STRING networks except the Coexpression network, while STRING2GONode2vec+Sigmoidalso
outperforms Node2vec+SVM over five STRING networks and STRING2GONode2vec+SVM
obtains higher Fmaxscore than Node2vec+SVM based on the Combinedscore network. In
addition, all methods also obtain similar Fmaxscores over the evaluations on different degrees
of homolog-removal hold-out sets, as reported in theS3 Table.
Analogously, the functional representations STRING2GOMashupand STRING2GONode2vec
obtain higher Fτscores based on the Combinedscroe network (0.309 and 0.319 obtained by
SVM, while 0.312 obtained by Sigmoid function) than the raw network embedding representa-tions generated by Mashup and Node2vec (0.290 and 0.293 by using SVM). This pattern is consistent when using all other STRING networks, except the Database network which only leads to higher Fτscore obtained by STRING2GONode2vec+Sigmoidthan the one obtained by
Node2vec+SVM. In terms of the predictive performance on the homolog-removal temporal validation protein-sets with an E-value threshold of 10−2, STRING2GOMashup+SVMand
STRING2GOMashup+Sigmoidoutperform Mashup+SVM based on the Combinedscore,
Text-mining and Experimental networks. Analogously, STRING2GONode2vec+Sigmoidobtains the
same Fτscore to the Node2vec+SVM method based on the Combinedscore network and
higher Fτscores over all other four STRING networks. STRING2GONode2vec+SVMalso
outper-forms Node2vec+SVM based on the Textmining, Database and Coexpression networks. The results obtained by all methods over the evaluations of different degrees of homolog-removal temporal validation sets are also similar.
The raw network embedding representations derived by Mashup show
higher predictive power
We also compare the predictive performance of Mashup and Node2vec-derived network embedding representations and the corresponding STRING2GO-learnt functional representa-tions respectively. Generally, the raw network embedding representarepresenta-tions derived by Mashup and Node2vec methods obtain competitive predictive accuracy by using SVM as the classifica-tion algorithm. To begin with, during the training stage, theF~1GOscore obtained by Mashup
+SVM is higher than the one obtained by Node2vec+SVM based on the Combinedscore net-work, since the orange bar is higher than the green one inFig 2a. However, both Mashup +SVM and Node2vec+SVM obtain poor predictive performance on the hold-out evaluation, due to the zeroF~1GOandMCC~ GOscores. But the statistical significance test results (seeS5
andS6Tables) show that the former still outperforms the latter. Those patterns are consistent when using all other 4 types of STRING networks to generate the raw embedding representa-tions, except the fact that there is no significant difference on the MCCGOscores obtained by
the above two methods based on the Coexpression network, as reported inFig 2b–2e,Table 2,
S5andS6Tables. The Mashup+SVM method also obtains higherAUPRC~ GOscores and
signifi-cantly higher AUPRCGOscores over all 204 terms than Node2vec+SVM method based on four
STRING networks, as reported inTable 2andS7 Table. In terms of the protein-centric evalua-tion, Mashup+SVM obtains a higher Fmaxscore (0.470) than Node2vec+SVM (0.444). The
Combinedscore network-based precision-recall curves inFig 4aconfirm that the orange curve locates in higher position than the green one. Those patterns are also consistent in cases when using other four different STRING component networks to generate representations, as shown inFig 4b–4e. Mashup+SVM also obtains higher Fmaxscores on the homolog-removal
hold-out protein-sets based on the Combinedscore, Textmining and Coexpression networks. However, Node2vec+SVM outperforms Mashup+SVM on the temporal validation. As reported inTable 3, although the latter obtains higher Fτscore based on three STRING
com-ponent networks (i.e. Textmining, Database and Coexpression), the former obtains the highest Fτscore (0.293) based on the Combinedscore network. Node2vec+SVM also obtains higher Fτ
scores than Mashup+SVM on the homolog-removal temporal validation protein-sets based on the Combinedscore, Textmining and Experimental networks.
We then further conduct comparisons on predictive performance of two different
STRING2GO-learnt functional representations respectively based on Mashup and Node2vec-derived raw network embedding representations. During the GO term-specific classifiers training stage, STRING2GOMashupobtains higherF~1GOscores than STRING2GONode2vec
by using either SVM or Sigmoid function as the classification algorithm, based on the Combi-nedscore and Coexpression networks. As shown inFig 2a and 2e, where red and blue bars are higher than the black and grey ones respectively. When using the other 3 STRING compo-nent networks, STRING2GONode2vecobtains higherF1~GOscores by using SVMs, whereas
STRING2GOMashupstill outperforms the former by using Sigmoid function as the
classifica-tion algorithm.
The hold-out evaluation results in Tables2and3show a consistent pattern that
STRING2GOMashupobtains higherF~1GO,MCC~ GOandAUPRC~ GOscores (statistically
signifi-cant according toS5,S6andS7Tables) and Fmaxscores than STRING2GONode2vecbased
on the Combinedscore network by using either SVM or Sigmoid function, respectively. As shown inFig 4a, the majority parts of the red and blue curves clearly locate in higher position than the black and grey ones. Those patterns are consistent when using the other 4 STRING networks, as shown inTable 3andFig 4b–4e. Analogously, STRING2GOMashupalso obtains
higher Fmaxscores than STRING2GONode2vecon the homolog-removal hold-out sets based
on the Combinedscore, Experimental and Database networks by using either SVM or Sig-moid function, respectively. However, STRING2GONode2vecobtains better predictive
perfor-mance during the temporal annotation validation, since the former obtains the highest Fτ
score (0.319) by using SVM (based on the Combinedscore network) among all methods when adopting all different STRING networks. STRING2GONode2vecalso obtains the overall
highest Fτscore (0.298) on the homolog-removal temporal validation based on the
Textmin-ing network.
The STRING2GO-learnt functional representations with support vector
machines obtain the highest accuracy on predicting 204 BP terms
We then compare all prediction methods discussed in previous sections, i.e. two types of STRING2GO methods (i.e. STRING2GOEmbedding+SVMand STRING2GOEmbedding+Sigmoid)
adopting two types of raw network embedding representations (i.e. the ones generated by Mashup and Node2vec respectively), and the methods that only exploit the raw network embedding representations to make predictions by using SVM as the classification algorithm. We also compare those methods with the PPI-homolog [16] and Naïve prediction method [32]. The former makes predictions of target proteins’ GO term annotations by transferring corresponding annotations of PPI partners’ homologs defined by the BLAST search. The latter makes predictions by considering the annotation frequency in the database as the prior knowl-edge. Overall, STRING2GOEmbedding+SVMis the best-performing method according to both
the GO term and protein-centric metrics. During the GO term-specific classifiers training stage, STRING2GOMashup+SVMand STRING2GONode2vec+SVMobtain almost the same highest
~
inFig 2, the latter obtains the highest~F1GOscore (0.824) based on the Textmining network,
while the former obtained almost the same highestF~1GOscore (0.822) based on the
Combi-nedscore network. The hold-out evaluation results also confirm that STRING2GOMashup+SVM
obtains the highest~F1GOscore (0.275) by using the Textmining network, while also obtains
the significantly higher F1_GOscores than other methods basing on the Combinescore
network (see the Friedman test with Holmpost-hoccorrection results inS8 Table). STRING2-GOMashup+SVMalso obtains the overall highest MCCGOscore (0.277) based on the
Combined-score network and significantly higher MCCGOscores over all 204 GO terms than all other
methods based on the Textmining network (see the Friedman test with Holmpost-hoc
correction results inS9 Table). In terms of the protein-centric evaluation metrics, STRING2-GOMashup+SVMobtains the highest Fmaxscore (0.497) based on the Combinedscore network
and higher Fmaxscores than all other methods based on all other STRING networks except
the Database network. It also obtains the second highest Fmaxscore on the homolog-removal
hold-out evaluation protein-set based on the Combinedscore network. In terms of the Fτscore
metric, STRING2GONode2vec+SVMobtains the highest Fτscore (0.319) by using the
Combined-score network among all network embedding-based prediction methods based on all different STRING networks.
The second best performing method is STRING2GOEmbedding+Sigmoid.
STRING2-GOMashup+Sigmoidobtains higher~F1GOscores than either Mashup+SVM or Node2vec
+SVM during the classifier training stage. It also obtains the second highest~F1GOscores
during the hold-out evaluation based on 2 out of 5 networks (except the case when STRING2GOMashup+Sigmoidobtains the highest~F1 GOscore based on the Experimental,
Database and Coexpression networks). It also obtains the overall second highestMCC~ GO
score (0.273) based on the Textmining network. In terms of the AUPRC metric, STRING2-GOMashup+Sigmoidobtains the overall highestAUPRC~ GOscore (0.235) based on the
Textmin-ing network, and significantly higher AUPRC scores over all 204 BP terms than other methods based on the Combinedscore, Textmining and Experimental networks (see the Friedman test with Holmpost-hoccorrection results inS10 Table). From the perspective of protein-centric metrics, STRING2GOMashup+Sigmoidobtains the second highest Fmax
based on 3 out of 5 STRING networks, and the highest Fmaxscore (0.464) based on the
homolog-removal hold-out set with the Combinedscore network. Analogously, STRING2-GONode2vec+Sigmoidalso obtains the overall highest Fτscore (0.298) over all prediction
meth-ods based on the homolog-removal temporal validation protein-set with the Textmining network.
In addition, all of those methods discussed above obtains higher Fmaxscores than the
PPI-homolog and Naïve prediction methods based on the Combinedscore and Textmining net-works. All those methods also obtain higher Fτscores than the Naïve prediction method based
on the Combinedscore and Textmining networks, whereas the PPI-homolog method obtains the overall highest Fτscore (0.363).
Discussion
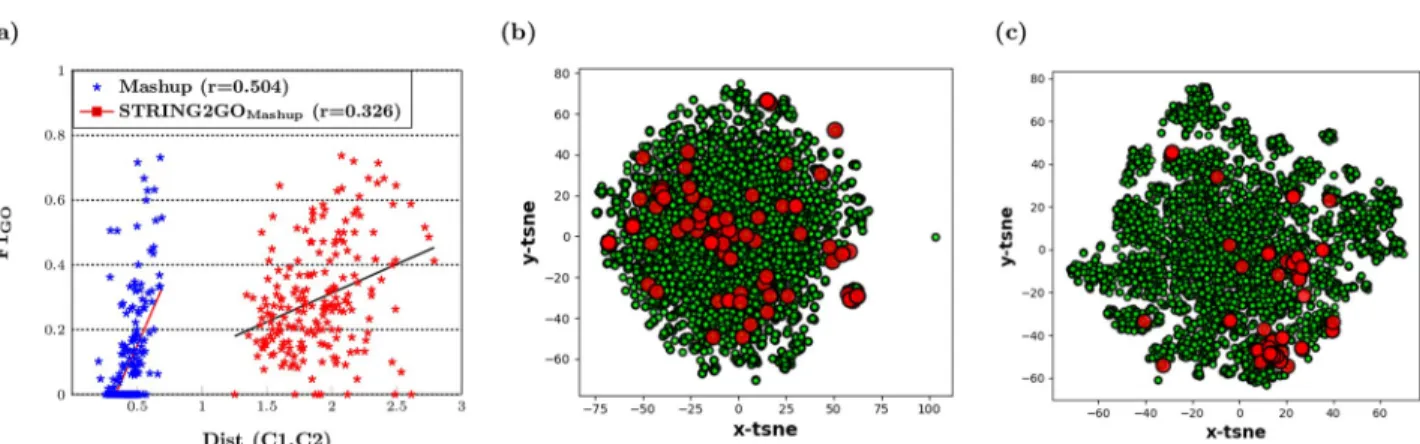
Overall, as discussed in previous sections, the functional representations learnt by STRING2GO show substantial improvement on the predictive power of the raw network embedding representations. We further investigate the improvement of predictive power of the STRING2GO-learnt functional representations by evaluating the enlarged distances between two classes of training protein samples. We firstly calculate the Euclidean distance between the centroids of two classes by using the Mashup-based representations’ values
standardized into the range of (0,1) in the same dimensional space, i.e. 800 dimensions for both Mashup and STRING2GOMashup. Then we calculate the correlation coefficient between
the distances and F1_GOscores obtained by hold-out evaluation. As shown inFig 5a, thexaxis
denotes the distance between two classes calculated by using either the raw Mashup-derived network embedding representations (blue), or the corresponding functional representations (red) STRING2GOMashup, based on the Combinedscore network, while theyaxis denotes the
corresponding F1_GOscore obtained by adopting those different representations working with
SVMs to predict individual BP terms. It is obvious that the distances between two classes of proteins for individual GO terms are all enlarged by STRING2GO, while the correlation coeffi-cient values between distances and F1_GOscores for both types of representations are positive,
indicating that the larger distances lead to higher predictive accuracy.
We also display an example of the increased distance between two classes of proteins when predicting the term GO:0090150, which shows the highest improvement on the classifier train-ing quality obtained by ustrain-ing STRING2GOMashup+SVM, compared by using Mashup+SVM.Fig
5b and 5crespectively show the 2-D visualization of raw Mashup-derived network embedding
representations and the corresponding STRING2GO-learnt functional representations after transforming by t-SNE [42]. The red dots denote the protein samples belonging to class “Annotated”, while the green dots denote the protein samples belonging to class “Not-anno-tated”. The red dots are distributed in the similar scale of green dots inFig 5b, whereas the most of red dots are clustered in the right side inFig 5c. This fact indicates that the functional representations successfully encode higher discriminating power against two classes of protein samples.
Conclusion
In this work, we present a novel deep learning-based protein function prediction method STRING2GO, which successfully learns a novel type of functional representations to train the down-stream classifiers for making predictions. STRING2GO shows the highest accuracy when predicting biological process protein functions, compared with other state-of-the-art network embedding representation-based protein function prediction methods. Based on this STRING2GO learning framework, there is potential for further improving the predictive
Fig 5. (a) Linear relationship between distances of two classes protein samples and F1_GOscores obtained by Mashup-derived Combinedscore
network embedding representations and the corresponding functional representations on Hold-out set testing (b) The 2D space visualization of distribution of protein samples belonging to GO:0090150 using the Mashup-derived network embedding representations and (c) the
STRING2GOMashupfunctional representations transformed by t-SNE.
accuracy by integrating representations from other data sources with the current PPI network embedding representations in a future study.
Supporting information
S1 Table. List of 204 biological process Gene Ontology terms studied in this work. (XLS)
S2 Table. Summary of number of proteins in the homolog-removal hold-out and temporal hold-out protein-sets after applying different E-value thresholds of the BLAST search. (PDF)
S3 Table. Summary of Fmaxscores obtained by different degrees of homolog-removal hold-out protein-sets obtained by using different prediction methods.
(PDF)
S4 Table. Summary of Fτscores obtained by different degrees of homolog-removal tempo-ral validation protein-sets obtained by using different prediction methods.
(PDF)
S5 Table. Two-tailed Wilcoxon signed-rank test results at the significance level of 0.05 on F1_GOscores obtained by different pairs of prediction methods over the hold-out evalua-tion.
(PDF)
S6 Table. Two-tailed Wilcoxon signed-rank test results at the significance level of 0.05 on MCCGOscores obtained by different pairs of prediction methods over the hold-out evalua-tion.
(PDF)
S7 Table. Two-tailed Wilcoxon signed-rank test results at the significance level of 0.05 on AUPRCGOscores obtained by different pairs of prediction methods over the hold-out eval-uation.
(PDF)
S8 Table. Friedman test with the Holmpost-hoccorrection results about multiple compari-sons on F1_GOscores obtained by different prediction methods over the hold-out evalua-tion.
(PDF)
S9 Table. Friedman test with the Holmpost-hoccorrection results about multiple compari-sons on MCCGOscores obtained by different prediction methods over the hold-out evalua-tion.
(PDF)
S10 Table. Friedman test with the Holmpost-hoccorrection results about multiple com-parisons on AUPRCGOscores obtained by different prediction methods over the hold-out evaluation.
(PDF)
Acknowledgments
The authors acknowledge the use of the high performance computing facility of the Depart-ment of Computer Science at University College London in the completion of this work.
Author Contributions
Conceptualization: Cen Wan, Domenico Cozzetto, Rui Fa, David T. Jones. Data curation: Cen Wan, Domenico Cozzetto.
Formal analysis: Cen Wan, Domenico Cozzetto, David T. Jones. Funding acquisition: David T. Jones.
Investigation: Cen Wan, Domenico Cozzetto, David T. Jones. Methodology: Cen Wan, David T. Jones.
Project administration: Cen Wan, David T. Jones. Resources: Cen Wan, David T. Jones.
Software: Cen Wan.
Supervision: Cen Wan, David T. Jones. Validation: Cen Wan, Domenico Cozzetto. Visualization: Cen Wan.
Writing – original draft: Cen Wan, Domenico Cozzetto, David T. Jones.
Writing – review & editing: Cen Wan, Domenico Cozzetto, Rui Fa, David T. Jones.
References
1. Orchard S, Kerrien S, Abbani S, Aranda B, et al. Protein interaction data curation: the International Molecular Exchange (IMEx) consortium. Nature methods. 2012; 9(4):345–350.https://doi.org/10.1038/ nmeth.1931PMID:22453911
2. Lee I, Blom UM, Wang PI, Shim JE, Marcotte EM. Prioritizing candidate disease genes by network-based boosting of genome-wide association data. Genome research. 2011; 21(7):1109–1121.https:// doi.org/10.1101/gr.118992.110PMID:21536720
3. Montojo J, Zuberi K, Rodriguez H, Kazi F, et al. GeneMANIA Cytoscape plugin: fast gene function pre-dictions on the desktop. Bioinformatics. 2010; 26(22):2927–2928.https://doi.org/10.1093/
bioinformatics/btq562PMID:20926419
4. Schmitt T, Ogris C, Sonnhammer EL. FunCoup 3.0: database of genome-wide functional coupling net-works. Nucleic acids research. 2014; 42(Database issue):D380–388.https://doi.org/10.1093/nar/ gkt984PMID:24185702
5. Szklarczyk D, Morris JH, Cook H, Kuhn M, et al. The STRING database in 2017: quality-controlled pro-tein-protein association networks, made broadly accessible. Nucleic acids research. 2017; 45(D1): D362–D368.https://doi.org/10.1093/nar/gkw937PMID:27924014
6. Mostafavi S, Ray D, Warde-Farley D, Grouios C, Morris Q. GeneMANIA: a real-time multiple associa-tion network integraassocia-tion algorithm for predicting gene funcassocia-tion. Genome biology. 2008; 9(S1):S4. https://doi.org/10.1186/gb-2008-9-s1-s4PMID:18613948
7. von Mering C, Jensen LJ, Snel B, Hooper SD, et al. STRING: known and predicted protein-protein asso-ciations, integrated and transferred across organisms. Nucleic acids research. 2005; 33(Database issue):D433–437.https://doi.org/10.1093/nar/gki005PMID:15608232
8. Schwikowski B, Uetz P, Fields S. A network of protein-protein interactions in yeast. Nature biotechnol-ogy. 2000; 18(12):1257–1261.https://doi.org/10.1038/82360PMID:11101803
9. Arnau V, Mars S, Marin I. Iterative cluster analysis of protein interaction data. Bioinformatics. 2005; 21 (3):364–378.https://doi.org/10.1093/bioinformatics/bti021PMID:15374873
10. Bader GD, Hogue CW. An automated method for finding molecular complexes in large protein interac-tion networks. BMC bioinformatics. 2003; 4:2.https://doi.org/10.1186/1471-2105-4-2PMID:12525261
11. Krogan NJ, Cagney G, Yu H, Zhong G, Guo X, et al. Global landscape of protein complexes in the yeast Saccharomyces cerevisiae. Nature. 2006; 440(7084):637–643.https://doi.org/10.1038/nature04670 PMID:16554755
12. Przulj N, Wigle DA, Jurisica I. Functional topology in a network of protein interactions. Bioinformatics. 2004; 20(3):340–348.https://doi.org/10.1093/bioinformatics/btg415PMID:14960460
13. Rives AW, Galitski T. Modular organization of cellular networks. Proceedings of the national Academy of sciences. 2003; 100(3):1128–1133.https://doi.org/10.1073/pnas.0237338100
14. Spirin V, Mirny LA. Protein complexes and functional modules in molecular networks. Proceedings of the national Academy of sciences. 2003; 100(21):12123–12128.https://doi.org/10.1073/pnas. 2032324100
15. Sharan R, Ulitsky I, Shamir R. Network-based prediction of protein function. Molecular system biology. 2007; 3:88.https://doi.org/10.1038/msb4100129
16. Zhang C, Zheng W, Freddolino PL, Zhang Y. MetaGO: predicting Gene Ontology of non-homologous proteins through low-resolution protein structure prediction and protein-protein network mapping. Jour-nal of Molecular Biology. 2018; 430:2256–2265.https://doi.org/10.1016/j.jmb.2018.03.004PMID: 29534977
17. Cowen L, Ideker T, Raphael BJ, Sharan R. Network propagation: a universal amplifier of genetic associ-ations. Nature review genetics. 2017; 18:551–562.https://doi.org/10.1038/nrg.2017.38
18. Kelley R, Ideker T. Systematic interpretation of genetic interactions using protein networks. Nature bio-technology. 2005; 23(5):561–566.https://doi.org/10.1038/nbt1096PMID:15877074
19. Qi Y, Suhail Y, Lin YY, Boeke JD, Bader JS. Finding friends and enemies in an enemies-only network: a graph diffusion kernel for predicting novel genetic interactions and co-complex membership from yeast genetic interactions. Genome research. 2008; 18(12):1991–2004.https://doi.org/10.1101/gr.077693. 108PMID:18832443
20. Voevodski K, Teng SH, Xia Y. Spectral affinity in protein networks. BMC system biology. 2009; 3:112. https://doi.org/10.1186/1752-0509-3-112
21. Cao M, Pietras CM, Feng X, Doroschak KJ, et al. New directions for diffusion-based network prediction of protein function: incorporating pathways with confidence. Bioinformatics. 2014; 30(12):i219–227. https://doi.org/10.1093/bioinformatics/btu263PMID:24931987
22. Cao M, Zhang H, Park J, Daniels NM, et al. Going the distance for protein function prediction: a new dis-tance metric for protein interaction networks. PLoS one. 2013; 8(10):e76339.https://doi.org/10.1371/ journal.pone.0076339PMID:24194834
23. Cho H, Berger B, Peng J. Compact Integration of Multi-Network Topology for Functional Analysis of Genes. Cell system. 2016; 3(6):540–548.e5.https://doi.org/10.1016/j.cels.2016.10.017
24. GligorijevićV, Barot M, Bonneau R. deepNF: Deep network fusion for protein function prediction. Bioinformatics. 2018; 34(22):3873–3881.https://doi.org/10.1093/bioinformatics/bty440PMID: 29868758
25. Huang Y, Wang W, Wang L, Tan T. Multi-task deep neural network for multi-label learning. Proceedings of 20th IEEE international conference on image processing (ICIP). 2013; 2897–2900.
26. Liu X, Gao J, He X, Deng L, et al. Representation Learning Using Multi-Task Deep Neural Networks for Semantic Classification and Information Retrieval. Proceedings of 2015 conference of the north Ameri-can chapter of the association for computational linguistics—human language technologies. 2015; 912–921.
27. Apweiler R, Bairoch A, Wu CH, Barker WC, et al. UniProt: the universal protein knowledgebase. Nucleic acids research. 2017; 45(D1):D158–D169.https://doi.org/10.1093/nar/gkw1099
28. Szklarczyk D, Franceschini A, Wyder S, Forslund K, et al. STRING v10: protein-protein interaction net-works, integrated over the tree of life. Nucleic acids research, 2015; 43(Database issue):D447–452. https://doi.org/10.1093/nar/gku1003PMID:25352553
29. Yates A, Akanni W, Amode MR, Barrell D, et al. Ensembl 2016. Nucleic acids research. 2016; 44(D1): D710–716.https://doi.org/10.1093/nar/gkv1157PMID:26687719
30. Huntley RP, Sawford T, Mutowo-Meullenet P, Shypitsyna A, et al. The GOA database: gene Ontology annotation updates for 2015. Nucleic acids research. 2015; 43(Database issue):D1057–1063.https:// doi.org/10.1093/nar/gku1113PMID:25378336
31. Ashburner M, Ball CA, Blake JA, Botstein D, et al. Gene ontology: tool for the unification of biology. The Gene Ontology Consortium. Nature genetics. 2000; 25(1):25–29.https://doi.org/10.1038/75556PMID: 10802651
32. Jiang Y, Oron TR, Clark WT, Bankapur AR, et al. An expanded evaluation of protein function prediction methods shows an improvement in accuracy. Genome biology. 2016; 17(1):184.https://doi.org/10. 1186/s13059-016-1037-6PMID:27604469
33. Grover A and Leskovec J. node2vec: Scalable Feature Learning for Networks. Proceedings of the 22nd ACM SIGKDD international conference on knowledge discovery and data mining. 2016; 855–864.
34. Mikolov T, Chen K, Corrado G, Dean J. Efficient Estimation of Word Representations in Vector Space. CoRR. 2013; abs/1301.3781.
35. Mikolov T, Sutskever I, Chen K, Corrado G, Dean J. Distributed Representations of Words and Phrases and their Compositionality. Proceedings of advances in neural information processing systems 26. 2013; 3111–3119.
36. Ioffe S and Szegedy C. Batch normalization: Accelerating deep network training by reducing internal covariate shift. Proceedings of the 32nd international conference on machine learning, PMLR. 2015; 37:448–456.
37. Goodfellow I, Warde-Farley D, Mirza M, Courville A, Bengio Y. Maxout Networks. In: Sanjoy, D. and David, M., editors, Proceedings of the 30th International Conference on Machine Learning. Proceedings of machine learning research: PMLR. 2013; 1319–1327.
38. Srivastava N, Hinton G, Krizhevsky A, Sutskever I, Salakhutdinov R. Dropout: a simple way to prevent neural networks from overfitting. Journal of machine learning research. 2014; 15(1):1929–1958. 39. Bishop CM. Pattern Recognition and Machine Learning. 2006; Springer-Verlag, New York, 33–38. 40. Pedregosa F, Varoquaux G, Gramfort A, Michel V, et al. Scikit-learn: Machine learning in Python.
Jour-nal of machine learning research. 2011; 12:2825–2830.
41. Platt J. Probabilistic outputs for support vector machines and comparisons to regularized likelihood methods. In: Smola A.J., et al. ed. (2000) Advances in large margin classifiers. 1999; MIT Press, Cam-bridge, MA, 61–74.
42. Maaten LVD, Hinton G. Visualizing data using t-sne. Journal of machine learning research. 2008; 9:2579–2605.