POWER QUALITY DISTURBANCE DETECTION
AND CLASSIFICATION USING SIGNAL PROCESSING
AND SOFT COMPUTING TECHNIQUES
A thesis submitted to NIT Rourkela
In partial fulfillment of the requirement for the award of the Degree of
Master of Technology
In
Industrial Electronics
By
SHARMISTHA SARKAR
Under the Guidance of
Prof. Sanjeeb Mohanty
Roll No- 212EE5442
Department of Electrical Engineering
National Institute of Technology, Rourkela
DECLARATION
This is to certify that Thesis report entitled “Power Quality Disturbance Detection and Classification Using Signal Processing and Soft-computing Techniques.” which is submitted by me in partial fulfillment of the requirement for the award of degree M.Tech. In Electrical Engineering to National Institute of Technology, Rourkela comprises only my original work and due acknowledgement has been made in the text to all other material used.
Date: Name of Student
APPROVED BY
Department of Electrical Engineering
National Institute of Technology, Rourkela
Certificate
This is to certify that thesis entitled
“Power Quality Disturbance Detection and
Classification Using Signal Processing and Soft-computing Techniques”
which is
submitted by
Sharmistha Sarkar (Industrial Electronics, Roll No: 212EE5442)
in
partial fulfillment of the requirement for the award of degree M.Tech. In Electrical
Engineering to
National Institute of Technology, Rourkela
is a record of the
candidate own work carried out by her under our supervision. The matter embodied in
this thesis is original and has not been submitted for the award of any other degree.
Prof. Sanjeeb Mohanty Department of Electrical Engineering National Institute of Technology, Rourkela
ACKNOWLEDGEMENTS
Firstly, my deepest thanks to my advisor and thesis Prof. Sanjeeb Mohanty for providing me with the support, valuable technical guidance and financial assistance through the span of the research. I would also like to thank Prof. A K Panda and K B Mohanty for agreeing to be on my defense committee. Their critical reviews are very much acclaimed. It is only the unparalleled love, support and vision of my parents, loved ones and friends that made this works a reality. Thank you one and all and lastly my whole hearted thanks to the Department of Electrical Engineering at the National Institute of Technology, Rourkela for all the resources that helped me in successfully completing my degree requirements.
Abstract
The quality of electric power and disturbances occurred in power signal has become a major issue among the electric power suppliers and customers. For improving the power quality continuous monitoring of power is needed which is being delivered at customer’s sites. Therefore, detection of PQ disturbances, and proper classification of PQD is highly desirable. The detection and classification of the PQD in distribution systems are important tasks for protection of power distributed network. Most of the disturbances are non-stationary and transitory in nature hence it requires advanced tools and techniques for the analysis of PQ disturbances. In this work a hybrid technique is used for characterizing PQ disturbances using wavelet transform and fuzzy logic. A no of PQ events are generated and decomposed using wavelet decomposition algorithm of wavelet transform for accurate detection of disturbances. It is also observed that when the PQ disturbances are contaminated with noise the detection becomes difficult and the feature vectors to be extracted will contain a high percentage of noise which may degrade the classification accuracy. Hence a Wavelet based de-noising technique is proposed in this work before feature extraction process. Two very distinct features common to all PQ disturbances like Energy and Total Harmonic Distortion (THD) are extracted using discrete wavelet transform and are fed as inputs to the fuzzy expert system for accurate detection and classification of various PQ disturbances. The fuzzy expert system not only classifies the PQ disturbances but also indicates whether the disturbance is pure or contains harmonics. A neural network based Power Quality Disturbance (PQD) detection system is also modeled implementing Multilayer Feed forward Neural Network (MFNN).
LIST OF TABLES
Table
Number
Table Caption
Page Number
TABLE 4.1 Feature Vector for voltage sag signal 28 TABLE 4.2 Frequency Bank Distributed for 12.8 KHz sampling rate 28 TABLE 4.3 Frequency Bank Distribution for 6.4 KHz sampling rate 29 TABLE 4.4 Classification by unique features for the disturbances signal 29
TABLE 4.5 Classification Results MFNN 32
TABLE 6.1 Classification Results of PNN 40
TABLE 6.2 Classification Results of MFNN & PNN for three classes
40 TABLE 6.3 Comparison of accuracies with three and four features
40 TABLE 6.4 Comparative analysis performance PNN & MFNN 41
LIST OF FIGURES
Figure
Number
Figure Caption
Page
Number
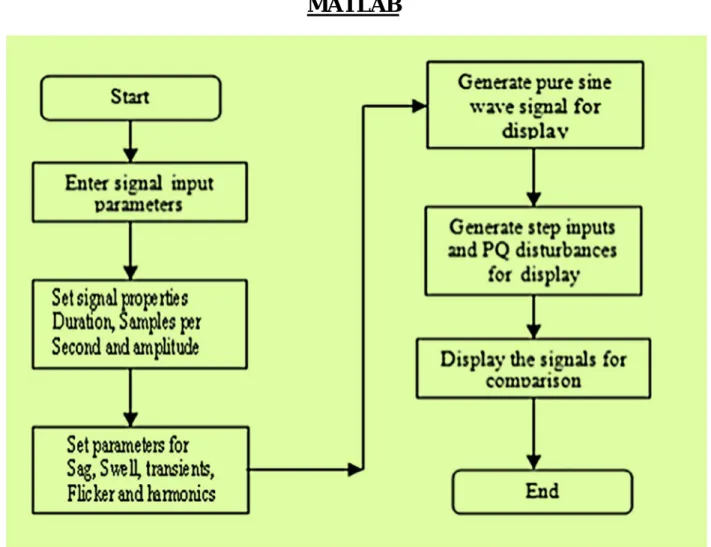
Fig 3.1 Flow chart for PQ signal disturbance generation using MATLAB20
Fig 3.2(a) Voltage Sag signal in time domain21
Fig 3.2(b) Voltage Sag signal
21
Fig 3.3(a) Voltage Swell signal in time domain
21
Fig 3.3(b) Voltage Swell signal
21
Fig 3.4(a) Voltage Interruption signal in time domain
22
Fig 3.4(b) Voltage Interruption signal
22
Fig 3.5(a) Decomposed voltage sag level 1 using wavelet transform
23
Fig 3.5(b) Approximate signal level 1 of sag signal23
Fig 3.5(c) Detail signal level 1 of sag signal29
Fig 3.5(d) Detail signal level 2 of sag signal29
Fig 3.5(e) Detail signal level 3 of sag signal29
Fig 3.5(f) Approximate signal level 4 of sag signal30
Fig 3.5(g) Detail signal level 4 of sag signal30
Fig 3.5(h) Reconstructed Approximate Sag Signal30
Fig 3.5(i) Reconstructed Detail Sag signal31
Fig 5.1 Architecture of MFNN
33
LIST OF ABBREVIATIONS
PNN Probabilistic Neural Network BPA Back Propagation Algorithm CWT Continuous Wavelet Transform
DWT Discrete Wavelet Transform
FT Fourier Transform
MFNN Multilayer feed forward Neural Network NN Neural Network
PE Processing Elements PQ Power Quality
PQD Power Quality Disturbance RMS Root Mean Square
STFT Short Time Fourier Transform THD Total Harmonic Distortion WT Wavelet Transform
Contents
TITLE i DECLARATION ii ACKNOWLEDGEMENT iii ABSTRACT iv LIST OF TABLES v LIST OF FIGURES viLIST OF ABBREVIATIONS vii
Chapter1 Introduction
1.1 Introduction 111.2 Literature Survey 11
1.3 Backround of the Project 12
1.4 Objective of the Project 12
1.5 Chapter Outline 12
Chapter 2 Power Quality Events
2.1 Introduction 132.2 The Importance of Power Quality (PQ) 13
2.3 Types of Power Quality (PQ) Problem 13
2.4 Power Quality (PQ) Phenomena 14
2.4.1 Voltage Sag 15 2.4.2 Voltage Swell 16 2.4.3 Interruption 17 2.4.4 Oscillatory Transient 2.4.5 Impulsive Transient 17 2.5 Summary 17
Chapter 3 Detection of PQ Event using Wavelet Transform
3.1 Introduction 183.2 Discrete Wavelet Transform (DWT) 18
3.3 Choice of Mother Wavelet 19
3.4.1 Signal Specification 20
3.5 Detection Using WT 22
3.5.1 Voltage Sag 23
3.5.2 Summary 25
Chapter 4 Feature Extraction of Power Signal
4.1 Introduction 264.2 Features 26
4.2.1 Total Harmonic Distortion 26
4.2.2 Energy of a Power Signal 27
Chapter 5 Classification of Power Signal Using MFNN
5.1 Introduction 305.2 Multilayer Feed forward Neural Network 30
5.2.1 Introduction 30
5.2.2 Back Propagation Algorithm 31
5.2.3 Classification Results Using MFNN 32
5.2.4 Summary 33
Chapter 6 Detection of PQ Disturbances Using S-Transform
6.1 Introduction 346.2 The Discrete S-Transform 35
6.3 Feature Extraction by S-Transform 36
6.4 Classification Using Probabilistic Neural Network(PNN) 36
6.4.1 Theory 37
Chapter 7 Conclusion and Future Scope of Work
7.1 Future Scope of Work 407.2 Conclusion 41
Chapter 1 INTRODUCTION
1.1
Introduction:
Now-a-days, the equipments which are being used in electrical utilities, those are more sensitive to Power Quality. These equipments contain power electronic components which are sensitive to power disturbances. So, any type of disturbance occurs in the voltage current or frequency of the power signal that can also affect the customer’s side which is called power quality problem. So, electrical utilities and customers both are aware of the power quality disturbances. Degradation in quality of power is mainly caused by disturbances such as voltage swell, voltage sag, notch, transients, and harmonic distortions and so on. Since, the electric motor draws more current when they are starting than they are running at their rated speed. So, starting of an electric motor can be the reason of voltage sag. Energization of a large capacitor bank can also cause voltage swell. In practical distribution network to improve power quality, such disturbances should be identified first before appropriate mitigation can be taken.
1.2
Literature Survey:
Power Quality generations are generally non-stationary in nature and for a very short duration of time that disturbances occur. For identifying the signals, both time and frequency information is needed. By applying normal Fourier Transform, it is not possible to analyze a signal as it only provides spectral information but it does not provide time localization information. And that time localization information is an essential step for determining the time and duration of the occurrence of the disturbance [2].
For analyzing non-stationary signal Time frequency analysis is more suitable as it provides both time and spectral information of the signal. Many researchers have frequently used Discrete Wavelet Transform (DWT) and Short Time Fourier Transform (SFT) among all the techniques for analyzing those power signals. In case of (SFT), a fixed window width is used to shift in time for analyzing the signal which is not sufficient for real power quality events, because it involves wide range of frequencies. In that case DWT is more preferable for detection of time-frequency variations as it employs a fixed window width [3].
For classifying transient disturbances T.Jayasree, at al had proposed a wavelet based Radial Basis Neural Network method. In this paper, different PQ disturbances are generated and decomposed through Wavelet Multi Resolution Analysis technique (MRA).
Gaing [5], had also used Multi-Resolution analysis technique for decomposition of the signal into it’s detail and approximation coefficients. That paper proposes a Probablistic Neural Network for classification of PQ events based on the features extracted from the detail coefficients through decompositions.
Zhang Ming et al. [6] had proposed a method which employs RMS and FFT technique for extracting the features from the detected signal. In this paper a Rule Based Decision Tree (RBDT) algorithm has been used for classification of the power signal. In this paper, wavelet based method and a rule based algorithm has been proposed where the features extracted from the decomposed signal using MRA technique has been used for classification of signal disturbance.
1.3
Background of the Project:
As related to different disturbances Power Quality events are of various types. Those disturbances can be occurred due to dynamic operations as well as faults, steady state load currents. A protective relay is more suitable component for reliable operation of power distribution network among all the affected components.
When the operation of distribution network is stable and normal protective relay does not play any role. When there are faults involved in the system only then protective relay works.Protective relays generally do not respond to any one identifiable parameter such as the rms value of a primary quantity or the fundamental frequency component of that quantity.
1.4
Objective of the Project:
The main aim of the work is to develop a new method for the detection and the classification of the power quality (PQ) disturbances such as the transients, the waveform distortions, sags, swells and interruptions.
Detection & Classification of PQ events using Wavelet Transform & Multi-Resolution Analysis (MRA).
Feature extraction by Wavelet Transform.
Classification through Multilayer Feed forward Neural Network (MFNN).
Detection of PQ events Using S-Transform.
Classification of PQ events through Probabilistic Neural Network (PNN).
Comparison of classification accuracy for both cases (Wavelet Transform & S-Transform).
1.5
Chapter Outline:
This thesis consists of five chapters overall. Chapter 1 describes the background of the project. There is few line of introduction about power quality studies for the beginning. Then, continued with introduction, literature survey, objective of the work.
Chapter 2 tells us about the detail of detection of a particular power quality event using Wavelet Transform. First it provides a detail description of Discrete Wavelet Transform. Then, continued with the detailed decomposition process of Discrete Wavelet Transform. Chapter 3 provides the whole idea of feature extraction after detection of PQ event. How the features like Total Harmonic Distortion (THD) and Energy can be extracted from the decomposed power signal using DWT.
Chapter 4 introduces us with Multilayered Feed-forward Neural Network. In this chapter the features extracted from decomposed power signal has been given as input to the MFNN for classification of the type of PQ event.
Chapter 5 tells us about the detail of detection of a power quality event using Stockwell Transform and then the features extracted from power signal using Stockwell Transform has been given as input to the Probablistic Neural Network (PNN).
Chapter 6 has discussed the conclusion, future scope of the work, and generalization of work implemented in this project.
Chapter 2 Power Quality Events
2.1 Introduction:
The term PQ itself has various definitions from utility, manufacturer and consumers perspectives. PQ generally is defined as the concept of powering and grounding sensitive equipment in a manner that is suitable to the operation of that equipment [7-8]. This chapter will highlight what PQ is, the problems related to PQ and existing method to analyze and identify these problems.
2.2 The Importance of Power Quality (PQ):
The quality of electric power has become an important issue for electric utilities and consumers. The consumers, in particular, are the party who face a major detrimental effect of their load due the PQ problem or technically define as power disturbances. These disturbances have degraded the performance and efficiency of consumers’ loads; especially power electronics load [28]. The subject of PQ encompasses most area of power engineering starting from generation to the end-users [29]. In seeking relief, electric power utilities and consumers turn to inspect, monitor, record and analyze of the electric power to determine the problem and the correct mitigation technique in order to mitigate the occurrences of the disturbance.
2.3 Types of Power Quality (PQ) Problems:
The main approach to reduce the PQ problem is to implement a proper wiring and grounding system for electrical consumers system [30]. The technical know-how on electrical system should be enhanced so that major problems due to PQ can be avoided. Another factor that can cause PQ problem is application of electronic devices especially non-linear load. The non-linear loads draw harmonic currents, and as a consequence, harmonic voltages are generated whenever the harmonic current flows through the impedance of the system [31]. The presence of harmonic creates many problems to the consumers’ electrical system and equipment [32]. Another factor that can improve the quality of power is better knowledge of PQ field. The knowledge on an appropriate system for electrical wiring system is very useful to enhance the PQ. The theoretical background of the behavior and impact of the load usage in electrical system is important. The
behavior of load relates to the size of cable in the system, the proper mitigation technique and protective system. One should realize that most of the PQ problems are originated from the load. Another problem on obtaining high PQ level is the effects of natured causes such as lightning, animal and man-made problem. These types of problem cannot be avoided from the system. A good protective system should be developed for stopping the problem into wider area.
2.4 Power Quality (PQ) Phenomena:
There are a lot of definitions of PQ that has been used in the related field. Conservatively, PQ is defined as less tripping, high performance of electrical system and less disoperation of the system [33]. This definition comes from consumers perspective, which is considered from the system application. From the utility perspective, PQ means the reliability of the generator to supply the power to the consumers. Another definition of PQ is relevant to both parties are the availability of the voltage or current in the electrical system to perform a sinusoidal characteristic [34]. The high deviations of current and voltage from the sinusoidal characteristic show the PQ in the system is very low. PQ problem, on the other hand is defined as any deviation in term of magnitude or frequency in current or voltage that cause any problem relating to the malfunctioning or disoperation of the system and equipment to the consumers. It means that, the severity of the deviation in voltage or current can cause severe problem to the consumers or the utility. PQ phenomena can be divided into two main classes, namely; the steady state phenomena and the non-steady state phenomena. The steady state phenomena is attributed by certain characteristic as listed below [7, 13]:
1) Amplitude 2) Frequency 3) Spectrum 4) Modulation 5) Source Impedance 6) Notch Depth
7) Notch Area
For the non-steady state phenomena, different characteristic is applied to classify the type of phenomena. The phenomena are as follows [7, 13]:
1) Rate of rise 2) Amplitude 3) Duration 4) Spectrum 5) Frequency 6) Rate of occurrence 7) Energy potential 8) Source impedance
Stone and Collisson has stated further description of these phenomena [35]; whereby the phenomena were divided into nine main parts referred to time deviation and frequency deviation. The characterization for PQ phenomena is applicable for the utilities, manufacturers and consumers side to guide them for proper mitigation action. In this study, five power disturbances, which have one or more characteristics listed as PQ phenomena, are selected for further analysis. These five disturbances are voltage sag, voltage swell, interruption, oscillatory transient and impulsive transient. The choice of disturbances was motivated by the available literature on disturbance waveform [8]
2.4.1 Voltage Sag:
Voltage sag is defined as the decrement of the nominal rms voltage between 0.1 p.u. to 0.9 p.u. The duration of the voltage sag can be from 0.5 cycles to 1 minute. The occurrence of sag is due to Single Line to Ground (SLG) fault, motor starting and over current presence. The general term for voltage sag is also known as the short duration decrease of the voltage. If the decrease of the
voltage is longer then 1-minute, under voltage term is used. Generally, voltage sag is divided into three classes based on the duration of the occurrences. The classes are instantaneous sag, momentary sag and temporary sag [7].
2.4.2 Voltage Swell:
Voltage swell is defined as the increment of the rms voltage between 1.1 to 1.8 p.u. The frequency of the voltage swell occurrences is low compared to the voltage sag. Coincidently, the duration of voltage swell is the same as voltage sag, which is between 0.5 cycles to 1 minute. The factor that caused voltage swell is the starting of large motor, SLG fault, light system loading and incorrect tap setting of the transformer. The swell that is caused by SLG occurs at unfaulted phase. The swell is also divided into three main classes namely; instantaneous swell, momentary swell and temporary swell. Like voltage sag, if the duration of increasing voltage exceed 1 minute, overvoltage term is preferable. Installing fast acting tap changers in the system can mitigate voltage swell. The consequences of this event are over heating of DC regulators and higher iron loss in most machines applications [7].
2.4.3 Interruption:
Interruption is defined as the decrement in rms voltage less that 0.1 p.u. Most of the interruption occurs after the voltage sag. The interruption is resulted from the loose connection, severe fault and reclosing of circuit breaker. For the reclosing of circuit breaker action, transient phenomena followed by interruption can be observed. The interruption results in nuisance tripping and misoperation of the overall system. Interruptions show that the voltages are almost zero and no more supply available into the system.
2.4.4 Oscillatory Transient:
Oscillatory transient is another class of PQ phenomena that is totally different from three previous phenomena. The transient is an instantaneous rapid change in magnitude of voltage. The typical duration of this disturbance is between 5μs to 50ms. The magnitude of the transient
may reach until 2.0 p.u. However, most of the typical magnitude of oscillatory transient is 1.2 to 1.5 p.u. The frequency of spectral content could be from less than 5 kHz to 5 MHz. The
instantaneous change of the magnitude during transient occurrences can be positive or negative in polarity. The transient may originate from capacitor switching, reclosing of circuit breaker and load switching [7].
2.4.5 Impulsive Transient:
Impulsive transient is another transient disturbance that was experienced by the electrical user. Impulsive transient is a sudden, non-power frequency change of voltage. The instantaneous change of voltage for impulsive transient is unidirectional positive polarity. This disturbance is characterized by its rise and decay times. The duration of the disturbance could be less than 50ns to more than 1 ms. Another characteristic that can be considered is the spectral content in term of rise time. The spectral content for the impulsive transient is between 5ns to 0.1ms rise time. The common cause of impulsive transient is lightning strike [7].
2.5 Summary:
The overview of PQ has been discussed in this chapter. The varieties of the voltages in PQ field give a lot of information for the PQ level in electrical system. Every definition and characteristic of the disturbances has been described. The patterns of voltage or PQ disturbances need to be identified for preventive action in order to avoid the cumbersome problem in electrical system. In view of the above shortcomings, the following chapter explores the current technique for the identification of PQ disturbance that is commonly used in PQ field.
Chapter 3 Detection of PQ Event Using Wavelet Transform
3.1
Introduction:
Now-a-days with the advent of the digital techniques, the PQ disturbances are monitored onsite and online. Recently the wavelet transform (WT) has emerged as a powerful tool for the detection of PQ disturbances. The Wavelet transform uses wavelet function as the basis function which scales itself according to the frequency under analysis. The scheme shows better results because the basis function used in the WT is a wavelet instead of an exponential function used in FT and STFT. Using the WT the signal is decomposed into different frequency levels and presented as wavelet coefficients. Depending on the types of signal, continuous wavelet transform (CWT) and discrete wavelet transform (DWT) are employed. For continuous time signal, CWT based decomposition is adopted and for discrete time signal DWT based decomposition is employed. However in this work all the signals shown are discrete in nature hence DWT based decomposition is employed herein this part of the work different PQ disturbances such as Sag, Swell, Interruption, Sag with harmonics and Swell with harmonics are generated using MATLAB and then decomposed using decomposition algorithm of WT and point of actual disturbance is located and type of disturbance is detected.
3.2 Discrete Wavelet Transform (DWT)
Discrete Wavelet Transform has two stages. First wavelet coefficients hd(n) and gd(n) have to be determined. It represents the signal X(n) in the wavelet domain. After the first stage, approximate and detailed coefficients have to be calculated from the decomposed power signal. These coefficients are cA1 (n) and cD1 (n) as defined below.
After the decomposition of power signal, to get the original signal in time domain, inverse fourier transform has to be applied. So the signal X(t) in wavelet domain is as follows-
( , ) =∫ ( ) , - - - - (3.1)
Where Ψa, b (t) =Ψ ((t-b)/a)/√a - - - (3.2)
is a scaled and shifted version of the mother wavelet Ψ(t).The parameter a corresponds to scale and
frequency domain property of Ψ(t).The parameter b corresponds to time domain property of Ψ(t) .In
addition 1/√ a is the normalization value of Ψa,b(t) for having spectrum power as same as mother
wavelet in every scale. The DWT is introduced by considering sub band decomposition using the digital filter equivalent to DWT.The filter bank structure is shown in Figure 2.1.The Band pass filter is implemented as a low pass and high pass filter pair which has mirrored charecteristics.While the low pass filter approximates the signal. The high pass filter provides the details lost in the approximation. The approximations are low frequency high scale component whereas the details are high frequency low scale component.
3.3 Choice of Mother Wavelet:
The selection of mother wavelet is an important issue for decomposition of PQ disturbances as the proper selection of mother wavelet results in accurate detection of disturbances. The original signal to be decomposed is multiplied with the selected mother wavelet to obtain the scaled and translated version of the original signal at different levels. There are several mother wavelets such as Daubechies, Morlet, Haar, Symlet etc. exists in wavelet library but literatures revealed that for power quality analysis Daubechies wavelet gives the desired result. Again the Daubechies wavelet has several orders such as Db2, Db3, Db4, Db5 Db6, Db7 Db8, and Db10etc.The Daubechies wavelets with 4, 6, 8, and10 filter coefficients work well in most disturbance cases. Based on the detection problem, the power qualities disturbances can be classified into two types, fast and slow transients. In the fast transient case the waveforms are marked with sharp edges, abrupt and rapid changes, and a fairly short duration in time. In this case Daub4 and Daub6 give good result due to their compactness. In slow transient case Daub8 and Daub10 shows better performance as the time Interval in integral evaluated at point n is long enough to sense the slow changes.
3.4 Generation of PQ disturbances:
Fig 3.1 Flow chart for PQ signal disturbance generation using
MATLAB
3.4.1 Signal specification:
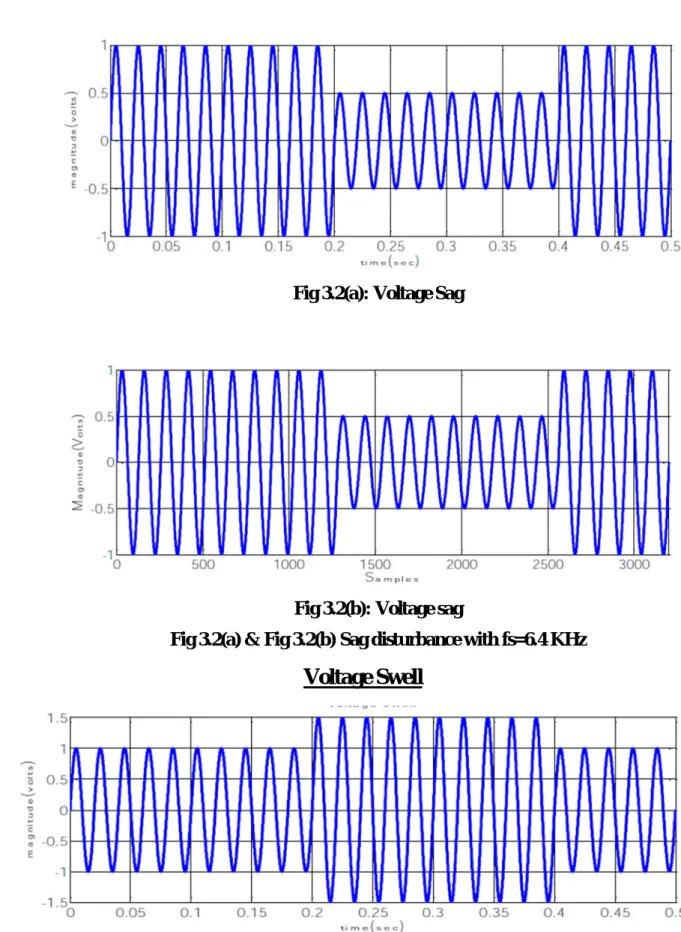
Ts (time period) =0.5 sec, fs (sampling frequency) =6.4 KHz, f=50Hz, No of cycles=25, No of samples/cycle=128, Total Sampling points=3200.Duration of disturbance=0.2 second. The interval of disturbance from 0.2 to 0.4 second of time which is between 1250 to 2500 sampling points.
FLOW CHART FOR PQ SIGNAL DISTURBANCE GENERATION USING
MATLAB
Fig 3.2(a): Voltage Sag
Fig 3.2(b): Voltage sag
Fig 3.2(a) & Fig 3.2(b) Sag disturbance with fs=6.4 KHz Voltage Swell
Fig 3.3(a)
Voltage Sag
Fig 3.3(b)
Fig 3.3(a) & Fig 3.3(b) Swell Disturbance with fs=6.4 kHz
Voltage Interruption
Fig 3.4(a)
Fig 3.4(b)
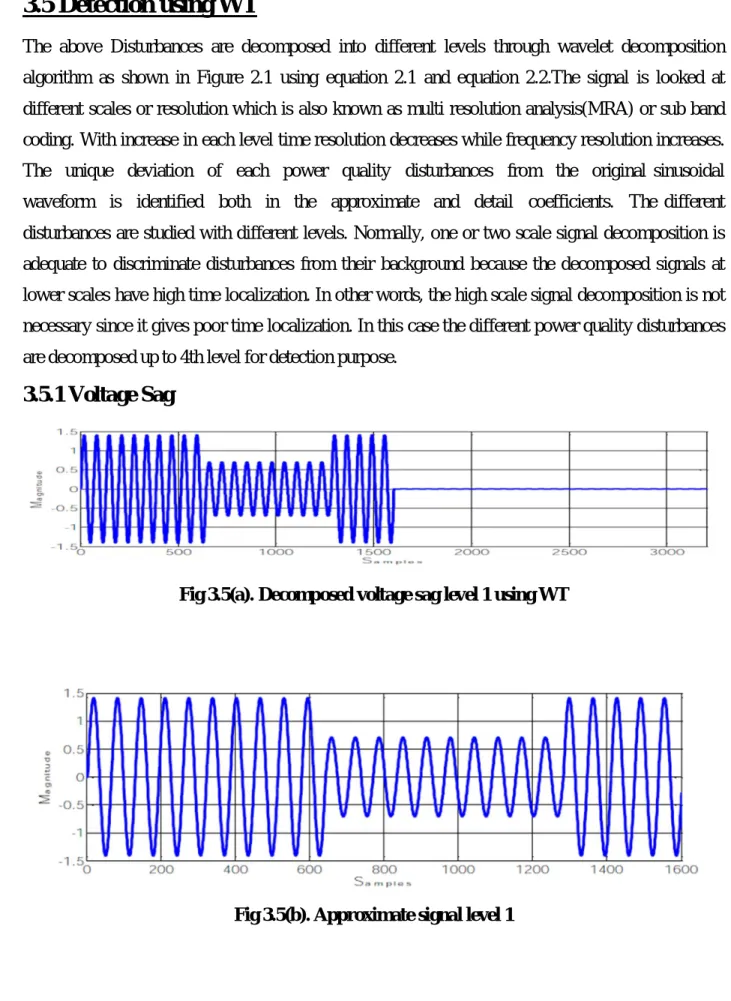
3.5 Detection using WT
The above Disturbances are decomposed into different levels through wavelet decomposition algorithm as shown in Figure 2.1 using equation 2.1 and equation 2.2.The signal is looked at different scales or resolution which is also known as multi resolution analysis(MRA) or sub band coding. With increase in each level time resolution decreases while frequency resolution increases. The unique deviation of each power quality disturbances from the original sinusoidal waveform is identified both in the approximate and detail coefficients. The different disturbances are studied with different levels. Normally, one or two scale signal decomposition is adequate to discriminate disturbances from their background because the decomposed signals at lower scales have high time localization. In other words, the high scale signal decomposition is not necessary since it gives poor time localization. In this case the different power quality disturbances are decomposed up to 4th level for detection purpose.
3.5.1 Voltage Sag
Fig 3.5(a). Decomposed voltage sag level 1 using WT
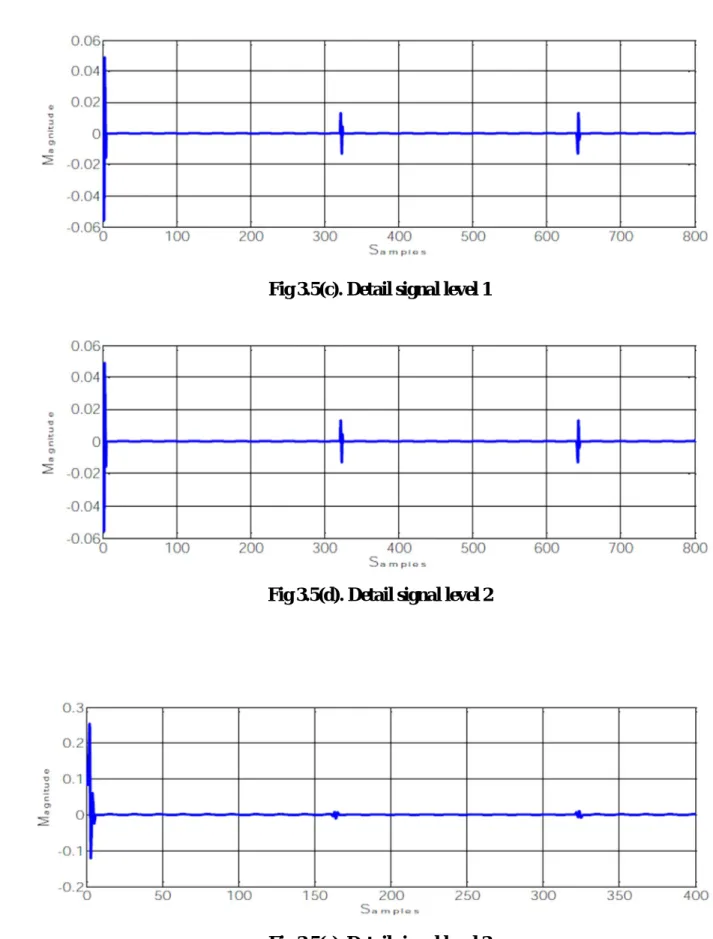
Fig 3.5(c). Detail signal level 1
Fig 3.5(d). Detail signal level 2
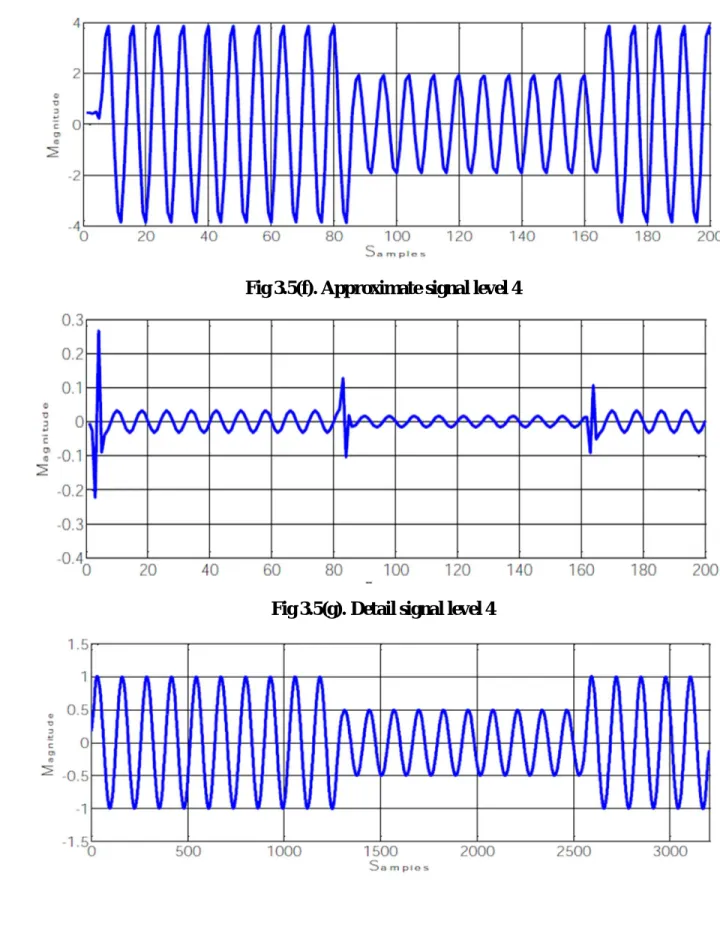
Fig 3.5(f). Approximate signal level 4
Fig 3.5(g). Detail signal level 4
Fig 3.5(i). Reconstructed detail signal
3.5.2 Summary :
From the decomposition of the disturbance shown in Figure 3.2(a) and Figure 3.2(b) it is seen that disturbance occurred at 1250 to 2500 samples or 0.2 to 0.4 second interval of the signal which is confirmed from the result shown in Figure 3.5(h) and Figure 3.5(i).Reduction in nominal value of the waveform can be marked from the approximate and detail coefficient of level4 decomposition as shown in Figure 3.5(f) and Figure 3.5(g).The reconstructed approximate waveform shown in Figure 3.5(h) also perfectly resembles with input disturbance waveform shown in Figure 3.2(b) which confirmed the disturbance to be the voltage Sag and proves the accurate detection of the disturbance.
Chapter 4 Feature Extraction of Power Signal
4.1 Introduction:
Feature extraction of a disturbed power signal provides information that helps to detect the responsible fault for power quality disturbance. A precise and faster feature extraction tool helps power engineers to monitor and maintain power disturbances more efficiently. This paper uses adaptive harmonic wavelet transform as a power quality feature extraction tool which can perform better to analyze a disturbed voltage or current signal compared to present methods. Adaptive harmonic wavelet transform adopts harmonic wavelet as a basis function which provides better representation of power quality signals than the other wavelet functions that are being employed in present analysis tools. Adaptive harmonic wavelet transform is derived from generalized harmonic wavelet transform by developing its adaptiveness to analyze all kinds of disturbed signals with minimum human interaction.
4.2 Features:
4.2.1 Total Harmonic Distortions (THD):
The total harmonic distortion, or THD, of a signal is a measurement of the harmonic distortion present and is defined as the ratio of the sum of the powers of all harmonic
components to the power of the fundamental frequency. THD is used to characterize the linearity
of audio systems and the power quality of electric power systems.
When the input is a pure sine wave, the measurement is most commonly the ratio of the sum of the powers of all higher harmonic frequencies to the power at the first harmonic, or fundamental, frequency. Measurements based on amplitudes (e.g. voltage or current) must be converted to powers to make addition of harmonics distortion meaningful. For a voltage signal, for example, the ratio of the squares of the RMS voltages is equivalent to the power ratio. THD is also commonly defined as an amplitude ratio rather than a power ratio,[resulting in a definition of THD which is the square root of that given as follows:
Where N
j is the no of detail coefficients at scale j while THD is calculated by considering each
sub-band contribution [11-12] as shown in equation ().The sampling frequency selected is 6.4 kHz or 128f
1. In this paper, the fundamental frequency is 50 hertz and used six level of WT thus
the output should receive the sub-band as follows: • cD1: 32f 1 ~ 64f1; • cD2: 16 f 1 ~ 32 f1; • cD3: 8 f 1 ~ 16 f1; • cD4: 4 f 1 ~ 8 f1; • cD5: 2 f 1 ~ 4 f1; • cD6: 1 f 1 ~ 2 f1; • cA6: 0 f 1 ~ 1 f1; = ∑ ( ) ∑ [ ( )] - - - (4.2) ENERGY:
The energy of the signal is calculated using parseval’s theorem [10] which states that if S(t) is the voltage across the resistor or current through the resistor then the energy dissipated is
E=
∫
| ( )|
dt
- - - (4.3)In wavelet domain the signal is decomposed into the approximate and detailed coefficients and therefore energy dissipated by the signal in terms of approximate and detail coefficients given by
E=
∑
( )
+
∑
∑
( )
- - - (4.4) Where CTABLE 4.1 Feature vector for voltage sag
TABLE 4.2
FREQUENCY BANK DISTRIBUTION FOR 12.8 KHZ SAMPLING RATE
Decomposition level
Frequency range
(fs = 12.8 KH z)
Approximation(a)
Detailed(d)
1 0 to 3.2 KHz 3.2 K to 6.4 KHz 2 0 to 1.6 KHz 1.6 K to 3.2 KHz 3 0 to 800 Hz 800 Hz to 1.6 KHz 4 0 to 400 Hz 400 Hz to 800 Hz 5 0 to 200 Hz 200 Hz to 400 Hz 6 0 to 100 Hz 100 Hz to 200 Hz 7 0 to 50 Hz 50 Hz to 100Hz 8 0 to 25Hz 25 Hz to 50 HzTABLE 4.3
FREQUENCY BANK DISTRIBUTION FOR 6.4 KHZ SAMPLING RATE
Decomposition level
Frequency range
(fs = 6.4 KH z)
Approximation(a)
Detailed(d)
1 0 to 1.6 KHz 1.6 K to 3.2 KHz 2 0 to 800 KHz 800Hz TO 1.6 KHz 3 0 to 400 Hz 400 Hz to 800Hz 4 0 to 200 Hz 200 Hz to 400 Hz 5 0 to 100 Hz 100 Hz to 200 Hz 6 0 to 50 Hz 50 Hz to 100 Hz 7 0 to 25Hz 25 Hz to 50Hz 8 0 to 12.5Hz 12.5 Hz to 25 HzTABLE 4.4
Classification by Unique Features for the Disturbance Signal
Signal
Feature
From 1
stlevel
detailed
Level 4
detail
energy
Peak energy
½ cycle
voltage(rms)after
occurrence
Duration
Repeat
Pure
Sine
0 no - At level 7th -Sag
> ½ cycle no - At level 7th >0.1 And <0.8Swell
> ½ cycle no At level 7th >1.1Chapter 5 Classification of Power Signal Using MFNN
5.2 Multilayer feed forward Neural Network
5.2.1 Introduction:
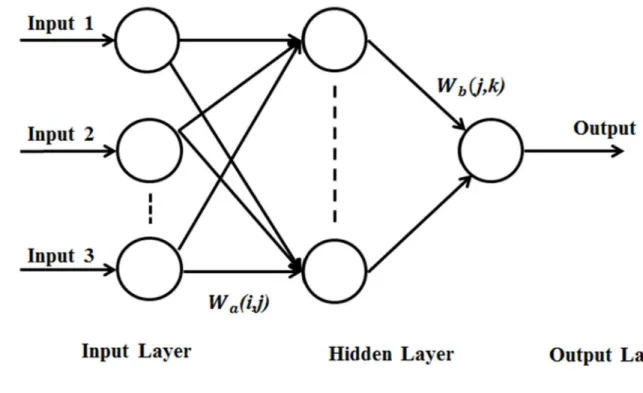
An artificial neural network (ANN) (or, neural network) provides a practical general method for, discrete-valued, learning real-valued and vector-valued functions from examples. The type of neural network learning is supervised learning, i.e, the network is provided with example inputs and correct answer for the input. Generally for regression problem and classification problem, an input belongs to which class (out of several possibilities) that is main concern. As an example we can say, if we want to have network learning to distinguish pictures of cats from pictures dog. Then in that particular case, we would provide the network with a series of pictures and whether the picture is a cat or dog that we will tell for each picture. In case, of regression problem, the main task is learning of real-valued target function. How we will structure our Artificial Network Network mainly depend on the problem (classification problem or regression problem) we are trying to solve and that has become largely interested subject for the convenience of handling complex and non-linear problems and they are applicable for wide range. Artificial Network Network consists of simple element which is parallel interconnected and is intended to interact with real world as the biological nervous system interacts. An unusual scheme based programming standpoint is offered by them which exhibit more speed computing compared to other conventional methods. Artificial Neural Network are characterized by the number of interconnections and the node characteristics that are classified by the kind of learning rules has been employed and the type of non-linear elements has been used. An organized topology of Processing Elements (PEs) which are called neurons composes Artificial Neural Network (ANN). In case of MFNN Processing Elements are arranged in layers and PEs in a adjacent layers are connected. The MFNN structure generally consists of three layers and those are the input layer, the hidden layer and the output layer.
Fig 5.1: Architecture of MFNN
5.2.2 Back Propagation Algorithm
For teaching artificial neural networks & performing a particular given task Back propagation is well known. In 1996, Arthur E. Bryson and Yu-Chi Ho has explained Back propagation algorithm..
BPA is a method of supervised learning which can be visualized as a generalized form of the delta rule. BPA demands a teacher that can predict desired output for any input in training set. For feedforward networks, BPA is much effective technique. The term "backward propagation of errors" is another definition back propagation algorithm. In case of Back propagation the activation function which is used by the artificial neurons has to be differentiable. For understanding, the back propagation learning algorithm can be divided into two phases. Phase: propagation and phase and the second one is weight update.
Classification of PQ Disturbances
C1 Normal Sinusoidal Signal C2 Sag Signal
C3 Swell Signal
C4 Normal Interruption Signal
Four classes PQ disturbances has been taken Classification Accuracy (%) = / ×100
Where, X= Number of samples correctly detected Y= Total number of samples considered
TABLE 4.5
Classification Results MFNN
Summary:
The Detection and classification of PQ disturbances is an important issue in the power quality analysis as before any mitigation action, the type of disturbance and the point of
disturbance are needed to take the corrective measure. In this work six different PQ disturbances are considered that includes complex disturbances like sag with harmonics and swell with harmonics for the characterization purpose. First of all these disturbances are decomposed into various levels using wavelet decomposition algorithm of wavelet transform and detected the point of disturbance along with the type of disturbance. This shows that the wavelet transform as a signal processing tool is quite efficient in analysing the PQ disturbances that may be stationary or non-stationary in nature. The WT is a frequency domain approach where the signals are analyzed at different frequency resolution levels. The Problem is encountered in detection when the signal is contaminated with a high density of noise or low signal to noise ratio. Also the feature vector to be extracted for the classification purpose will contain high percentage of noise which may degrade the classification accuracy.
Chapter 6 Detection of PQ Disturbances Using S-Transform:
6.1 Introduction:
As time frequency distribution Stockwell transform was developed for analyzing geophysics data. Stockwell transform is a generalized form of Short time fourier transform and it is extended version of continuous wavelet transform(CWT) and the disadvantages of wavelet transform can be overcome in S-transform. In case of S-transform modulation sinusoids are fixed with respect to time axis. These modulation sinusoids localizes the scalable Gaussian window. Actually S-transform doesn’t have cross-term problem. S-S-transform provides better signal clarity than Gabor transform. But, Stockwell transform has also disadvantages like itrequires higher complexity computation. The algorithm of stockwell transform was in 2010. Stockwell transform reduces the computational time and resources by atleast 4 orders of magnitude.
In noisy environment detection and localization of power quality disturbance, the capabilities of wavelet transform are often degraded. But using S-transform it can be correctly detected even in the presence of noise.
In case of wavelet transform, testing of various families of wavelet is required for better classification whereas S-transform does not require such several steps.
In this paper probabilistic neural network (PNN) has been used as classifier of detected signal. The features extracted from S-transform are given as input to PNN. Only four features are required for classification four type of PQD. As, a result computational time will also reduce.
6.2 The Discrete S-Transform:
Let p[kT] k=0,1,…..,N-1 define a discrete time series corresponding to a signal p(t) . Here, a time sampling interval of T. The discrete Fourier transform of the signal can be obtained as follows :
P[n/NT]=1/N∑_^( −1)p[kT]e^(-(2πnk/N)………. (6.1) Where n= 0, 1… N-1 and the inverse discrete Fourier Transform is p[kT]=∑ P[n/NT]e^(i2πnk/N) ……… (6.2)
S[n/NT,jT]=∑ P[min/NT]G(n,m)e^(i2πmj/N)……… (6.3)
6.3 Feature Extraction by S-Transform:
Stockwell transform performs multi-resolutional analysis on a power signal which varies with time, because window window width in case of S-transform varies inversely with frequency. At high frequency it gives hightime resolution, in case of low frequency it gives high frequency resolution. S-transform can also be applied effectively in case of non-stationary signal.
Here, the power signals simulated using MATLAB 13 at sampling frequency is 6.4 KHz. Four types power signal has been simulated. From, S-matrix features from voltage sag have been extracted. Applying standard statistical techniques onto S-matrix feature extraction extraction is done. Features such as energy, standard deviation, mean, amplitude of transformed signal are widely used classification. The following features are extracted:
1st feature: Standard deviation of the elements of maximum magnitude in each column of the S- matrix.
2nd feature: Energy elements corresponding of maximum magnitude in each column of the S- matrix.
3rd feature: Standard deviation maximum value in each row of the S- matrix.
4th feature: Standard deviation (S.D.) of the phase contour.
6.4 Probabilistic Neural Network (PNN):
For classifying patterns which are based on learning, neural networks are employed. In this paper probabilistic neural networks are employed. In this paper probabilistic neural networks are employs. In this paper probabilistic neural network (PNN) classifier has been presented. Here, only four features are required here. As a result, requirement of memory and computational time reduces. Probabilistic neural network can perform a effective classifier. The learning process is
fast for PNN, that’s why single pass network training is required even without any iteration PNN can adapt architectural changes itself. The learning efficiency of PNN is fast and structure of PNN is very simple. Comparing to MFNN and LVQ performance of PNN is more effective. A standard probabilistic neural network consists of following layers:
Input layer.
Pattern layer
Summation layer
Output layer
● Advantages:
Training process for PNN is faster than other neural network (NN).
Structure of PNN is inherently parallel.
As the size of representative training set increases, PNN can converge to an optimal classifier.
There are no local minima issues in case of PNN.
Without extensive retraining, training samples can be added or removed.
● Disadvantages
:
PNN require large memory.
Execution of network for PNN is slower.
Representative training set requirement.
Unlike back propagation PNN is not as general.
Classification Theory:
If the probability density function (pdf) of each of the populations is known, then an Unknown, X, belongs to class “i” if:
( ) > ( ), all ≠ is the pdf for class k
● Other parameters may be included
Probability of an unknown sample being drawn from a particular population.
Misclassification cost (c)
Cost of incorrectly classifying an unknown
Classification decision becomes
ℎ ( ) >ℎ ( ), all ≠ (Bayes optimal decision rule)
Training Set:
Training set is thoroughly representative of the actual population.
Fig 6.1: Architecture of Probabilistic Neural Network TABLE 6.1
Classification Results of PNN
Classification Results of MFNN & PNN for Three Classes
TABLE 6.3
Comparison of Accuracies with Three and Four Features
TABLE 6.4
Chapter 7 Conclusion and Future scope of work
7.1 Future scope of work:
1. In this work only two features like THD and Energy are considered for modeling the PQD detection system using MFNN is used for classification. More features associated with PQ signals like Entropy, standard deviation etc. can be included for modeling as well as classification purpose.
2. Classification of decomposed power signal using fuzzy logic and comparison the classification accuracy with MFNN and PNN.
3. In this paper, the effect of noise has not been discussed . In the further research work, the effect of noise part will be included. Instead of simulated signal, the real distorted signal which is measured by digital recorder can also be included in further research work and through a dsPIC based hardware, it can be implemented by real time.
7.2 Conclusion:
In this paper, firstly it is tried to classify pure sine and PQ disturbances such as voltage sag, voltage swell, and voltage with harmonics, transients and flicker at power system frequency. Before classification stage, data is normalized then five PQ disturbances and pure sine are decomposed by using 12 levels Daubechies-4 discrete wavelet filter and energy distributions of detail coefficients of PQ disturbances and pure sine are obtained. Pure sine is taken as a reference. When looking at variations in feature vector for PQ disturbances signals and pure sine, it is seen they are distinguished as visual and also data size is reduced. After obtaining feature vector, powerful classifier MFNN is used in classification stage 97.905 % average performance is obtained. This thesis proposed two kinds of classification algorithms for the disturbance types considered and could successfully use one of those algorithms to achieve a very high error classification rate. The use of wavelet multi-resolution analysis standard deviation curves along with fourier domain parameters with the help of a 4 layer feed forward neural network proved to achieve almost a zero error rate for the considered datasets. Also, the insights provided in this thesis on using clustering based wavelet MRA energy parameters along with Adaptive Resonance theory classification algorithms is worth further investigation.
References:
[1] Quinquis, “Digital Signal Processing using Matlab,” ISTE WILEY, pp.279-305, 2008. [2] P.S.Wright,”Short time fourier transform and wigner-ville distributions applied to the calibration of power frequency harmonic analyzers,” IEEE Trans.instrum.meas. (1999) 475-478. [3] Y.Gu,M.Bollen, “Time Frequency and Time Scale Domain Analysis of Voltage Disturbances,” IEEE Transactions on Power Delivery, Vol 15, No 4, October 2000, pp 1279-1284.
[4] G.T.Heydt, P.S. Fjeld, C.C.Liu, D.Pierce, L.Tu, G.Hensley,”Applications of the Windowed FFT to Electric Power Quality Assessment,” IEEE Trans.Power Deliv.Vol.14 (4) (1999) 1411-1416.
[5] R. Polikar, The Engineer’s Ultimate Guide to Wavelet analysis, The Wavelet Tutorial.March 1999.
[6] S.Santoso, W.M.Grady,E.J.Powers,J.Lamoree and S.C.Bhatt,”characterization of distribution power quality events with fourier and wavelet transforms,” IEEE Trans.power delivery,Vol.15,pp 247-254,jan.2000.
[7] Abdelazeem A.Abdelsalam, Azza A.Eldesouky,Abdelhay A.Sallam,”characterization of power quality disturbances using hybrid technique of linear kalman filter and fuzzy expert system,” ELSEVIER Electric power system Reaserch 83 (2012) 41-50.
[8] L.C.Saikia, S.M.Borah, S.Pait,”detection and classification of power quality disturbances using wavelet transform and neural network,” IEEE annual india conference 2010.
[9] S. Santoso, E. Powers, W. Grady, and P. Hoffmann,” Power Quality Assessment via Wavelet Transform Analysis,” IEEE Transactions on Power Delivery, Vol.11, No.2, pp. 924-930, April 1996.
[10] Peisheng Gao and Weilin Wu,“Power Quality DisturbancesClassification Using Wavelet & Support Vector Machine,” IEEE Proceedings of the Sixth International Conference on IntelligentSystems Design and Applications (ISDA'06).
[11] S. Tuntisak and S. Premrudeepreechacharn, “Harmonic Detection in Distribution System Using Wavelet Transform & Support Vector Machine,” IEEE Conference on Power Tech 2007. [12] IEEE Recommended Practice for Monitoring Electric Power Quality, IEEE Inc., New York, USA, 1995.
[13] J. J. Burke, D. C. Grifith, and J. Ward, “Power quality—Two different perspectives,” IEEE Transactions on Power Delivery, vol. 5, no.3, June 1990, pp. 1501-1513.
[14] G. Beylkin, R. Coifman, I. Daubechies, S. G. Mallat, Y. Meyer, L. Raphael and M. B. Ruskai, Introduction to Wavelets, Jones and Bartlett, Boston, 1991.
[15] I. Daubechies, “Ten Lectures on Wavelets”, CBMS-NSF Regional Conference Series in Applied Mathematics for the Society for Industrial and Applied Mathematics, Philadelphia, 1992.
[16] S. G. Mallat, “Multiresolution approximations and wavelet orthonormal bases” Transactions of American Mathematical Society, vol. 315, no. 1, 1989, pp. 69-87.
[17] M. P. Collins, W. G.Hurley, and E.Jones, “The application of wavelet theory in an expert system for power quality diagnostics,” 30th Universal Power Engineering Conference, 1995. [18] Oliver Poisson, Pascal Rioual and Michel Meunier, “New Signal processing tools applied to power quality analysis”, IEEE transactions on Power Delivery, vol. 14, no. 2, July 1999, pp. 324-327.
[19] Oliver Poisson, Pascal Rioual and Michel Meunier, “Detection and Measurement of Power quality disturbances using Wavelet transform”, IEEE transactions on Power Delivery, vol. 15, no. 3, July 2000, pp. 214-219.
[20] P K Dash, B K Panigrahi and G Panda, “Power quality analysis using S transform”, IEEE transactions on power delivery, vol. 18, no. 2, April 2003, pp. 23-29.
[21] M. P. Collins, W. G. Hurley, and E. Jones, “The application of wavelet theory to power quality diagnostics,” 29th Universal Power Engineering Conference, 1994.
[22] Y. Xu, X. Xiao,Y.Yang, and X. Chen, “Application of wavelet transform in power quality analysis,” Automated Electric Power Systems, vol. 23, no. 23, 1999, pp.87-93.
[23] A. M. Gouda, M. M. A. Salama, M. R. Sultan, and A. Y. Chikhani, “Application of multi resolution signal decomposition for monitoring short-duration variations in distribution systems,” IEEE Transactions on Power Delivery, vol. 15, no. 1, Apr. 2000, pp. 137-145.
[24] A. M. Gaouda, M. M. A. Salama, A. Y. Chikhani, and M. R. Sultan, “Application of wavelet analysis for monitoring dynamic performance in industrial plants,” North American Power Symposium, Laramie, WY, 1997.