This study linked data from the 2004 and 2006 administrations of Washington’s reading and math tests to
the Northwest Evaluation Association’s Measures of Academic Progress (MAP) assessment, a computerized
adaptive test used in schools nationwide. We found that Washington’s definitions of proficiency in reading
and mathematics are relatively challenging in comparison to the standards set by the other 25 states in this
study. In other words, Washington’s tests are above average in terms of difficulty.
Introduction
Washington
The level of difficulty stayed about the same from 2004 to 2006—during the No Child Left Behind era—except for fourth-grade reading, where it became easier.
This study found that Washington’s mathematics cut scores are relatively easier for the earlier grades than for the higher grades (taking into account the differences in subject content and children’s development). State policymakers might con-sider adjusting Washington’s cut scores to ensure equivalent difficulty at all grades so that elementary school students are on track to be proficient in the later grades.
What We Studied: Washington Assessment of Student Learning (WASL)
Washington currently uses a spring assessment called the Washington Assessment of Student Learning (WASL), which tests reading and math in grades 3 through 8 and grade 10, as required by NCLB. Students are also tested in science in grades 5, 8, and 10, and in writing in grades 4, 7 and 10. The current study linked reading and math data from the spring 2004 and spring 2006 WASL administrations to a common scale also administered in the 2004 and 2006 school years. To determine the difficulty of Washington’s proficiency cut scores, we linked data from state tests to the NWEA assess-ment. (A “proficiency cut score” is the score a student must achieve in order to be considered proficient.) This was done by analyzing a group of elementary and middle schools in which almost all students took both the state’s assessment and the NWEA test. (The methodology section of this report explains how performance on these two tests was compared.)
Part 1: How Difficult are Washington’s Definitions of Proficiency in Reading and Math
One way to evaluate the difficulty of a standard is to determine how many people attempting to attain it are likely to succeed. How do we know that a two-foot-high bar is easy to jump over? We know because, if we asked 100 people at random to attempt such a jump, perhaps 80 would make it. How do we know that a six-foot high bar is challenging? Because only one (or perhaps none) of those same 100 individuals would successfully meet that challenge. The same principle can be applied to academic standards. Common sense tells us that it is more difficult for students to solve algebraic equations with two unknown variables than it is for them to solve an equation with only one unknown variable. But we can figure out exactly how much more difficult by seeing how many eighth graders nationwide answer both types of questions correctly.
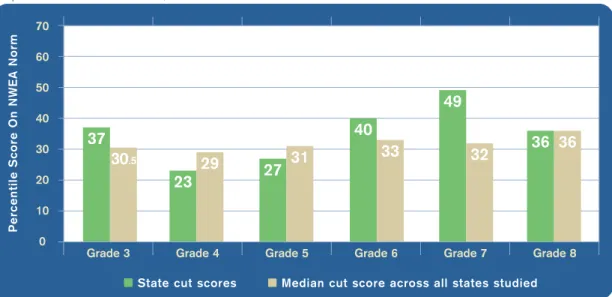
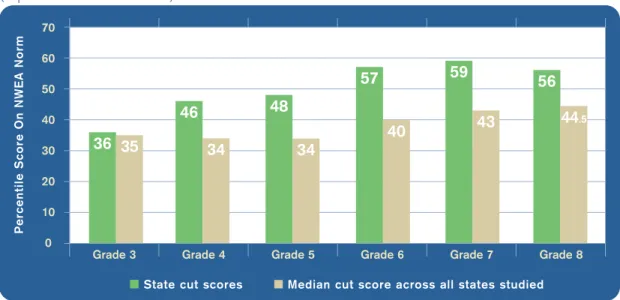
Applying that approach to this task, we evaluated the difficulty of Washington’s proficiency cut scores by estimating the proportion of students in NWEA’s norm group who would perform above the Washington cut score on a test of equivalent difficulty. The following two figures show the difficulty of Washington’s proficiency cut scores for reading (Figure 1) and mathematics (Figure 2) in 2006 in relation to the median cut score for all the states in the study. The proficiency cut scores for reading in Washington ranged between the 23rd and 49th percentiles for the norm group, with seventh grade being most challenging. In mathematics, the proficiency cut scores ranged between the 36th and 59th percentiles with seventh grade again being most challenging. With the exception of fourth grade reading, Washington’s cut scores in reading and mathematics are consistently at or above the median difficulty among the states studied. Note, though, that Washington’s cut scores for reading are generally lower
than its math cut scores. Thus, reported differences in achieve-ment between the two subjects may be more a product of differences in cut scores than in actual student achievement. In other words, Washington students may be performing worse in reading and better in mathematics than is apparent by just looking at the percentage of students passing state tests in those subjects.
Another way of assessing difficulty is to evaluate how Washington’s proficiency cut scores rank relative to other states. Table 1 shows that, except for third- and fourth-grade reading, the Washington cut scores generally rank in the middle to upper third in difficulty among the 26 states studied for this report. Its reading cut scores in grade 7 and its math cut scores in grades 7 and 8 are particularly high.
Per
centile Scor
e On NWEA Nor
m
State cut scores Median cut score across all states studied
Grade 3 70 60 50 40 30 20 10 0 37 30.5 Grade 4 23 29 Grade 5 27 31 Grade 6 40 33 Grade 7 49 32 Grade 8 36 36
Note: This figure compares reading cut scores (“proficiency passing scores”) as percentiles of the NWEA norm. These percentiles are compared with the median cut score of all 26 states reviewed in this study. Washington’s cut scores surpass the median cut scores in grades 3, 6, and 7, but not in the other grades.
Figure 1– Estimate of Washington Reading Cut Scores in Relation to All 26 States Studied, 2006
(Expressed in MAP Percentiles)
Per
centile Scor
e On NWEA Nor
m
State cut scores Median cut score across all states studied
Grade 3 70 60 50 40 30 20 10 0 36 35 Grade 4 46 34 Grade 5 48 34 Grade 6 57 40 Grade 7 59 43 Grade 8 56 44.5
Note: Washington’s math test cut scores are shown as percentiles of the NWEA norm and compared with the median cut scores of other states reviewed in this study. Washington’s cut scores surpass the median in grades 3 through 8.
Figure 2– Estimate of Washington Mathematics Cut Scores in Relation to All 26 States Studied, 2006
(Expressed in MAP Percentiles)
Reading Mathematics
Table 1– Washington Rank for Proficiency Cut Scores Among 26 States in Reading and Mathematics, 2006
5 20 17 9 3 9
12 5 7 5 4 4
Grade 3 Grade 4 Grade 5 Grade 6 Grade 7 Grade 8
Note: This table ranks Washington’s cut scores relative to the cut scores of the other 25 states in the study, with 1 being highest and 26 lowest.
Ranking (Out of 26 States)
Part 2: Changes in Cut Scores over Time
In order to measure their consistency, Washington’s proficiency cut scores were mapped to their equivalent scores on NWEA’s MAP assessment for the 2004 and 2006 school years. Proficiency cut scores for mathematics and reading were available for both years for grades 4 and 7.
States may periodically re-adjust the cut scores they use to define proficiency in reading and math, or may update the tests used to measure student proficiency. Such changes can impact proficiency ratings, not necessarily because student performance has changed, but because the measurements and criteria for success have changed. Plus, unintentional drift can occur even in states, such as Washington, that maintained their proficiency levels.
Is it possible, then, to compare the proficiency scores between the Washington’s tests at these two points in time? Yes. Assume that we’re judging a group of fourth graders on their high-jump ability and that we measure this by finding how many in that group can successfully clear a three-foot bar. Now assume that we change the measure and set a new height to judge proficiency. Perhaps students must now clear a bar set at one meter. This is somewhat akin to adjusting or changing a state test and its proficiency requirements. Despite this, it is still possible to determine whether it is more difficult to clear one meter than three feet, because we know the relationship between the measures. The same principle applies here. The measures or scales used by the WASL in 2004 and in 2006 can both be linked to the scale that was used to report MAP, which has remained consistent over time. Just as one can compare three feet to one meter and know that a one-meter jump is slightly more difficult than a three-foot jump, one can estimate the cut score needed to pass the WASL in 2004 and 2006 on the MAP scale and ascertain whether the test may have changed in difficulty. This allows us to reasonably estimate whether the WASL in 2006 is easier to pass, more difficult, or about the same as it was in 2004.
Washington’s estimated readingcut scores indicate a decrease in difficulty over this two-year period in the fourth grade (see Figure 3). Consequently, even if student performance stayed the same on an equivalent test like NWEA’s MAP assessment, one would expect the fourth-grade reading proficiency rate in 2006 to be 6 percent higher than in 2004. At grade 7, there was no change in the reading proficiency cut score. (Washington reported a 7-point gain for fourth graders over this period.)
Washington’s estimated mathematics cut scores show no substantive changes in the proficiency cut scores at fourth or seventh grades (see Figure 4). In other words, the difference in cut scores between 2004 and 2006 was less than the standard error of measurement, or 3 RIT points.
Thus, one could fairly say that Washington’s fourth-grade reading test was easier to pass in 2006 than in 2004. As a result, improvements in the state’s fourth-grade reading proficiency rate during this period may not be entirely a product of improved achievement. Because there were no substantive changes in the proficiency cut scores for fourth-grade math, or in either test in seventh fourth-grade, one could reasonably attribute any observed changes in proficiency ratings in these areas to actual changes in student performance.
Figure 3– Estimated Change in Washington’s Proficiency Cut Scores in Reading, 2004-2006 (Expressed in MAP Percentiles)
Spring ‘04 Spring ‘06 Difference Grade 4 Grade 7 80 70 60 50 40 30 20 10 0 29 49 23 49 -6 0
Note: This graphic shows how the difficulty of achieving proficiency in reading has changed. For example, fourth grade students in 2004 had to score at the 29th percentile of the NWEA norm group nationally in order to be considered proficient, while by 2006 fourth graders had only to score at the 23rd percentile of the NWEA norm group to achieve proficiency. The changes in grade 7 were within the margin of error (in other words, too small to be considered substantive.
Per
centile Cut Scor
e for
Pr
oficient
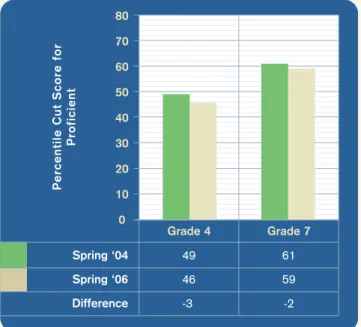
Figure 4– Estimated Differences in Washington’s Proficiency Cut
Scores in Mathematics, 2004-2006 (Expressed in MAP Percentiles)
Spring ‘04 Spring ‘06 Difference Grade 4 Grade 7 80 70 60 50 40 30 20 10 0 49 61 46 59 -3 -2
Note: This graphic shows that the difficulty of achieving proficient in math did not changed significantly. For example, fourth-grade students in 2004 had to score at the 49th percentile of the NWEA norm group nationally in order to be considered proficient, while in 2006, fourth graders had to score at the 46th percentile of the NWEA norm group to achieve proficiency— essentially no difference. The changes in both grades 4 and 7 were within the margin of error (in other words, too small to be considered substantive).
Per
centile Cut Scor
e for
Pr
Part 3: Calibration across Grades
Calibrated proficiency cut scores are those that are relatively equal in difficulty across all grades. Thus, an eighth-grade cut score would be no more or less difficult for eighth graders to achieve than a third-grade cut score is for third graders. When cut scores are so calibrated, parents and educators have some assurance that achieving the third-grade proficiency cut score puts a student on track to achieve the standards at eighth grade. It also provides assurance to the public that reported differences in performance across grades are a product of differences in actual educational attainment and not simply differences in the difficulty of the test.
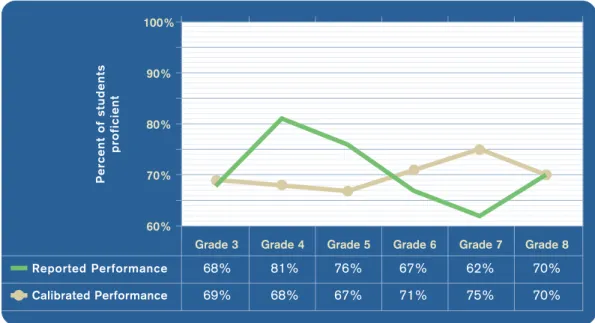
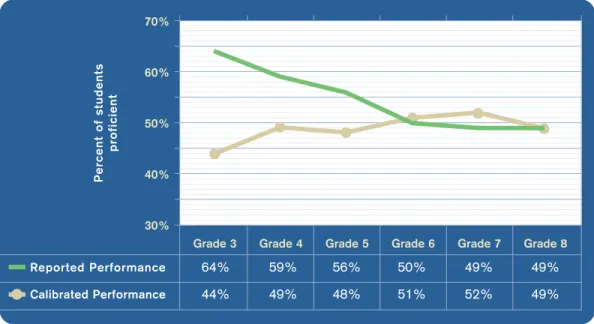
Examining Washington’s cut scores, we find that they are not well calibrated across grades. Figures 1 and 2 showed that Washington’s upper-grade cut scores in reading and mathematics tended to be more challenging than the cut scores in the lower grades, particularly for mathematics. The two figures that follow show Washington’s reported performance on the state test in reading (Figure 5) and mathematics (Figure 6) compared with the rate of proficiency that would be achieved if the cut scores were all calibrated to the grade-8 standard. When differences in grade-to-grade difficulty of the cut scores are removed, student performance is more consistent at all grades, especially in mathematics. This would lead to the conclusion that the higher rates of math proficiency that the state has reported for elementary school students are somewhat misleading. Per cent of students pr oficient Reported Performance Grade 3 100% 90% 80% 70% 60%
Grade 4 Grade 5 Grade 6 Grade 7 Grade 8
Calibrated Performance
68% 81% 76% 67% 62% 70%
69% 68% 67% 71% 75% 70%
Figure 5– Washington Reading Performance as Reported and as Calibrated to the Grade-8 Standard, 2006
Note: This graphic shows, for example, that if Washington’s grade-4 reading cut score was set at the same level of difficulty as its grade-8 cut score, 68 percent of fourth graders would achieve the proficient level, rather than 81 percent, as was reported by the state.
Policy Implications
When setting its cut scores for what constitutes proficiency in reading and math, Washington is relatively high, at least compared to the other 25 states in this study, except in grade-4 reading. This finding is consistent with the recent National Center for Education Statistics report, Mapping 2005 State
Proficiency Standards Onto the NAEP Scales, which found
Washington’s math standards to be in the top third and its grade-4 and grade-8 reading standards toward the middle of states studied. However, Washington’s expectations are not
smoothly calibrated across grades, particularly for mathematics. Students who are proficient in third grade are not necessarily on track to be proficient by eighth grade. State policymakers might consider adjusting their proficiency cut scores across grades so that parents and schools can be assured that elementary school students scoring at the proficient level are truly prepared for success later in their educational careers.
Per cent of students pr oficient Reported Performance Grade 3 70% 60% 50% 40% 30%
Grade 4 Grade 5 Grade 6 Grade 7 Grade 8
Calibrated Performance
64% 59% 56% 50% 49% 49%
44% 49% 48% 51% 52% 49%
Figure 6– Washington Mathematics Performance as Reported and as Calibrated to the
Grade-8 Standard, 2006
Note: This graphic shows, for example, that if Washington’s grade-3 mathematics cut score was set at the same level of difficulty as its grade-8 cut score, 44 percent of third graders would achieve the proficient level, rather than 64 percent, as was reported by the state.