Physica A 333 (2004) 529–540
www.elsevier.com/locate/physa
Detection of topological patterns in complex
networks: correlation pro$le of the internet
Sergei Maslov
a;∗, Kim Sneppen
b;c, Alexei Zaliznyak
aaDepartment of Physics, Brookhaven National Laboratory, Upton, NY 11973, USA bNiels Bohr Institute, Blegdamsvej 17, DK-2100, Copenhagen, Denmark cDepartment of Physics, Norwegian University of Science and Technology,
Trondheim N-7491, Norway
Abstract
A general scheme for detecting and analyzing topological patterns in large complex networks is presented. In this scheme the network in question is compared with its properly randomized version that preserves some of its low-level topological properties. Statistically signi$cant de-viation of any topological property of a network from this null model likely re1ects its design principles and/or evolutionary history. We illustrate this basic scheme usingthe example of the correlation pro$le of the Internet quantifying correlations between degrees of its neighboring nodes. This pro$le distinguishes the Internet from previously studied molecular networks with a similar scale-free degree distribution. We $nally demonstrate that the clustering in a network is very sensitive to both the degree distribution and its correlation pro$le and compare the clustering in the Internet to the appropriate null model.
c
2003 Elsevier B.V. All rights reserved. PACS:89:75:−k; 89.70.+c; 05:10:−a; 05.65.+b
Keywords:Random networks; Scale free networks; Correlation pro$le; Cliquishness; Metropolis; Network motifs
Networks have emerged as a unifying theme in complex systems research. It is in fact no coincidence that networks and complexity are so heavily intertwined. Any future de$nition of a complex system should re1ect the fact that such systems consist of many mutually interactingcomponents. These components are not identical as say electrons
∗Correspondingauthor. Tel.: +1-631-344-3742; fax: +1-631-344-2918.
E-mail address:[email protected](S. Maslov).
0378-4371/$ - see front matter c2003 Elsevier B.V. All rights reserved. doi:10.1016/j.physa.2003.06.002
in condensed matter physics. Instead each of them has a unique identity separatingit from others. The very basic question one may ask about a complex system is which other components a given component interacts with? Systemwide this information can be visualized as a graph whose nodes correspond to individual components and edges to their mutual interactions. Such a network can be thought of as a backbone of the complex system along which propagate various signals and perturbations.
Living organisms provide us with a quintessential paradigm for a complex system. Therefore, it should not be surprisingthat in biology networks appear on many diEerent levels: from genetic regulation and signal transduction in individual cells, to neural system of animals, and $nally to food webs in ecosystems. However, complex networks are not limited to livingsystems: in fact they lie at the foundation of an increasing number of arti$cial systems. The most prominent example of this is the Internet and the World Wide Web beingcorrespondingly the “hardware” and the “software” of the network of communications between computers.
An interestingcommon feature of many complex networks is an extremely broad, often scale-free, distribution of degrees (de$ned as the number of immediate neighbors) of their nodes [1]. While the majority of nodes in such networks are each connected to just a handful of neighbors, there exist a few hub nodes that have a disproportionately large number of interaction partners. The distribution of degrees is an example of a low-level topological property of a network. The degree of a node counts how many neighbors it has, but, being a single node property, it contains no information about the identity of those neighbors. It is clear that most of non-trivial properties of networks lie in the coordinated way in which their nodes are connected to each other. However, such multi-node patterns are rather diKcult to identify and quantify. By just lookingat many large complex networks one gets the impression that they are wired in a rather haphazard way. One may wonder which topological properties of a given network are indeed random, and which arose due to evolution and/or fundamental design principles and limitations? Such non-random features can then be used to identify the network and better understand the underlyingcomplex system.
In this work we propose a universal recipe for how such information can be ex-tracted. To this end we $rst construct a properly randomized null model of a given network. As was pointed out in Ref. [2], broad distributions of degrees observed in most complex networks indicate that in such networks the degree is an important in-dividual characteristic of a node and as such it should be preserved in any meaningful randomization process. In addition to degrees one may choose to preserve some other low-level topological properties of the network. Any higher level topological prop-erty, such as e.g. the pattern of correlations between degrees of neighboring nodes, the number of loops of a certain type, the number and sizes of components, the di-ameter of the network, spectral properties of its adjacency matrix, can then be mea-sured in the real complex network and separately in an ensemble of its randomized counterparts. Dealingwith the whole ensemble allows one to put error bars on any quantity measured in the randomized network. One then concentrates only on those topological properties of the complex network that signi$cantly deviate from the null model, and, therefore, are likely to re1ect its basic design principles and/or evolutionary history.
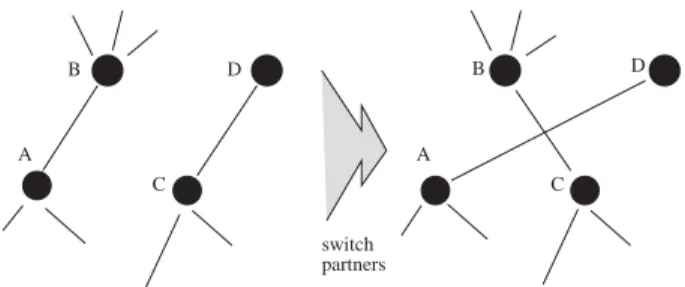
switch partners A C D B A C B D
Fig. 1. One elementary step of the local rewiring algorithm. A pair of edges A–B and C–D is randomly selected. They are then rewired in such a way that A becomes connected to D, and C to B, provided that none of these edges already exist in the network, in which case the rewiring step is aborted, and a new pair of edges is selected. The last restriction prevents the appearance of multiple edges connecting the same pair of nodes.
Thelocal rewiring algorithmthat randomizes a network yet strictly conserves degrees of its nodes [3]1 consists of repeated application of the elementary rewiringstep shown and explained in detail in Fig.1. It is easy to see that the number of neighbors of every node in the network remains unchanged after an elementary step of this randomization procedure. The directed network version of this algorithm separately conserves the number of upstream and downstream neighbors (in- and out-degrees) of every node. The matlab programs for both directed and undirected versions of this algorithm can be downloaded at our webpage.2
Another simple numerical algorithm generating such a random network “from scratch” was proposed in Ref. [2].3 It starts with assigning to each node a number
ki of “edge stubs” equal to its desired degree. A random network is then constructed by randomly pickingtwo such edge stubs and joiningthem together to form a real edge connecting these two nodes. One of the limitations of this “stub reconnection” algorithm is that for broad distribution of degrees, which is usually the case in com-plex networks [1], the algorithm generates multiple edges joining the same pair of hub nodes. This problem cannot be avoided by simply not allowingmultiple edges to form during the reconnection process as in this case the whole algorithm would get stuck in a con$guration in which the remaining edge stubs have no eligible partners.4 Fortunately the local rewiringalgorithm [3] (see footnote 1) instead of completely deconstructinga network and then randomly puttingit back together, only gradually
1These algorithms $rst appeared in the context of random matrices in Gale [4]. More recently they were
used in the graph–theoretical context of Kannan et al. [4].
2The matlab programs simulatingseveral versions of the local rewiringalgorithm can be downloaded for
non-commercial purposes athttp://www.cmth.bnl.gov/∼maslov/matlab.htm 3This algorithm also $rst appeared in the mathematical literature [5].
4We have numerically studied this question for the scale-free network of the Internet, described in details
later on in the text. The edge reconnection algorithm not allowing for the formation of multiple links got stuck every time we tried it. It, was found that in the resultingnetwork the average number of unconnected edge stubs is 23 times its standard deviation, which completely precludes even the occasional completion of this algorithm.
changes its wiring pattern. Hence, any topological constraint such as e.g. that of no multiple edges, or no disconnected components, can be maintained at each step of the way.
Once an ensemble of randomized versions of a given complex network is generated, the abundance of any topological pattern is compared between the real network and characteristic members of this ensemble. This comparison can be quanti$ed usingtwo natural parameters: (1) the ratioR(j)=N(j)=Nr(j), whereN(j) is the number of times
the pattern j is observed in the real network, and Nr(j) is the average number of its
occurrences in the ensemble of its random counterparts; (2) theZ-score of the deviation de$ned as Z(j) = [N(j)−Nr(j)]=PNr(j), where PNr(j) is the standard deviation of Nr(j) in the randomized ensemble. This general idea was recently applied to protein
networks in yeast [3] and E. coli [6].
We now illustrate our general methods using the example of the Internet, de$ned on the level of autonomous systems (AS). Autonomous Systems are large groups of workstations, servers, and routers usually belonging to one organization such as e.g. a university, or a business enterprise. The data on direct connections between Autonomous Systems is regularly updated and is available on the website of the National Laboratory for Applied Network Research.5 Such coarse-grained structure of the Internet was the subject of several recent studies [7–10]. In the followinganaly-sis we use the millennium snapshot of the Internet (data from January 2, 2000), when N= 6474 Autonomous Systems were linked by E= 12572 bi-directional edges.
It was recently reported [7] that the Internet is characterized by a scale-free distribu-tion of AS degreesp(K)˙1=K= 1=K2:1±0:2. One can show that for such a scale-free
network the above mentioned constraint of no multiple connections between nodes is extremely important. Indeed, degrees of the two highest connected hubs in a scale-free network scale as kmax ∼ N1=(−1). In an uncorrelated random network with no
con-straints on edge multiplicity the expected number of edges connecting these two hubs scales as k2
max=(2E)∼N2=(−1)−1 (here we assumed that E ∼N). When ¡3 it
in-creases inde$nitely as N to ∞. For the Internet that corresponds to the two largest hubs with degrees of respectivelyK0=1458 and K1=750 beingconnected by as many
as K0K1=(2E) = 1458·750=(2·12572) = 43:5 edges! Hence, in this case a random
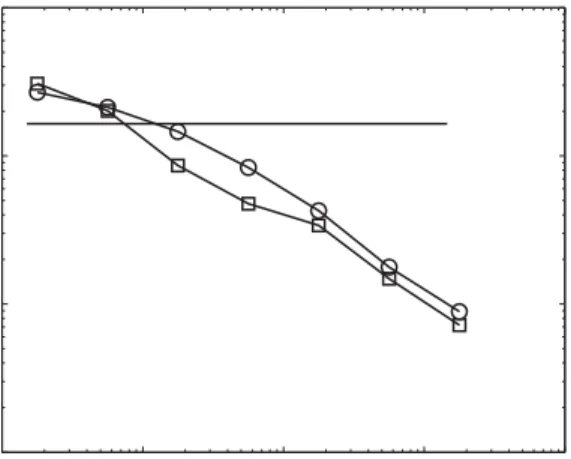
network ensemble generated by our local rewiring algorithm is very diEerent from the one generated by the stub reconnection algorithm and analytically studied in Ref. [2]. Fig. 2 shows the average degree K1K0 of neighbors of nodes with the degree K0
in the real Internet (squares) as well as in a typical random network with no multiple connections between nodes generated by our local rewiring algorithm (circles). From this $gure it is clear that most of the K1K0˙K0−0:5 dependence reported in Ref. [8]
is reproduced in our random ensemble and hence can be attributed to the eEective repulsion between hubs due to the constraint of havingno more than one edge directly connectingthem to each other. In the absence of correlations between degrees of neighboring nodes by de$nition one hasK1K0=const=K2=K[2]. This expression,
shown as a horizontal line in Fig. 2, applies only to a randomized network in which multiple edges between a pair of nodes are allowed. In a random scale-free network
100 101 102 103 104 100 101 102 103 K 0 <K 1 >
Fig. 2. The average degreeK1K0 of neighbors of nodes with degreeK0 in the Internet (squares) and its
typical randomized counterpart (circles). Error bars in multiple realizations of the randomized network are smaller than symbol sizes. The horizontal line is the analytical result K1K0= const =K2=K 165
valid for a random network in which multiple edges between pairs of nodes are allowed [2].
with no multiple edges the conditional probability distribution P(K1|K0) crosses over fromK1=K1 for K1K1∗= 2E=K0 to 1=K1power law tail for K1K1∗. Such a crossover results in an asymptotic scaling K1K0 ∼K0−3. We have con$rmed numerically that P(K1|K0) in our randomized ensemble is very similar to that measured in the real Internet [10].
From the above discussion one may get the impression that the topology of the Internet is in perfect agreement with its randomized version. This is however not true. Let N(K0; K1) to denote the total number of edges connecting nodes with
de-grees K0, and K1.6 This is an example of a higher level topological property of a
complex network, which can be compared to its average value Nr(K0; K1) in the
ap-propriate null-model network. By comparingN(K0; K1) and Nr(K0; K1) one studies the
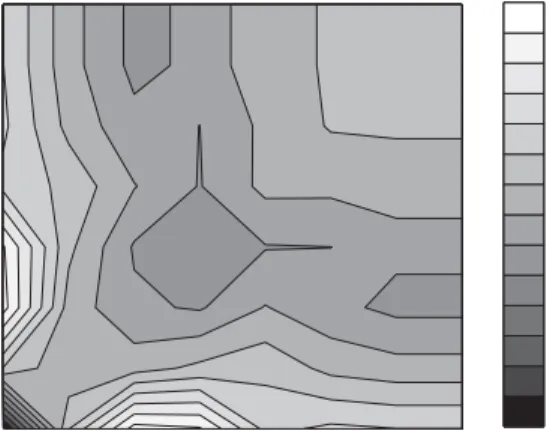
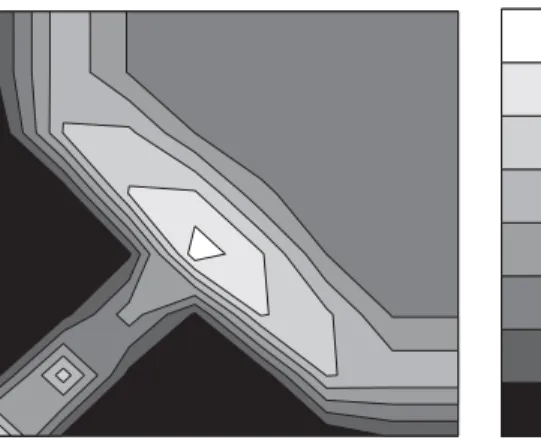
correlation pro7le of the complex network, quantifyingthe correlations in degrees of neighboring nodes. In Fig. 3 we visualize the correlation pro$le of the Internet by plottingthe ratio R(K0; K1) =N(K0; K1)=Nr(K0; K1). Regions on the K0 −K1 plane,
whereR(K0; K1) is above (below) 1 correspond to enhanced (suppressed) connections
between nodes with degrees K0 and K1 in the Internet compared to its randomized
counterpart. The statistical signi$cance of these deviations, measured by the Z-score Z(K0; K1) = (N(K0; K1)−Nr(K0; K1))=PNr(K0; K1), is shown in Fig. 4. To improve
the statistics, in all correlation pro$les studied in this paper we logarithmically binned the degrees K0 and K1 at two bins per decade. In Figs. 3 and 4 one can see several
0.4 0.6 0.8 1 1.2 1.4 1.6 1 1 3 3 10 10 30 30 300 300 1000 1000 3000 3000 K0 K1 100 100
Fig. 3. Correlation pro$le of the Internet. The ratioR(K0; K1) =N(K0; K1)=Nr(K0; K1), whereN(K0; K1) is
the total number of edges in the Internet connecting pairs of Autonomous Systems with degreesK0 andK1,
whileNr(K0; K1) is its average value in the ensemble of randomized versions of the Internet, generated by
the local rewiringalgorithm described in the text.
-35 -30 -25 -20 -15 -10 -5 0 5 10 15 20 25 1 1 3 3 10 10 30 30 300 300 1000 1000 3000 3000 K0 K 1 100 100
Fig. 4. Statistical signi$cance of correlations in the Internet. The Z-score of correlation patterns in the InternetZ(K0; K1) = (N(K0; K1)−Nr(K0; K1))=PNr(K0; K1). Here PNr(K0; K1) is the standard deviation of
Nr(K0; K1) measured in an ensemble of 1000 randomized networks.
prominent features:
• Strong suppression of edges between nodes of low degrees 3¿K0; K1¿1.
• Suppression of edges between nodes of intermediate degrees 100¿ K0; K1¿10,
• Strongenhancement of the number of edges connectinga node of a low degree 3¿K0¿1 to that of an intermediate degree 100¿ K1¿10.
On the other hand any pair among the 5 highest degree nodes with K0; K1¿300 was found to be connected by an edge, both in the real network, and in a typ-ical random network. Hence R(K0; K1) is close to 1 in the upper right corner of Fig.3.
The strongsuppression of connections between pairs of nodes with low degrees can in part be attributed to the constraint that all AS on the Internet have to be connected to each other by at least one path. For example, this constraint explicitly forbids links between a pair of nodes with the degree of 1. However, when we used an ensemble of random networks in which the formation of isolated clusters was prevented at ev-ery rewiringstep, we found vev-ery little change in the observed correlation pro$le. The division of all nodes on the Internet into three distinct groups of low-, intermediate-, and highly-connected ones visible in its correlation pro$le may be due to its hierarchi-cal structure of, correspondingly, users, low-level (possibly regional) Internet service providers (ISP), and high-level (global) ISP. Similar hierarchical picture was recently suggested in Ref. [12] on the basis of the traceroute data.
It is worthwhile to note that the correlation pro$le of the Internet measured in this work makes it qualitatively diEerent from yeast protein networks analyzed by us earlier [3]. Those molecular networks are characterized by suppressed connections between nodes of very high degree, and increased number of links between nodes of intermediate degree. Thus correlation pro$le allows one to diEerentiate between complex networks with very similar (scale-free) degree distributions.
The correlation pro$le is by no means the only topological pattern one can investigate in a given complex network, with other examples being its spectral dimension [13], the betweenness of its edges and nodes [14,8], feedback, feed-forward loops, and other small network motifs [6]. In the rest of this paper we analyze the level of clustering [15] of the Internet, quanti$ed by its number of loops of length 3 (triangles). The real Internet contains 6584 such loops, while its random counterparts, generated by our local rewiringalgorithm, have 8636±224 triangles (this and all future results were measured in an ensemble of 100 randomized networks.) Thus the clusteringof the real Internet is some 9 standard deviations below its value in a randomized network! This result is surprisingbecause there are good reasons for the Internet to have above average level of clustering. Indeed, one expects its nodes to preferentially link according to their geographical location [8,9], general type of business or academic enterprises they represent, etc. All these factors usually tend to increase clustering[15]. On the other hand, the correlation pro$le of the Internet visualized in Fig. 3 naturally leads to the reduction in clustering. Indeed, the suppression of connections from nodes with intermediate degrees to other such nodes in favor of nodes with low degrees reduces the number of triangles in the network.
In order to explore the interplay between the level of clusteringin the network and its correlation pro$le we studied two “extremal” random networks with the same degrees of individual nodes as the real Internet. The $rst network contained no triangles, while the second one had 59144 triangles. Both networks were generated using a simple modi$cation of our basic local rewiringalgorithm in which a rewiringstep was accepted only if it did not increase (in the $rst case) or decrease (in the second case) the number of triangles in the network. This adds a zero-temperature Metropolis
0.2 0.4 0.6 0.8 1 1.2 1 1 3 3 10 10 30 30 300 300 1000 1000 3000 3000 K0 K1 100 100
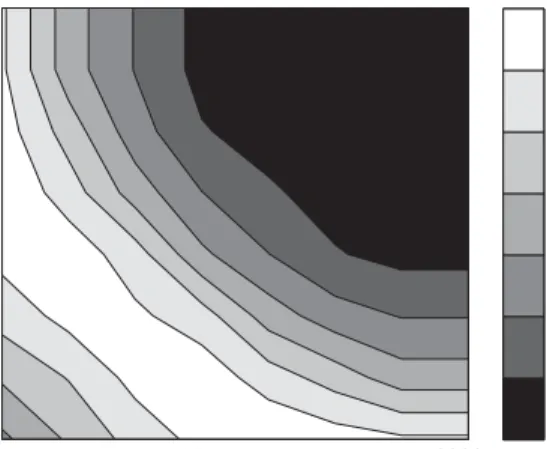
Fig. 5. The correlation pro$leR(K0; K1) of a network with the same set of degrees as the Internet but with
no triangles. Note the suppression of connections between diEerent hubs in favor of connections between hubs and nodes of low degree.
dynamics [16] to the elementary “edge swapping” step of our algorithm,7 in which the energy function is the number of triangles taken with an appropriate sign. In the $rst case after some transient time all triangles have disappeared from the network, at which point we measured its correlation pro$le (Fig. 5). In the second case our algorithm was designed to generate a network with the largest possible number of triangles. Computer time limitations have forced us to stop the program when we reached 59144 triangles, which as will be shown later is rather close to the absolute maximum of 63844 triangles for a given set of node degrees. The correlation pro$le of this very clustered network is shown in Fig. 6. From Fig. 5 one concludes that the correlation pro$le in which connections between hubs are suppressed in favor of connections between hubs and nodes of low degree favors a reduced number of triangles. If instead nodes with similar degrees (including hubs) prefer to connect to each other (the light-colored area on and around the diagonal in Fig. 6) the number of triangles increases. This can be demonstrated analytically. Consider an edge connecting a pair of nodes with degreesK0 andK1. The maximal number of triangles containing this edge is min(K0−
1; K1−1). Indeed, in the best case scenario all K −1 remainingneighbors of the
smaller degree node are also neighbors of the larger degree node. Therefore, given a correlation pro$le speci$ed byN(K0; K1)—the number of edges connecting nodes with
degreesK0; K1—the absolute maximum number of triangles in the network is given by Nmax
=
K0;K1 N(K0; K1)min(K0−1; K1−1)=6. Here the factor
1
6 corrects for the fact
that in our countingscheme each triangle would be counted 2 times alongeach of its
7A diEerent Metropolis dynamics in which edges are rewired one at time was used to generate random
0.5 1 1.5 2 2.5 3 3.5 1 1 3 3 10 10 30 30 300 300 1000 1000 3000 3000 K0 K1 100 100
Fig. 6. The correlation pro$leR(K0; K1) of a network with the same set of degrees as the Internet but with
a very large number of triangles (59144). Note the tendency of nodes with similar degrees to connect to each other.
three sides. Usingidentities min(K0−1; K1−1) = (K0−1 +K1−1)=2− |K0−K1|=2 andK0;K1 N(K0; K1)(K0−1) =K0;K1 N(K0; K1)(K1−1) =NK(K−1) one $nally gets: Nmax =NK(K6−1)−121 K0;K1 N(K0; K1)|K0−K1|: (1) The $rst part of this expression corresponds to a hypothetical situation of the maximal cliquishness in which all neighbors of every node are connected to each other. It is easy to see that except for some very special cases of the distribution of degrees such maximal cliquishness can never be realized. Indeed, whenever a pair of nodes of unequal degrees K0; K1 are connected to each other the second term in the Eq. (1)
decreases the maximal number of triangles. Given the set of node degreesKi, one can easily construct the network with the largest possible number of triangles. One starts by connectingthe largest hub node to other nodes in the order of decreasingdegrees. In the second round of this algorithm one selects the remaining neighbors of the second largest hub in the order of decreasing degree. The process continues round by round until neighbors of all nodes are speci$ed. When a node reaches its desired degree it will be simply skipped duringlater rounds of this algorithm. One can show that the network generated by this algorithm has the smallest value ofK0;K1 N(K0; K1)|K0−K1|and the
largest number of triangles among all networks with a given set of node degrees. In case of the Internet such network has 63,884 triangles just below theNmax
=64;702 speci$ed by its correlation pro$le. These numbers of triangles are an order of magnitude below the naive estimate NK(K −1)=6 690;000 traditionally used as a normalization factor in the formula for the clusteringcoeKcient of a network [15]. Hence, based on
the traditional de$nition even the “loopiest” network with the same node degrees as the Internet has a clusteringcoeKcient of only 0.09! For the “native” correlation pro$le of the Internet Eq. (1) predicts the maximal number of triangles close to 24,000, which sets the observed level of clustering(6584 triangles) around 27% of its maximal value for this correlation pro$le.
In order to check if degree correlations visible in the correlation pro$le of the In-ternet (Fig. 3) fully account for the observed number of triangles we generated an ensemble of random networks that preserves not only degrees but also the correlation pro$le of the complex network. To this end we used a modi$cation of our main local rewiringalgorithm. There are two principal ways in which this can be done. In the $rst scheme, reminiscent of generating a microcanonical ensemble in statistical physics, one allows only for those local rewiringsteps that strictly conserve the number of edges N(K0; K1) between nodes with degrees K0; K1. This is achieved by constrainingthe
selection of pairs of edges for the rewiring step of Fig. 1 only to those connecting nodes with degrees K0; K1, and K0; K1. It is easy to see that such a local rewiring
step strictly conservesN(K0; K1). In practice we softened randomization constraints by
coarse-graining the logarithm of degree to half-decade bins. Using this “microcanonical algorithm” we generated an ensemble of networks with 4132±75 loops. The fact that the number of loops in the real Internet (6584) is now signi$cantly larger than in these random networks, con$rms the intuitive notion that the Internet is indeed characterized by a signi$cant degree of clustering. We have also found that this 60% increase in the level of clusteringis equally spread over the whole spectrum of degrees.
As is always the case with microcanonical algorithms one should worry if the above algorithm is ergodic. In other words there is no guarantee that in this algo-rithm the system does not get trapped in a disconnected component of the phase space. This is easily checked by annealingthe network usinga canonical Metropolis [16] version of our algorithm with the energy function or Hamiltonian given by H=
K0;K1 [N(K0; K1)−Nr(K0; K1)]
2=N(K
0; K1), and samplingnetworks at a $nite
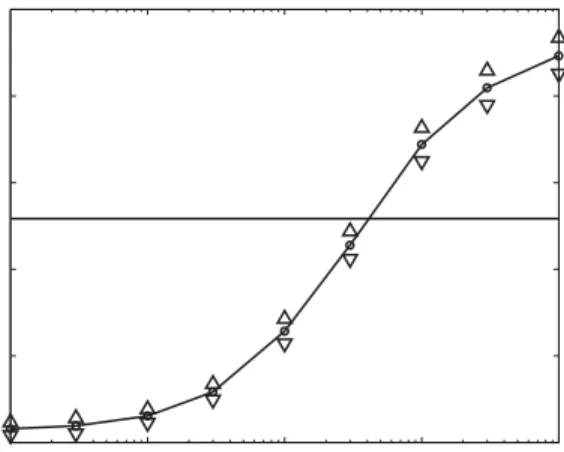
tem-perature T. Local moves loweringthe Hamiltonian are always accepted, while those increasingit by PH are only accepted with the probability exp(−H=T). As seen in Fig. 7 the above algorithm nicely extrapolates between the microcanonical algorithm for small T and the unrestricted local rewiring algorithm for large T. This con$rms that our microcanonical algorithm is indeed ergodic.
Another conceivable use of the Metropolis algorithm described above is to generate an arti$cial network with a given distribution of degreesp(K) and a given correlation pro$leR(K0; K1). To achieve this one $rst generates a seed network with a givenp(K),
e.g. by the stub reconnecting algorithm of Ref. [2] (see footnote 3). This network is $rst annealed using the Metropolis algorithm with the energy functional punishing multiple connections between nodes. The resultingnetwork, containingno multiple connections is subsequently annealed with another energy functional favoring the desired correlation pro$le. This results in an ensemble of random networks with no multiple connections between nodes and the desired correlation pro$le.
In summary we have proposed a general algorithm to detect characteristic topological features in a given complex network. In particular, we introduced the concept of the correlation pro7le, which allowed us to quantify diEerences between diEerent complex
10-2 10 -1 100 101 102 4000 5000 6000 7000 8000 9000 Temperature Number of loops
Fig. 7. The number of loops as a function of the Metropolis temperature observed in an ensemble of random versions of the Internet. Random networks were generated by the Metropolis [19] version of the local rewiring algorithm with the energy functionH=K0;K1[N(K0; K1)−Nr(K0; K1)]2=N(K0; K1). Upper and
lower triangles represent the standard deviation within an ensemble. The horizontal line shows the actual number of triangles (6584) in the Internet.
networks even when their degree distributions are similar to each other. Applied to the Internet, this pro$le identi$es hierarchical features of its structure, and helps to account for the level of clusteringin this network.
Work at Brookhaven National Laboratory was carried out under Contract No. DE-AC02-98CH10886, Division of Material Science, U.S. Department of Energy.
References
[1] A.-L. Barabasi, R. Albert, Science 286 (1999) 509–512.
[2] M.E.J. Newman, S.H. Strogatz, D.J. Watts, Phys. Rev. E 64 (026118) (2001) 1–17;
M.E.J. Newman, in: S. Bornholdt, H.-G. Schuster (Eds.), Handbook of Graphs and Networks, Wiley-VCH, Berlin, 2002, pp. 35–65.
[3] S. Maslov, K. Sneppen, Science 296 (2002) 910–913. [4] D. Gale, Paci$c J. Math. 7 (1957) 1073–1082;
H.J. Ryser, Recent Advances in Matrix Theory, Univ. of Wisconsin Press, Madison, 1964, pp. 103–124;
R. Kannan, P. Tetali, S. Vempala, Random Struct. Algorithms 14 (1999) 293–308. [5] E.A. Bender, E.R. Canfeld, J. Combin. Theory A 24 (1978) 296–307.
[6] S.S. Shen-Orr, R. Milo, S. Mangan, U. Alon, Nature Genetics 31 (2002) 64–68. [7] M. Faloutsos, P. Faloutsos, C. Faloutsos, Comput. Commun. Rev. 29 (1999) 251. [8] R. Pastor-Satorras, A. Vazquez, A. Vespignani, Phys. Rev. Lett. 87 (258701) (2001) 1–4;
A. Vazquez, R. Pastor-Satorras, A. Vespignani, Phys. Rev. E 65 (2002) 066130.
[9] S.-H. Yook, H. Jeong, A.-L. Barabasi, Proc. Natl. Acad. Sci. USA 99 (2001) 13382–13386. [10] K.-I. Goh, B. Kahng, D. Kim, Phys. Rev. Lett. 88 (2002) 108701.
[11] P.L. Krapivsky, S. Redner, Phys. Rev. E 63 (066123) (2001) 1–14; D.S. Callaway, et al., Phys. Rev. E 64 (041902) (2001) 1–7.
[12] A. Capocci, G. Caldarelli, R. Marchetti, L. Pietronero, Phys. Rev. E 64 (2001) 035105. [13] S. Bilke, C. Peterson, Phys. Rev. E 64 (2001) 036106.
[14] M. Girvan, M.E.J. Newman, Proc. Natl. Acad. Sci. USA 99 (2002) 8271–8276. [15] D. Watts, S. Strogatz, Nature 293 (1998) 400–403.
[16] N. Metropolis, et al., J. Chem. Phys. 21 (1953) 1087. [17] D. Strauss, SIAM Review 28 (1986) 513–527.